Zip Codes with the Highest Percentage of Population Employed in Real Estate, Rental & Leasing in the United States
RELATED REPORTS & OPTIONS
Real Estate, Rental & Leasing
United States
Compare Zip Codes
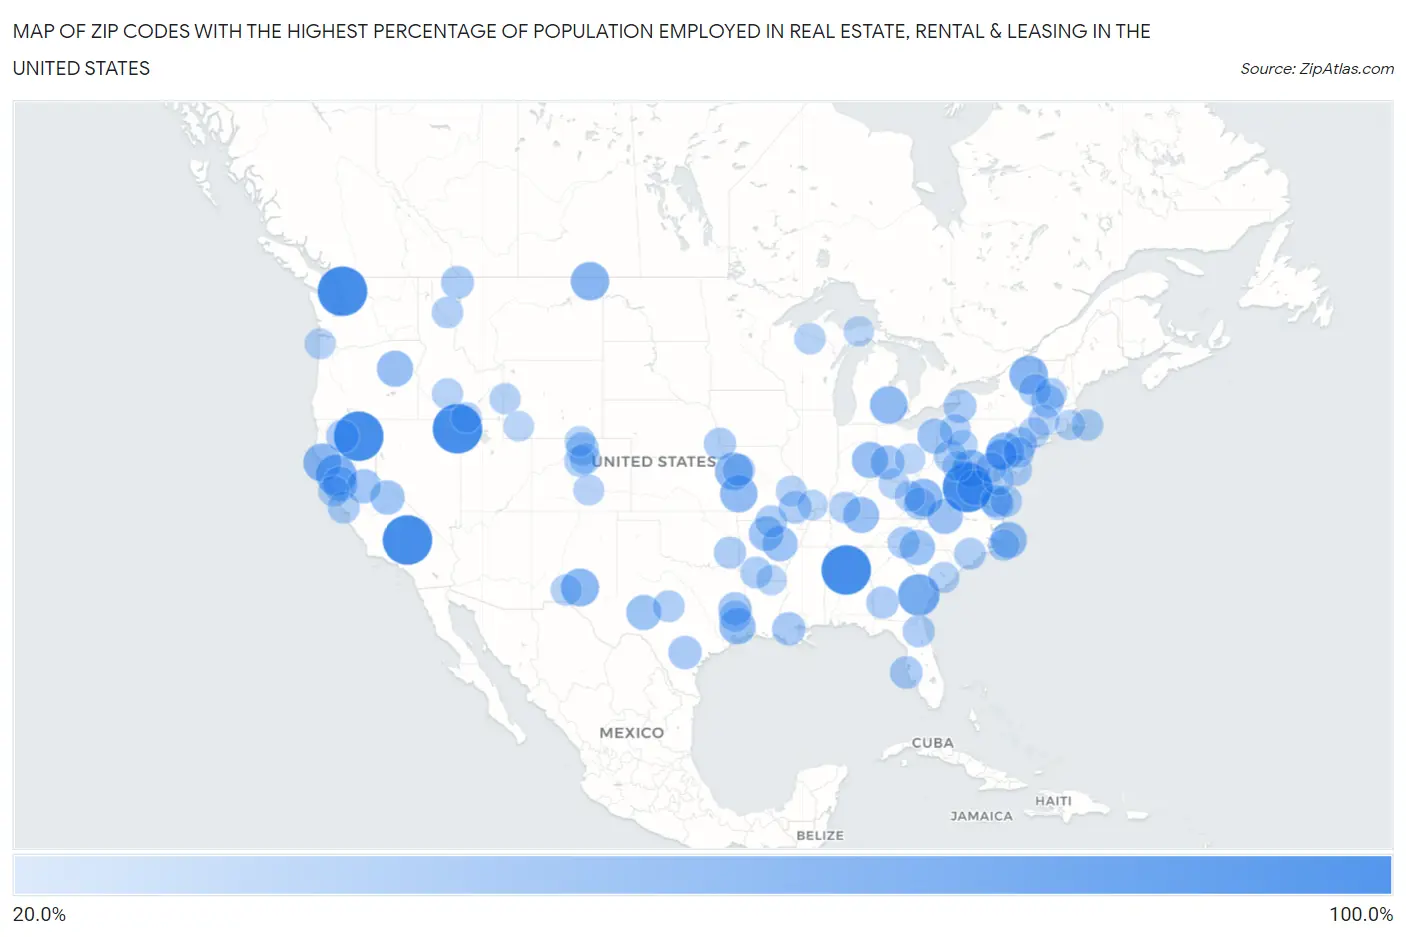
Map of Zip Codes with the Highest Percentage of Population Employed in Real Estate, Rental & Leasing in the United States
20.0%
100.0%
Zip Codes with the Highest Percentage of Population Employed in Real Estate, Rental & Leasing in the United States
| Zip Code | % Employed | vs State | vs National | |
| 1. | 96068 | 100.0% | 2.1%(+97.9)#1 | 1.9%(+98.1)#1 |
| 2. | 35181 | 100.0% | 1.5%(+98.5)#1 | 1.9%(+98.1)#2 |
| 3. | 93554 | 100.0% | 2.1%(+97.9)#2 | 1.9%(+98.1)#3 |
| 4. | 89830 | 100.0% | 2.5%(+97.5)#1 | 1.9%(+98.1)#4 |
| 5. | 22723 | 100.0% | 1.9%(+98.1)#1 | 1.9%(+98.1)#5 |
| 6. | 98238 | 100.0% | 2.1%(+97.9)#1 | 1.9%(+98.1)#6 |
| 7. | 30423 | 66.7% | 2.0%(+64.7)#1 | 1.9%(+64.8)#7 |
| 8. | 95443 | 61.5% | 2.1%(+59.4)#3 | 1.9%(+59.6)#8 |
| 9. | 12977 | 54.5% | 2.2%(+52.3)#1 | 1.9%(+52.7)#9 |
| 10. | 59257 | 53.8% | 1.8%(+52.0)#1 | 1.9%(+52.0)#10 |
| 11. | 95488 | 52.6% | 2.1%(+50.5)#4 | 1.9%(+50.7)#11 |
| 12. | 88350 | 51.9% | 1.6%(+50.3)#1 | 1.9%(+50.0)#12 |
| 13. | 48816 | 50.1% | 1.5%(+48.6)#1 | 1.9%(+48.3)#13 |
| 14. | 64092 | 50.0% | 1.6%(+48.4)#1 | 1.9%(+48.1)#14 |
| 15. | 19535 | 50.0% | 1.5%(+48.5)#1 | 1.9%(+48.1)#15 |
| 16. | 25421 | 50.0% | 1.1%(+48.9)#1 | 1.9%(+48.1)#16 |
| 17. | 64765 | 50.0% | 1.6%(+48.4)#2 | 1.9%(+48.1)#17 |
| 18. | 25180 | 49.4% | 1.1%(+48.3)#2 | 1.9%(+47.5)#18 |
| 19. | 27915 | 44.7% | 1.9%(+42.8)#1 | 1.9%(+42.8)#19 |
| 20. | 97817 | 44.4% | 2.0%(+42.5)#1 | 1.9%(+42.6)#20 |
| 21. | 47366 | 44.4% | 1.4%(+43.0)#1 | 1.9%(+42.6)#21 |
| 22. | 77585 | 44.3% | 2.0%(+42.3)#1 | 1.9%(+42.4)#22 |
| 23. | 42131 | 43.3% | 1.4%(+42.0)#1 | 1.9%(+41.4)#23 |
| 24. | 22433 | 41.8% | 1.9%(+39.9)#2 | 1.9%(+39.9)#24 |
| 25. | 24168 | 41.4% | 1.9%(+39.5)#3 | 1.9%(+39.5)#25 |
| 26. | 29333 | 40.3% | 2.0%(+38.3)#1 | 1.9%(+38.4)#26 |
| 27. | 44503 | 40.1% | 1.5%(+38.7)#1 | 1.9%(+38.3)#27 |
| 28. | 72178 | 40.0% | 1.4%(+38.6)#1 | 1.9%(+38.1)#28 |
| 29. | 76930 | 39.6% | 2.0%(+37.6)#2 | 1.9%(+37.7)#29 |
| 30. | 72629 | 39.0% | 1.4%(+37.6)#2 | 1.9%(+37.1)#30 |
| 31. | 94576 | 38.9% | 2.1%(+36.8)#5 | 1.9%(+37.0)#31 |
| 32. | 93529 | 37.2% | 2.1%(+35.1)#6 | 1.9%(+35.3)#32 |
| 33. | 95601 | 36.5% | 2.1%(+34.3)#7 | 1.9%(+34.6)#33 |
| 34. | 45301 | 35.5% | 1.5%(+34.0)#2 | 1.9%(+33.6)#34 |
| 35. | 07979 | 33.7% | 1.9%(+31.8)#1 | 1.9%(+31.8)#35 |
| 36. | 78008 | 32.8% | 2.0%(+30.8)#3 | 1.9%(+30.9)#36 |
| 37. | 70725 | 32.6% | 1.6%(+31.0)#1 | 1.9%(+30.7)#37 |
| 38. | 75903 | 32.4% | 2.0%(+30.3)#4 | 1.9%(+30.5)#38 |
| 39. | 14112 | 31.7% | 2.2%(+29.5)#2 | 1.9%(+29.8)#39 |
| 40. | 96017 | 31.2% | 2.1%(+29.1)#8 | 1.9%(+29.4)#40 |
| 41. | 59928 | 31.0% | 1.8%(+29.2)#2 | 1.9%(+29.1)#41 |
| 42. | 05341 | 30.8% | 1.6%(+29.2)#1 | 1.9%(+28.9)#42 |
| 43. | 80532 | 30.6% | 2.4%(+28.2)#1 | 1.9%(+28.7)#43 |
| 44. | 34215 | 30.3% | 2.8%(+27.5)#1 | 1.9%(+28.4)#44 |
| 45. | 63956 | 29.7% | 1.6%(+28.0)#3 | 1.9%(+27.8)#45 |
| 46. | 24811 | 29.6% | 1.1%(+28.6)#3 | 1.9%(+27.7)#46 |
| 47. | 15430 | 29.2% | 1.5%(+27.7)#2 | 1.9%(+27.3)#47 |
| 48. | 74521 | 28.6% | 1.6%(+27.0)#1 | 1.9%(+26.7)#48 |
| 49. | 39885 | 28.6% | 2.0%(+26.6)#2 | 1.9%(+26.7)#49 |
| 50. | 64167 | 28.5% | 1.6%(+26.8)#4 | 1.9%(+26.6)#50 |
| 51. | 51648 | 28.4% | 1.1%(+27.3)#1 | 1.9%(+26.6)#51 |
| 52. | 94021 | 28.1% | 2.1%(+26.0)#9 | 1.9%(+26.2)#52 |
| 53. | 28708 | 28.0% | 1.9%(+26.2)#2 | 1.9%(+26.2)#53 |
| 54. | 75934 | 27.9% | 2.0%(+25.9)#5 | 1.9%(+26.0)#54 |
| 55. | 23076 | 27.8% | 1.9%(+25.9)#4 | 1.9%(+25.9)#55 |
| 56. | 32079 | 27.8% | 2.8%(+25.0)#2 | 1.9%(+25.9)#56 |
| 57. | 23070 | 27.5% | 1.9%(+25.6)#5 | 1.9%(+25.6)#57 |
| 58. | 12844 | 27.3% | 2.2%(+25.0)#3 | 1.9%(+25.4)#58 |
| 59. | 72537 | 27.2% | 1.4%(+25.8)#3 | 1.9%(+25.3)#59 |
| 60. | 71864 | 26.9% | 1.4%(+25.5)#4 | 1.9%(+25.0)#60 |
| 61. | 76873 | 26.7% | 2.0%(+24.7)#6 | 1.9%(+24.8)#61 |
| 62. | 28447 | 26.7% | 1.9%(+24.8)#3 | 1.9%(+24.8)#62 |
| 63. | 27960 | 26.4% | 1.9%(+24.6)#4 | 1.9%(+24.5)#63 |
| 64. | 02650 | 26.1% | 1.7%(+24.5)#1 | 1.9%(+24.3)#64 |
| 65. | 16220 | 25.8% | 1.5%(+24.3)#3 | 1.9%(+23.9)#65 |
| 66. | 08316 | 25.7% | 1.9%(+23.8)#2 | 1.9%(+23.8)#66 |
| 67. | 05150 | 25.7% | 1.6%(+24.1)#2 | 1.9%(+23.8)#67 |
| 68. | 42326 | 25.7% | 1.4%(+24.3)#2 | 1.9%(+23.8)#68 |
| 69. | 80436 | 25.6% | 2.4%(+23.2)#2 | 1.9%(+23.7)#69 |
| 70. | 59866 | 25.5% | 1.8%(+23.7)#3 | 1.9%(+23.6)#70 |
| 71. | 23480 | 25.3% | 1.9%(+23.4)#6 | 1.9%(+23.4)#71 |
| 72. | 88052 | 25.0% | 1.6%(+23.4)#2 | 1.9%(+23.1)#72 |
| 73. | 54561 | 25.0% | 1.2%(+23.8)#1 | 1.9%(+23.1)#73 |
| 74. | 94937 | 24.4% | 2.1%(+22.3)#10 | 1.9%(+22.5)#74 |
| 75. | 83322 | 24.1% | 2.0%(+22.1)#1 | 1.9%(+22.2)#75 |
| 76. | 80025 | 23.8% | 2.4%(+21.4)#3 | 1.9%(+21.9)#76 |
| 77. | 29469 | 23.8% | 2.0%(+21.8)#2 | 1.9%(+21.9)#77 |
| 78. | 83118 | 23.7% | 1.6%(+22.2)#1 | 1.9%(+21.9)#78 |
| 79. | 21653 | 23.5% | 2.1%(+21.4)#1 | 1.9%(+21.6)#79 |
| 80. | 17507 | 23.4% | 1.5%(+21.9)#4 | 1.9%(+21.5)#80 |
| 81. | 97145 | 23.3% | 2.0%(+21.3)#2 | 1.9%(+21.4)#81 |
| 82. | 06065 | 23.2% | 1.7%(+21.5)#1 | 1.9%(+21.3)#82 |
| 83. | 17506 | 23.1% | 1.5%(+21.6)#5 | 1.9%(+21.2)#83 |
| 84. | 10501 | 23.1% | 2.2%(+20.8)#4 | 1.9%(+21.2)#84 |
| 85. | 81253 | 23.0% | 2.4%(+20.6)#4 | 1.9%(+21.1)#85 |
| 86. | 08608 | 22.9% | 1.9%(+21.0)#3 | 1.9%(+21.0)#86 |
| 87. | 41203 | 22.9% | 1.4%(+21.5)#3 | 1.9%(+21.0)#87 |
| 88. | 63030 | 22.9% | 1.6%(+21.2)#5 | 1.9%(+21.0)#88 |
| 89. | 83312 | 22.4% | 2.0%(+20.4)#2 | 1.9%(+20.5)#89 |
| 90. | 21153 | 22.2% | 2.1%(+20.1)#2 | 1.9%(+20.3)#90 |
| 91. | 41189 | 22.0% | 1.4%(+20.6)#4 | 1.9%(+20.1)#91 |
| 92. | 80545 | 21.8% | 2.4%(+19.4)#5 | 1.9%(+19.9)#92 |
| 93. | 82934 | 21.7% | 1.6%(+20.2)#2 | 1.9%(+19.8)#93 |
| 94. | 43008 | 21.7% | 1.5%(+20.3)#3 | 1.9%(+19.8)#94 |
| 95. | 21540 | 21.4% | 2.1%(+19.3)#3 | 1.9%(+19.5)#95 |
| 96. | 62961 | 21.4% | 1.7%(+19.7)#1 | 1.9%(+19.5)#96 |
| 97. | 02725 | 21.3% | 1.7%(+19.6)#2 | 1.9%(+19.4)#97 |
| 98. | 71747 | 21.3% | 1.4%(+19.9)#5 | 1.9%(+19.4)#98 |
| 99. | 15773 | 21.2% | 1.5%(+19.7)#6 | 1.9%(+19.3)#99 |
| 100. | 49883 | 21.1% | 1.5%(+19.5)#2 | 1.9%(+19.2)#100 |
Common Questions
What are the Top 10 Zip Codes with the Highest Percentage of Population Employed in Real Estate, Rental & Leasing in the United States?
Top 10 Zip Codes with the Highest Percentage of Population Employed in Real Estate, Rental & Leasing in the United States are:
#1
100.0%
#2
100.0%
#3
100.0%
#4
100.0%
#5
100.0%
#6
100.0%
#7
66.7%
#8
61.5%
#9
54.5%
#10
53.8%
What zip code has the Highest Percentage of Population Employed in Real Estate, Rental & Leasing in the United States?
96068 has the Highest Percentage of Population Employed in Real Estate, Rental & Leasing in the United States with 100.0%.
What is the Percentage of Population Employed in Real Estate, Rental & Leasing in the United States?
Percentage of Population Employed in Real Estate, Rental & Leasing in the United States is 1.9%.