Zip Codes with the Highest Percentage of Population Employed in Food Preparation & Serving in Hawaii
RELATED REPORTS & OPTIONS
Food Preparation & Serving
Hawaii
Compare Zip Codes
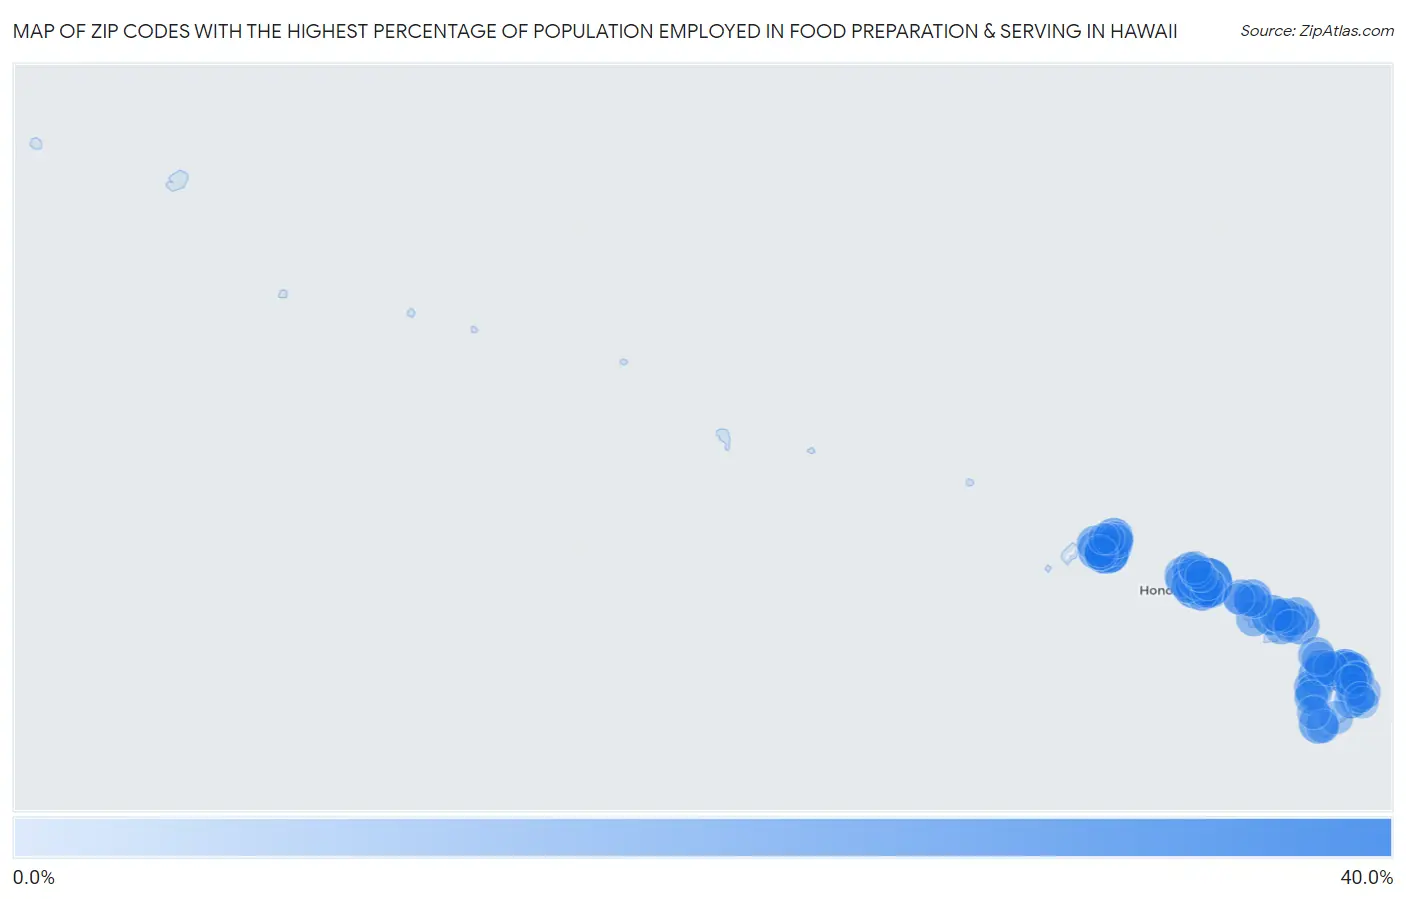
Map of Zip Codes with the Highest Percentage of Population Employed in Food Preparation & Serving in Hawaii
0.0%
40.0%
Zip Codes with the Highest Percentage of Population Employed in Food Preparation & Serving in Hawaii
| Zip Code | % Employed | vs State | vs National | |
| 1. | 96863 | 32.4% | 7.7%(+24.6)#1 | 5.3%(+27.1)#180 |
| 2. | 96774 | 23.8% | 7.7%(+16.1)#2 | 5.3%(+18.5)#352 |
| 3. | 96765 | 20.2% | 7.7%(+12.5)#3 | 5.3%(+14.9)#493 |
| 4. | 96860 | 20.0% | 7.7%(+12.3)#4 | 5.3%(+14.7)#500 |
| 5. | 96761 | 17.1% | 7.7%(+9.41)#5 | 5.3%(+11.8)#733 |
| 6. | 96737 | 15.7% | 7.7%(+7.94)#6 | 5.3%(+10.4)#898 |
| 7. | 96796 | 15.2% | 7.7%(+7.43)#7 | 5.3%(+9.87)#962 |
| 8. | 96705 | 15.0% | 7.7%(+7.31)#8 | 5.3%(+9.75)#979 |
| 9. | 96754 | 14.8% | 7.7%(+7.11)#9 | 5.3%(+9.55)#1,004 |
| 10. | 96713 | 14.2% | 7.7%(+6.46)#10 | 5.3%(+8.89)#1,126 |
| 11. | 96780 | 14.1% | 7.7%(+6.35)#11 | 5.3%(+8.79)#1,148 |
| 12. | 96742 | 13.9% | 7.7%(+6.17)#12 | 5.3%(+8.60)#1,189 |
| 13. | 96738 | 13.2% | 7.7%(+5.45)#13 | 5.3%(+7.88)#1,346 |
| 14. | 96708 | 12.6% | 7.7%(+4.91)#14 | 5.3%(+7.34)#1,486 |
| 15. | 96766 | 12.5% | 7.7%(+4.74)#15 | 5.3%(+7.17)#1,530 |
| 16. | 96756 | 12.3% | 7.7%(+4.57)#16 | 5.3%(+7.00)#1,569 |
| 17. | 96826 | 11.8% | 7.7%(+4.04)#17 | 5.3%(+6.48)#1,746 |
| 18. | 96740 | 11.3% | 7.7%(+3.61)#18 | 5.3%(+6.05)#1,904 |
| 19. | 96817 | 11.3% | 7.7%(+3.61)#19 | 5.3%(+6.04)#1,905 |
| 20. | 96819 | 11.1% | 7.7%(+3.41)#20 | 5.3%(+5.84)#1,991 |
| 21. | 96815 | 10.6% | 7.7%(+2.84)#21 | 5.3%(+5.27)#2,298 |
| 22. | 96725 | 10.2% | 7.7%(+2.48)#22 | 5.3%(+4.92)#2,483 |
| 23. | 96795 | 10.2% | 7.7%(+2.45)#23 | 5.3%(+4.88)#2,507 |
| 24. | 96776 | 10.1% | 7.7%(+2.34)#24 | 5.3%(+4.77)#2,589 |
| 25. | 96753 | 10.0% | 7.7%(+2.32)#25 | 5.3%(+4.76)#2,598 |
| 26. | 96719 | 9.8% | 7.7%(+2.10)#26 | 5.3%(+4.54)#2,778 |
| 27. | 96752 | 9.8% | 7.7%(+2.03)#27 | 5.3%(+4.46)#2,843 |
| 28. | 96791 | 9.6% | 7.7%(+1.87)#28 | 5.3%(+4.31)#2,980 |
| 29. | 96729 | 9.5% | 7.7%(+1.74)#29 | 5.3%(+4.17)#3,093 |
| 30. | 96764 | 9.4% | 7.7%(+1.67)#30 | 5.3%(+4.11)#3,148 |
| 31. | 96741 | 9.4% | 7.7%(+1.64)#31 | 5.3%(+4.08)#3,177 |
| 32. | 96816 | 9.1% | 7.7%(+1.35)#32 | 5.3%(+3.78)#3,458 |
| 33. | 96771 | 9.1% | 7.7%(+1.34)#33 | 5.3%(+3.77)#3,464 |
| 34. | 96743 | 9.0% | 7.7%(+1.32)#34 | 5.3%(+3.75)#3,484 |
| 35. | 96712 | 9.0% | 7.7%(+1.31)#35 | 5.3%(+3.74)#3,503 |
| 36. | 96786 | 8.4% | 7.7%(+0.714)#36 | 5.3%(+3.15)#4,130 |
| 37. | 96727 | 8.4% | 7.7%(+0.690)#37 | 5.3%(+3.12)#4,158 |
| 38. | 96763 | 8.4% | 7.7%(+0.677)#38 | 5.3%(+3.11)#4,176 |
| 39. | 96768 | 8.3% | 7.7%(+0.556)#39 | 5.3%(+2.99)#4,348 |
| 40. | 96703 | 8.0% | 7.7%(+0.283)#40 | 5.3%(+2.72)#4,720 |
| 41. | 96747 | 8.0% | 7.7%(+0.275)#41 | 5.3%(+2.71)#4,734 |
| 42. | 96818 | 7.5% | 7.7%(-0.194)#42 | 5.3%(+2.24)#5,504 |
| 43. | 96848 | 7.5% | 7.7%(-0.210)#43 | 5.3%(+2.22)#5,545 |
| 44. | 96857 | 7.3% | 7.7%(-0.391)#44 | 5.3%(+2.04)#5,879 |
| 45. | 96732 | 7.3% | 7.7%(-0.409)#45 | 5.3%(+2.03)#5,902 |
| 46. | 96797 | 7.1% | 7.7%(-0.631)#46 | 5.3%(+1.80)#6,365 |
| 47. | 96746 | 6.9% | 7.7%(-0.820)#47 | 5.3%(+1.61)#6,820 |
| 48. | 96755 | 6.8% | 7.7%(-0.874)#48 | 5.3%(+1.56)#6,946 |
| 49. | 96792 | 6.7% | 7.7%(-1.06)#49 | 5.3%(+1.38)#7,445 |
| 50. | 96785 | 6.6% | 7.7%(-1.07)#50 | 5.3%(+1.36)#7,482 |
| 51. | 96813 | 6.5% | 7.7%(-1.17)#51 | 5.3%(+1.26)#7,740 |
| 52. | 96749 | 6.5% | 7.7%(-1.26)#52 | 5.3%(+1.17)#7,982 |
| 53. | 96706 | 6.4% | 7.7%(-1.32)#53 | 5.3%(+1.12)#8,141 |
| 54. | 96814 | 6.2% | 7.7%(-1.49)#54 | 5.3%(+0.949)#8,628 |
| 55. | 96750 | 6.0% | 7.7%(-1.68)#55 | 5.3%(+0.753)#9,210 |
| 56. | 96779 | 6.0% | 7.7%(-1.68)#56 | 5.3%(+0.753)#9,211 |
| 57. | 96789 | 6.0% | 7.7%(-1.69)#57 | 5.3%(+0.740)#9,253 |
| 58. | 96720 | 6.0% | 7.7%(-1.71)#58 | 5.3%(+0.727)#9,302 |
| 59. | 96822 | 5.9% | 7.7%(-1.83)#59 | 5.3%(+0.601)#9,730 |
| 60. | 96782 | 5.8% | 7.7%(-1.91)#60 | 5.3%(+0.520)#10,019 |
| 61. | 96777 | 5.5% | 7.7%(-2.26)#61 | 5.3%(+0.178)#11,170 |
| 62. | 96716 | 5.4% | 7.7%(-2.28)#62 | 5.3%(+0.153)#11,269 |
| 63. | 96783 | 5.4% | 7.7%(-2.34)#63 | 5.3%(+0.093)#11,475 |
| 64. | 96744 | 5.4% | 7.7%(-2.35)#64 | 5.3%(+0.086)#11,501 |
| 65. | 96701 | 5.4% | 7.7%(-2.36)#65 | 5.3%(+0.077)#11,525 |
| 66. | 96793 | 5.4% | 7.7%(-2.36)#66 | 5.3%(+0.073)#11,542 |
| 67. | 96772 | 5.4% | 7.7%(-2.36)#67 | 5.3%(+0.073)#11,544 |
| 68. | 96825 | 5.3% | 7.7%(-2.40)#68 | 5.3%(+0.037)#11,679 |
| 69. | 96707 | 5.3% | 7.7%(-2.45)#69 | 5.3%(-0.012)#11,861 |
| 70. | 96748 | 5.3% | 7.7%(-2.46)#70 | 5.3%(-0.026)#11,925 |
| 71. | 96704 | 5.2% | 7.7%(-2.54)#71 | 5.3%(-0.109)#12,252 |
| 72. | 96821 | 5.1% | 7.7%(-2.61)#72 | 5.3%(-0.175)#12,502 |
| 73. | 96717 | 4.9% | 7.7%(-2.82)#73 | 5.3%(-0.388)#13,354 |
| 74. | 96757 | 4.8% | 7.7%(-2.94)#74 | 5.3%(-0.508)#13,828 |
| 75. | 96734 | 4.7% | 7.7%(-3.04)#75 | 5.3%(-0.606)#14,242 |
| 76. | 96762 | 4.6% | 7.7%(-3.09)#76 | 5.3%(-0.659)#14,463 |
| 77. | 96728 | 4.3% | 7.7%(-3.41)#77 | 5.3%(-0.980)#15,868 |
| 78. | 96790 | 4.2% | 7.7%(-3.49)#78 | 5.3%(-1.06)#16,186 |
| 79. | 96781 | 4.1% | 7.7%(-3.62)#79 | 5.3%(-1.19)#16,721 |
| 80. | 96731 | 3.9% | 7.7%(-3.82)#80 | 5.3%(-1.39)#17,541 |
| 81. | 96769 | 3.1% | 7.7%(-4.64)#81 | 5.3%(-2.21)#20,961 |
| 82. | 96778 | 2.6% | 7.7%(-5.16)#82 | 5.3%(-2.73)#22,950 |
| 83. | 96722 | 2.5% | 7.7%(-5.21)#83 | 5.3%(-2.78)#23,127 |
| 84. | 96730 | 2.4% | 7.7%(-5.34)#84 | 5.3%(-2.91)#23,522 |
| 85. | 96714 | 2.0% | 7.7%(-5.71)#85 | 5.3%(-3.28)#24,676 |
| 86. | 96770 | 1.9% | 7.7%(-5.87)#86 | 5.3%(-3.43)#25,137 |
| 87. | 96760 | 1.1% | 7.7%(-6.62)#87 | 5.3%(-4.19)#26,806 |
1
Common Questions
What are the Top 10 Zip Codes with the Highest Percentage of Population Employed in Food Preparation & Serving in Hawaii?
Top 10 Zip Codes with the Highest Percentage of Population Employed in Food Preparation & Serving in Hawaii are:
What zip code has the Highest Percentage of Population Employed in Food Preparation & Serving in Hawaii?
96863 has the Highest Percentage of Population Employed in Food Preparation & Serving in Hawaii with 32.4%.
What is the Percentage of Population Employed in Food Preparation & Serving in the State of Hawaii?
Percentage of Population Employed in Food Preparation & Serving in Hawaii is 7.7%.
What is the Percentage of Population Employed in Food Preparation & Serving in the United States?
Percentage of Population Employed in Food Preparation & Serving in the United States is 5.3%.