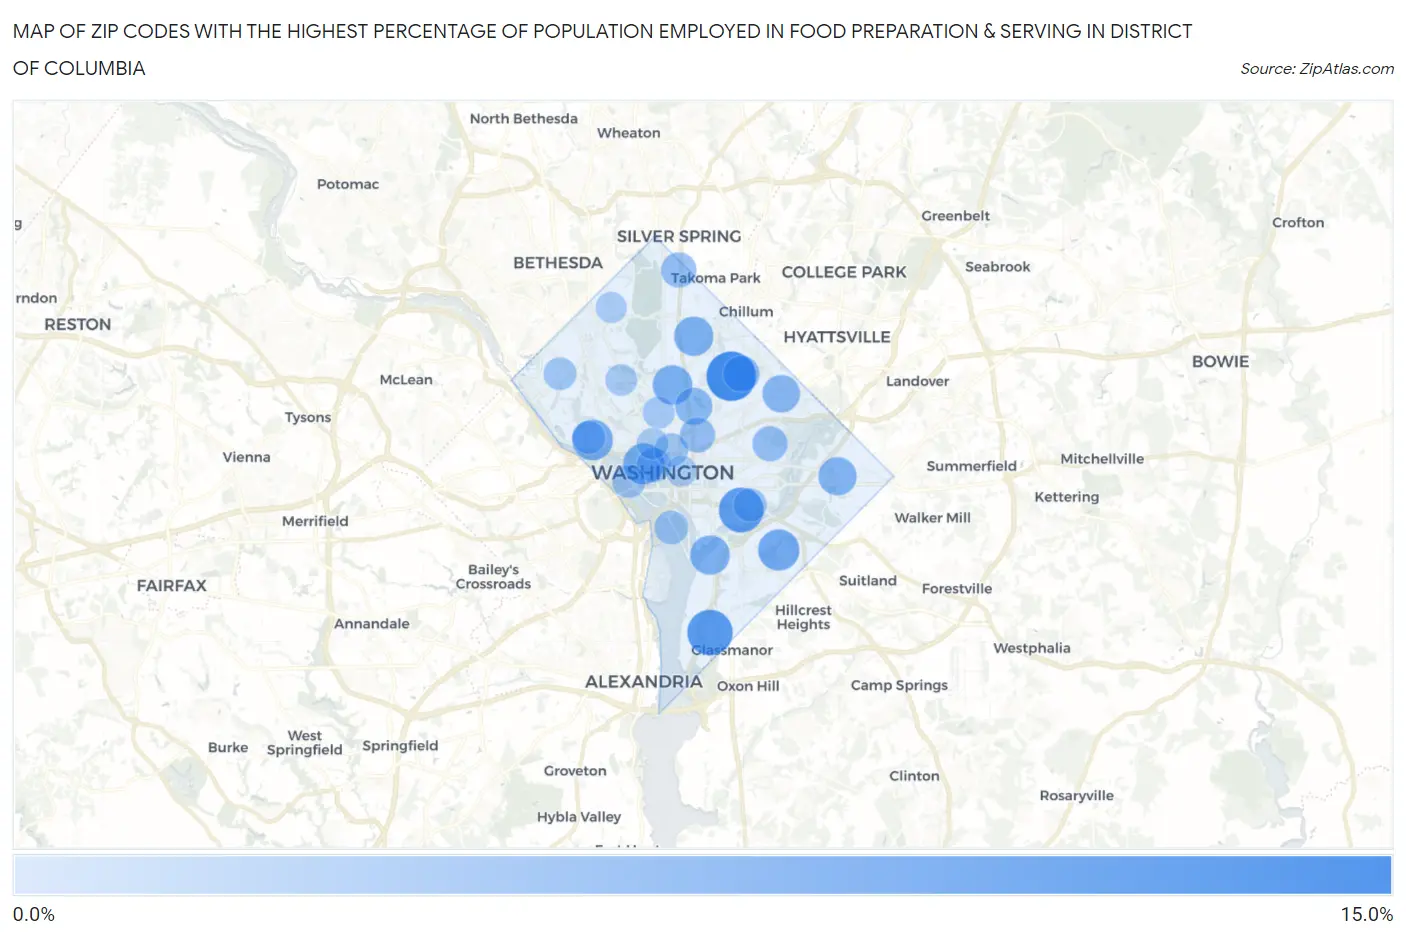
Zip Codes with the Highest Percentage of Population Employed in Food Preparation & Serving in District Of Columbia
RELATED REPORTS & OPTIONS
Food Preparation & Serving
District Of Columbia
Compare Zip Codes
Map of Zip Codes with the Highest Percentage of Population Employed in Food Preparation & Serving in District Of Columbia
0.0%
15.0%

Zip Codes with the Highest Percentage of Population Employed in Food Preparation & Serving in District Of Columbia
| Zip Code | % Employed | vs State | vs National | |
| 1. | 20064 | 13.5% | 3.8%(+9.69)#1 | 5.3%(+8.24)#1,268 |
| 2. | 20032 | 10.5% | 3.8%(+6.71)#2 | 5.3%(+5.26)#2,304 |
| 3. | 20390 | 10.1% | 3.8%(+6.25)#3 | 5.3%(+4.80)#2,571 |
| 4. | 20020 | 7.6% | 3.8%(+3.78)#4 | 5.3%(+2.33)#5,360 |
| 5. | 20052 | 7.5% | 3.8%(+3.64)#5 | 5.3%(+2.19)#5,596 |
| 6. | 20057 | 7.2% | 3.8%(+3.39)#6 | 5.3%(+1.94)#6,073 |
| 7. | 20010 | 6.5% | 3.8%(+2.65)#7 | 5.3%(+1.20)#7,914 |
| 8. | 20373 | 6.3% | 3.8%(+2.51)#8 | 5.3%(+1.06)#8,288 |
| 9. | 20011 | 6.2% | 3.8%(+2.35)#9 | 5.3%(+0.900)#8,779 |
| 10. | 20019 | 5.4% | 3.8%(+1.58)#10 | 5.3%(+0.125)#11,371 |
| 11. | 20018 | 5.0% | 3.8%(+1.14)#11 | 5.3%(-0.307)#13,033 |
| 12. | 20059 | 4.7% | 3.8%(+0.860)#12 | 5.3%(-0.591)#14,176 |
| 13. | 20017 | 4.1% | 3.8%(+0.290)#13 | 5.3%(-1.16)#16,600 |
| 14. | 20012 | 3.4% | 3.8%(-0.405)#14 | 5.3%(-1.86)#19,485 |
| 15. | 20002 | 3.3% | 3.8%(-0.489)#15 | 5.3%(-1.94)#19,846 |
| 16. | 20001 | 3.3% | 3.8%(-0.491)#16 | 5.3%(-1.94)#19,862 |
| 17. | 20006 | 2.9% | 3.8%(-0.936)#17 | 5.3%(-2.39)#21,663 |
| 18. | 20024 | 2.3% | 3.8%(-1.54)#18 | 5.3%(-2.99)#23,796 |
| 19. | 20005 | 2.3% | 3.8%(-1.58)#19 | 5.3%(-3.03)#23,924 |
| 20. | 20003 | 2.1% | 3.8%(-1.75)#20 | 5.3%(-3.21)#24,454 |
| 21. | 20037 | 2.0% | 3.8%(-1.86)#21 | 5.3%(-3.31)#24,789 |
| 22. | 20007 | 1.9% | 3.8%(-1.89)#22 | 5.3%(-3.34)#24,848 |
| 23. | 20016 | 1.7% | 3.8%(-2.10)#23 | 5.3%(-3.56)#25,453 |
| 24. | 20009 | 1.2% | 3.8%(-2.66)#24 | 5.3%(-4.11)#26,652 |
| 25. | 20008 | 0.95% | 3.8%(-2.88)#25 | 5.3%(-4.34)#27,057 |
| 26. | 20036 | 0.89% | 3.8%(-2.94)#26 | 5.3%(-4.40)#27,171 |
| 27. | 20015 | 0.52% | 3.8%(-3.31)#27 | 5.3%(-4.76)#27,660 |
| 28. | 20004 | 0.49% | 3.8%(-3.34)#28 | 5.3%(-4.79)#27,698 |
1
Common Questions
What are the Top 10 Zip Codes with the Highest Percentage of Population Employed in Food Preparation & Serving in District Of Columbia?
Top 10 Zip Codes with the Highest Percentage of Population Employed in Food Preparation & Serving in District Of Columbia are:
What zip code has the Highest Percentage of Population Employed in Food Preparation & Serving in District Of Columbia?
20064 has the Highest Percentage of Population Employed in Food Preparation & Serving in District Of Columbia with 13.5%.
What is the Percentage of Population Employed in Food Preparation & Serving in the State of District Of Columbia?
Percentage of Population Employed in Food Preparation & Serving in District Of Columbia is 3.8%.
What is the Percentage of Population Employed in Food Preparation & Serving in the United States?
Percentage of Population Employed in Food Preparation & Serving in the United States is 5.3%.