Zip Codes with the Highest Percentage of Black / African American Population in the United States
RELATED REPORTS & OPTIONS
Black / African American
United States
Compare Zip Codes
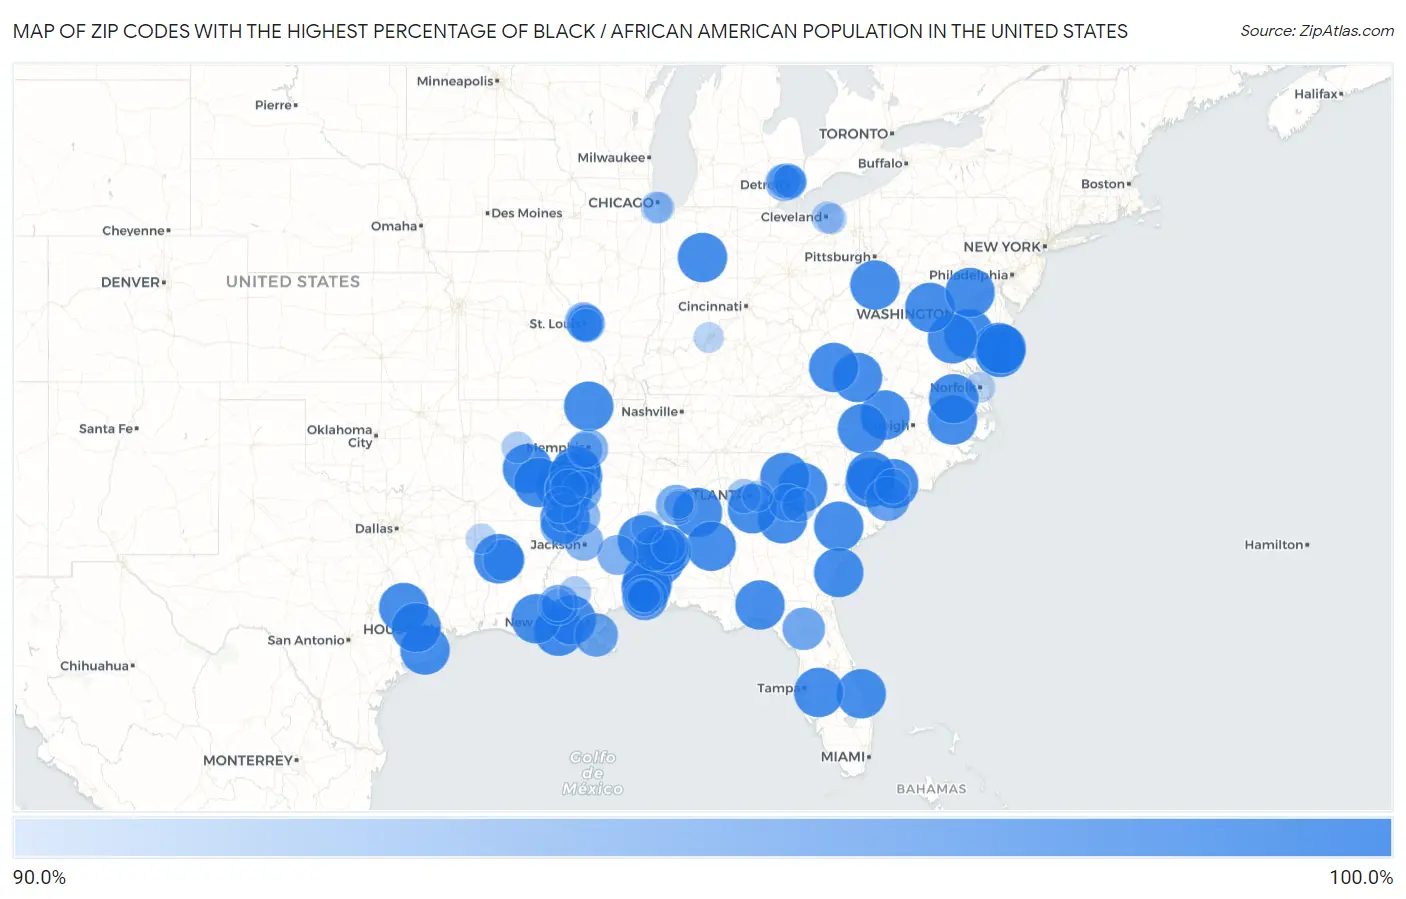
Map of Zip Codes with the Highest Percentage of Black / African American Population in the United States
90.0%
100.0%
Zip Codes with the Highest Percentage of Black / African American Population in the United States
| Zip Code | Black / African American | vs State | vs National | |
| 1. | 38639 | 100.0% | 37.2%(+62.8)#1 | 12.5%(+87.5)#1 |
| 2. | 36751 | 100.0% | 26.4%(+73.6)#1 | 12.5%(+87.5)#2 |
| 3. | 29840 | 100.0% | 25.8%(+74.2)#1 | 12.5%(+87.5)#3 |
| 4. | 77863 | 100.0% | 12.1%(+87.9)#1 | 12.5%(+87.5)#4 |
| 5. | 77431 | 100.0% | 12.1%(+87.9)#2 | 12.5%(+87.5)#5 |
| 6. | 32970 | 100.0% | 15.5%(+84.5)#1 | 12.5%(+87.5)#6 |
| 7. | 20656 | 100.0% | 29.9%(+70.1)#1 | 12.5%(+87.5)#7 |
| 8. | 29923 | 100.0% | 25.8%(+74.2)#2 | 12.5%(+87.5)#8 |
| 9. | 23488 | 100.0% | 18.9%(+81.1)#1 | 12.5%(+87.5)#9 |
| 10. | 70340 | 100.0% | 31.6%(+68.4)#1 | 12.5%(+87.5)#10 |
| 11. | 22538 | 100.0% | 18.9%(+81.1)#2 | 12.5%(+87.5)#11 |
| 12. | 27342 | 100.0% | 20.9%(+79.1)#1 | 12.5%(+87.5)#12 |
| 13. | 31034 | 100.0% | 31.5%(+68.5)#1 | 12.5%(+87.5)#13 |
| 14. | 72180 | 100.0% | 15.1%(+84.9)#1 | 12.5%(+87.5)#14 |
| 15. | 24129 | 100.0% | 18.9%(+81.1)#3 | 12.5%(+87.5)#15 |
| 16. | 70076 | 100.0% | 31.6%(+68.4)#2 | 12.5%(+87.5)#16 |
| 17. | 29046 | 100.0% | 25.8%(+74.2)#3 | 12.5%(+87.5)#17 |
| 18. | 23414 | 100.0% | 18.9%(+81.1)#4 | 12.5%(+87.5)#18 |
| 19. | 32337 | 100.0% | 15.5%(+84.5)#2 | 12.5%(+87.5)#19 |
| 20. | 35149 | 100.0% | 26.4%(+73.6)#2 | 12.5%(+87.5)#20 |
| 21. | 38644 | 100.0% | 37.2%(+62.8)#2 | 12.5%(+87.5)#21 |
| 22. | 38765 | 100.0% | 37.2%(+62.8)#3 | 12.5%(+87.5)#22 |
| 23. | 24855 | 100.0% | 3.4%(+96.6)#1 | 12.5%(+87.5)#23 |
| 24. | 29589 | 100.0% | 25.8%(+74.2)#4 | 12.5%(+87.5)#24 |
| 25. | 33835 | 100.0% | 15.5%(+84.5)#3 | 12.5%(+87.5)#25 |
| 26. | 36901 | 100.0% | 26.4%(+73.6)#3 | 12.5%(+87.5)#26 |
| 27. | 23416 | 100.0% | 18.9%(+81.1)#5 | 12.5%(+87.5)#27 |
| 28. | 26543 | 100.0% | 3.4%(+96.6)#2 | 12.5%(+87.5)#28 |
| 29. | 36556 | 100.0% | 26.4%(+73.6)#4 | 12.5%(+87.5)#29 |
| 30. | 70519 | 100.0% | 31.6%(+68.4)#3 | 12.5%(+87.5)#30 |
| 31. | 22646 | 100.0% | 18.9%(+81.1)#6 | 12.5%(+87.5)#31 |
| 32. | 30639 | 100.0% | 31.5%(+68.5)#2 | 12.5%(+87.5)#32 |
| 33. | 27841 | 100.0% | 20.9%(+79.1)#2 | 12.5%(+87.5)#34 |
| 34. | 31327 | 100.0% | 31.5%(+68.5)#3 | 12.5%(+87.5)#35 |
| 35. | 21031 | 100.0% | 29.9%(+70.1)#2 | 12.5%(+87.5)#36 |
| 36. | 63880 | 100.0% | 11.3%(+88.7)#1 | 12.5%(+87.5)#37 |
| 37. | 77473 | 100.0% | 12.1%(+87.9)#3 | 12.5%(+87.5)#38 |
| 38. | 36031 | 100.0% | 26.4%(+73.6)#5 | 12.5%(+87.5)#39 |
| 39. | 28039 | 100.0% | 20.9%(+79.1)#3 | 12.5%(+87.5)#40 |
| 40. | 36512 | 100.0% | 26.4%(+73.6)#6 | 12.5%(+87.5)#41 |
| 41. | 71066 | 100.0% | 31.6%(+68.4)#4 | 12.5%(+87.5)#42 |
| 42. | 46937 | 100.0% | 9.4%(+90.6)#1 | 12.5%(+87.5)#43 |
| 43. | 29079 | 100.0% | 25.8%(+74.2)#5 | 12.5%(+87.5)#44 |
| 44. | 72379 | 100.0% | 15.1%(+84.9)#2 | 12.5%(+87.5)#45 |
| 45. | 27877 | 100.0% | 20.9%(+79.1)#4 | 12.5%(+87.5)#46 |
| 46. | 71659 | 100.0% | 15.1%(+84.9)#3 | 12.5%(+87.5)#47 |
| 47. | 30284 | 100.0% | 31.5%(+68.5)#4 | 12.5%(+87.5)#48 |
| 48. | 38762 | 99.5% | 37.2%(+62.2)#4 | 12.5%(+87.0)#49 |
| 49. | 36723 | 99.3% | 26.4%(+73.0)#7 | 12.5%(+86.9)#50 |
| 50. | 38781 | 99.3% | 37.2%(+62.0)#5 | 12.5%(+86.8)#51 |
| 51. | 36720 | 99.2% | 26.4%(+72.8)#8 | 12.5%(+86.7)#52 |
| 52. | 38631 | 98.9% | 37.2%(+61.7)#6 | 12.5%(+86.4)#53 |
| 53. | 36610 | 98.6% | 26.4%(+72.2)#9 | 12.5%(+86.1)#54 |
| 54. | 36754 | 98.2% | 26.4%(+71.9)#10 | 12.5%(+85.8)#55 |
| 55. | 29580 | 98.1% | 25.8%(+72.4)#6 | 12.5%(+85.7)#56 |
| 56. | 70082 | 97.9% | 31.6%(+66.3)#5 | 12.5%(+85.4)#57 |
| 57. | 32616 | 97.6% | 15.5%(+82.1)#4 | 12.5%(+85.1)#58 |
| 58. | 71414 | 97.2% | 31.6%(+65.7)#6 | 12.5%(+84.8)#59 |
| 59. | 35061 | 96.9% | 26.4%(+70.5)#11 | 12.5%(+84.4)#60 |
| 60. | 38928 | 96.8% | 37.2%(+59.6)#7 | 12.5%(+84.4)#61 |
| 61. | 70812 | 96.8% | 31.6%(+65.3)#7 | 12.5%(+84.4)#62 |
| 62. | 39348 | 96.7% | 37.2%(+59.5)#8 | 12.5%(+84.2)#63 |
| 63. | 39213 | 96.3% | 37.2%(+59.1)#9 | 12.5%(+83.8)#64 |
| 64. | 39113 | 96.3% | 37.2%(+59.0)#10 | 12.5%(+83.8)#65 |
| 65. | 38106 | 96.2% | 16.3%(+80.0)#1 | 12.5%(+83.8)#66 |
| 66. | 38722 | 96.1% | 37.2%(+58.9)#11 | 12.5%(+83.6)#67 |
| 67. | 63115 | 95.9% | 11.3%(+84.7)#2 | 12.5%(+83.5)#68 |
| 68. | 36617 | 95.9% | 26.4%(+69.5)#12 | 12.5%(+83.5)#69 |
| 69. | 39169 | 95.9% | 37.2%(+58.7)#12 | 12.5%(+83.4)#70 |
| 70. | 62059 | 95.9% | 13.9%(+82.0)#1 | 12.5%(+83.4)#71 |
| 71. | 62205 | 95.9% | 13.9%(+82.0)#2 | 12.5%(+83.4)#72 |
| 72. | 30665 | 95.7% | 31.5%(+64.3)#5 | 12.5%(+83.3)#73 |
| 73. | 48227 | 95.7% | 13.6%(+82.2)#1 | 12.5%(+83.2)#74 |
| 74. | 38760 | 95.6% | 37.2%(+58.4)#13 | 12.5%(+83.2)#75 |
| 75. | 38774 | 95.5% | 37.2%(+58.3)#14 | 12.5%(+83.1)#76 |
| 76. | 48234 | 95.3% | 13.6%(+81.7)#2 | 12.5%(+82.8)#77 |
| 77. | 38109 | 95.2% | 16.3%(+78.9)#2 | 12.5%(+82.7)#78 |
| 78. | 29519 | 95.0% | 25.8%(+69.2)#7 | 12.5%(+82.5)#79 |
| 79. | 48213 | 94.9% | 13.6%(+81.3)#3 | 12.5%(+82.4)#80 |
| 80. | 30331 | 94.7% | 31.5%(+63.3)#6 | 12.5%(+82.3)#81 |
| 81. | 30807 | 94.7% | 31.5%(+63.2)#7 | 12.5%(+82.2)#82 |
| 82. | 36767 | 94.6% | 26.4%(+68.3)#13 | 12.5%(+82.2)#83 |
| 83. | 48235 | 94.5% | 13.6%(+80.9)#4 | 12.5%(+82.0)#84 |
| 84. | 48205 | 94.5% | 13.6%(+80.9)#5 | 12.5%(+82.0)#85 |
| 85. | 62207 | 94.3% | 13.9%(+80.4)#3 | 12.5%(+81.8)#86 |
| 86. | 70805 | 94.1% | 31.6%(+62.6)#8 | 12.5%(+81.7)#87 |
| 87. | 36612 | 94.1% | 26.4%(+67.7)#14 | 12.5%(+81.6)#88 |
| 88. | 70465 | 94.0% | 31.6%(+62.5)#9 | 12.5%(+81.6)#89 |
| 89. | 35443 | 94.0% | 26.4%(+67.7)#15 | 12.5%(+81.6)#90 |
| 90. | 44104 | 93.9% | 12.3%(+81.6)#1 | 12.5%(+81.5)#91 |
| 91. | 72107 | 93.9% | 15.1%(+78.7)#4 | 12.5%(+81.4)#92 |
| 92. | 60620 | 93.8% | 13.9%(+79.9)#4 | 12.5%(+81.3)#93 |
| 93. | 60619 | 93.7% | 13.9%(+79.7)#5 | 12.5%(+81.2)#94 |
| 94. | 30058 | 93.6% | 31.5%(+62.1)#8 | 12.5%(+81.1)#95 |
| 95. | 44128 | 93.5% | 12.3%(+81.2)#2 | 12.5%(+81.1)#96 |
| 96. | 35221 | 93.5% | 26.4%(+67.1)#16 | 12.5%(+81.0)#97 |
| 97. | 23523 | 93.4% | 18.9%(+74.5)#7 | 12.5%(+81.0)#98 |
| 98. | 71109 | 93.4% | 31.6%(+61.9)#10 | 12.5%(+81.0)#99 |
| 99. | 35208 | 93.4% | 26.4%(+67.0)#17 | 12.5%(+80.9)#100 |
| 100. | 40211 | 93.4% | 8.0%(+85.4)#1 | 12.5%(+80.9)#101 |
Common Questions
What are the Top 10 Zip Codes with the Highest Percentage of Black / African American Population in the United States?
Top 10 Zip Codes with the Highest Percentage of Black / African American Population in the United States are:
What zip code has the Highest Percentage of Black / African American Population in the United States?
38639 has the Highest Percentage of Black / African American Population in the United States with 100.0%.
What is the Percentage of Black / African American Population in the United States?
Percentage of Black / African American Population in the United States is 12.5%.