Zip Codes with the Highest Percentage of Population Employed in Food Preparation & Serving in New Hampshire
RELATED REPORTS & OPTIONS
Food Preparation & Serving
New Hampshire
Compare Zip Codes
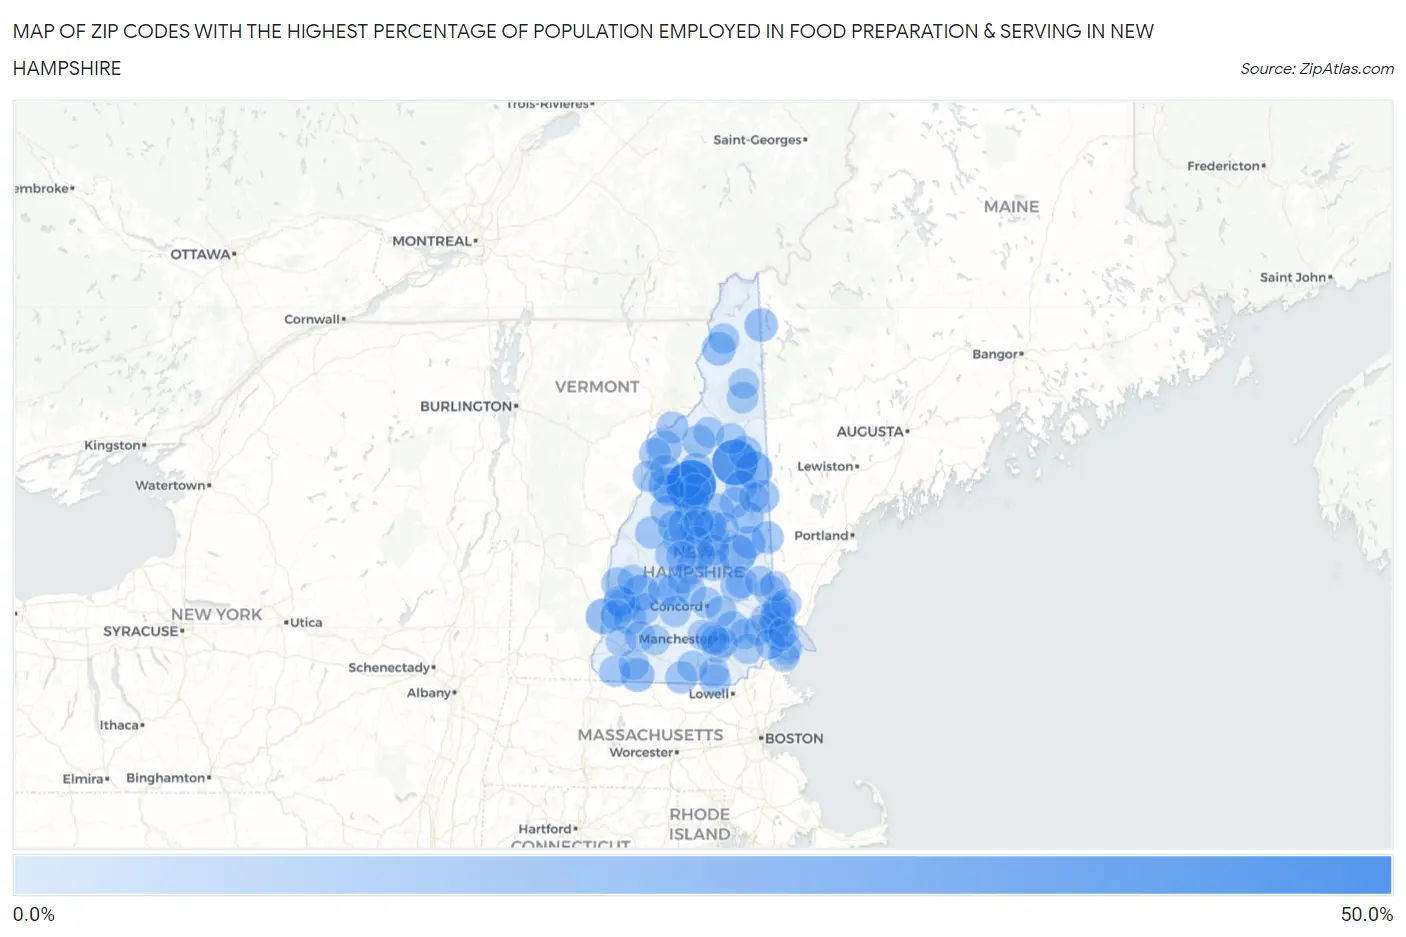
Map of Zip Codes with the Highest Percentage of Population Employed in Food Preparation & Serving in New Hampshire
0.0%
50.0%
Zip Codes with the Highest Percentage of Population Employed in Food Preparation & Serving in New Hampshire
| Zip Code | % Employed | vs State | vs National | |
| 1. | 03293 | 43.8% | 5.2%(+38.6)#1 | 5.3%(+38.5)#82 |
| 2. | 03812 | 35.9% | 5.2%(+30.7)#2 | 5.3%(+30.6)#139 |
| 3. | 03810 | 19.8% | 5.2%(+14.6)#3 | 5.3%(+14.5)#519 |
| 4. | 03847 | 19.2% | 5.2%(+14.0)#4 | 5.3%(+13.9)#552 |
| 5. | 03223 | 16.2% | 5.2%(+11.0)#5 | 5.3%(+10.9)#834 |
| 6. | 03609 | 16.1% | 5.2%(+10.9)#6 | 5.3%(+10.8)#844 |
| 7. | 03752 | 15.7% | 5.2%(+10.5)#7 | 5.3%(+10.4)#893 |
| 8. | 03264 | 15.7% | 5.2%(+10.5)#8 | 5.3%(+10.4)#895 |
| 9. | 03238 | 15.6% | 5.2%(+10.4)#9 | 5.3%(+10.3)#901 |
| 10. | 03262 | 14.0% | 5.2%(+8.80)#10 | 5.3%(+8.70)#1,163 |
| 11. | 03824 | 13.6% | 5.2%(+8.44)#11 | 5.3%(+8.34)#1,250 |
| 12. | 03585 | 12.1% | 5.2%(+6.90)#12 | 5.3%(+6.81)#1,630 |
| 13. | 03447 | 11.9% | 5.2%(+6.73)#13 | 5.3%(+6.63)#1,697 |
| 14. | 03832 | 11.9% | 5.2%(+6.73)#14 | 5.3%(+6.63)#1,699 |
| 15. | 03597 | 11.5% | 5.2%(+6.28)#15 | 5.3%(+6.18)#1,853 |
| 16. | 03579 | 11.4% | 5.2%(+6.22)#16 | 5.3%(+6.12)#1,874 |
| 17. | 03217 | 10.8% | 5.2%(+5.64)#17 | 5.3%(+5.55)#2,141 |
| 18. | 03846 | 10.6% | 5.2%(+5.43)#18 | 5.3%(+5.34)#2,247 |
| 19. | 03894 | 10.5% | 5.2%(+5.28)#19 | 5.3%(+5.18)#2,340 |
| 20. | 03607 | 10.2% | 5.2%(+5.03)#20 | 5.3%(+4.94)#2,466 |
| 21. | 03034 | 10.1% | 5.2%(+4.92)#21 | 5.3%(+4.83)#2,548 |
| 22. | 03574 | 10.0% | 5.2%(+4.82)#22 | 5.3%(+4.72)#2,622 |
| 23. | 03227 | 10.0% | 5.2%(+4.79)#23 | 5.3%(+4.70)#2,647 |
| 24. | 03253 | 10.0% | 5.2%(+4.79)#24 | 5.3%(+4.70)#2,648 |
| 25. | 03226 | 9.8% | 5.2%(+4.64)#25 | 5.3%(+4.55)#2,765 |
| 26. | 03814 | 9.7% | 5.2%(+4.51)#26 | 5.3%(+4.42)#2,878 |
| 27. | 03456 | 9.6% | 5.2%(+4.40)#27 | 5.3%(+4.30)#2,985 |
| 28. | 03743 | 9.6% | 5.2%(+4.39)#28 | 5.3%(+4.29)#2,995 |
| 29. | 03830 | 9.5% | 5.2%(+4.32)#29 | 5.3%(+4.23)#3,043 |
| 30. | 03561 | 9.1% | 5.2%(+3.93)#30 | 5.3%(+3.83)#3,394 |
| 31. | 03278 | 9.1% | 5.2%(+3.86)#31 | 5.3%(+3.77)#3,467 |
| 32. | 03220 | 9.0% | 5.2%(+3.80)#32 | 5.3%(+3.70)#3,541 |
| 33. | 03741 | 9.0% | 5.2%(+3.77)#33 | 5.3%(+3.67)#3,566 |
| 34. | 03251 | 9.0% | 5.2%(+3.76)#34 | 5.3%(+3.67)#3,567 |
| 35. | 03048 | 8.6% | 5.2%(+3.43)#35 | 5.3%(+3.33)#3,944 |
| 36. | 03230 | 8.6% | 5.2%(+3.41)#36 | 5.3%(+3.32)#3,960 |
| 37. | 03285 | 8.5% | 5.2%(+3.31)#37 | 5.3%(+3.22)#4,070 |
| 38. | 03256 | 8.5% | 5.2%(+3.30)#38 | 5.3%(+3.20)#4,082 |
| 39. | 03279 | 8.4% | 5.2%(+3.23)#39 | 5.3%(+3.13)#4,150 |
| 40. | 03266 | 8.4% | 5.2%(+3.20)#40 | 5.3%(+3.11)#4,178 |
| 41. | 03222 | 8.4% | 5.2%(+3.18)#41 | 5.3%(+3.08)#4,210 |
| 42. | 03740 | 8.3% | 5.2%(+3.09)#42 | 5.3%(+3.00)#4,337 |
| 43. | 03280 | 8.2% | 5.2%(+3.02)#43 | 5.3%(+2.93)#4,422 |
| 44. | 03235 | 8.2% | 5.2%(+2.96)#44 | 5.3%(+2.87)#4,500 |
| 45. | 03818 | 8.1% | 5.2%(+2.95)#45 | 5.3%(+2.85)#4,529 |
| 46. | 03842 | 8.1% | 5.2%(+2.91)#46 | 5.3%(+2.82)#4,564 |
| 47. | 03218 | 8.1% | 5.2%(+2.89)#47 | 5.3%(+2.79)#4,608 |
| 48. | 03241 | 8.1% | 5.2%(+2.88)#48 | 5.3%(+2.78)#4,631 |
| 49. | 03820 | 8.0% | 5.2%(+2.82)#49 | 5.3%(+2.73)#4,709 |
| 50. | 03060 | 8.0% | 5.2%(+2.76)#50 | 5.3%(+2.66)#4,805 |
| 51. | 03765 | 7.9% | 5.2%(+2.69)#51 | 5.3%(+2.60)#4,913 |
| 52. | 03225 | 7.7% | 5.2%(+2.48)#52 | 5.3%(+2.38)#5,262 |
| 53. | 03273 | 7.3% | 5.2%(+2.12)#53 | 5.3%(+2.03)#5,892 |
| 54. | 03570 | 7.2% | 5.2%(+2.03)#54 | 5.3%(+1.94)#6,086 |
| 55. | 03874 | 7.2% | 5.2%(+2.02)#55 | 5.3%(+1.93)#6,107 |
| 56. | 03886 | 7.2% | 5.2%(+2.00)#56 | 5.3%(+1.91)#6,153 |
| 57. | 03601 | 7.2% | 5.2%(+1.99)#57 | 5.3%(+1.90)#6,166 |
| 58. | 03102 | 7.1% | 5.2%(+1.95)#58 | 5.3%(+1.86)#6,236 |
| 59. | 03242 | 7.1% | 5.2%(+1.95)#59 | 5.3%(+1.85)#6,262 |
| 60. | 03867 | 7.0% | 5.2%(+1.84)#60 | 5.3%(+1.74)#6,484 |
| 61. | 03246 | 7.0% | 5.2%(+1.82)#61 | 5.3%(+1.72)#6,537 |
| 62. | 03857 | 7.0% | 5.2%(+1.80)#62 | 5.3%(+1.70)#6,587 |
| 63. | 03301 | 7.0% | 5.2%(+1.78)#63 | 5.3%(+1.68)#6,642 |
| 64. | 03470 | 7.0% | 5.2%(+1.76)#64 | 5.3%(+1.66)#6,682 |
| 65. | 03602 | 6.9% | 5.2%(+1.75)#65 | 5.3%(+1.65)#6,715 |
| 66. | 03103 | 6.9% | 5.2%(+1.72)#66 | 5.3%(+1.63)#6,775 |
| 67. | 03275 | 6.9% | 5.2%(+1.71)#67 | 5.3%(+1.62)#6,812 |
| 68. | 03885 | 6.9% | 5.2%(+1.67)#68 | 5.3%(+1.58)#6,898 |
| 69. | 03595 | 6.7% | 5.2%(+1.52)#69 | 5.3%(+1.43)#7,305 |
| 70. | 03055 | 6.6% | 5.2%(+1.39)#70 | 5.3%(+1.30)#7,645 |
| 71. | 03593 | 6.5% | 5.2%(+1.33)#71 | 5.3%(+1.24)#7,828 |
| 72. | 03576 | 6.4% | 5.2%(+1.18)#72 | 5.3%(+1.08)#8,222 |
| 73. | 03465 | 6.2% | 5.2%(+1.04)#73 | 5.3%(+0.951)#8,624 |
| 74. | 03269 | 6.2% | 5.2%(+0.989)#74 | 5.3%(+0.896)#8,793 |
| 75. | 03254 | 6.2% | 5.2%(+0.963)#75 | 5.3%(+0.870)#8,859 |
| 76. | 03785 | 6.1% | 5.2%(+0.911)#76 | 5.3%(+0.818)#9,007 |
| 77. | 03861 | 6.0% | 5.2%(+0.801)#77 | 5.3%(+0.707)#9,365 |
| 78. | 03588 | 6.0% | 5.2%(+0.795)#78 | 5.3%(+0.702)#9,381 |
| 79. | 03077 | 5.9% | 5.2%(+0.671)#79 | 5.3%(+0.578)#9,804 |
| 80. | 03823 | 5.9% | 5.2%(+0.667)#80 | 5.3%(+0.574)#9,821 |
| 81. | 03042 | 5.8% | 5.2%(+0.617)#81 | 5.3%(+0.524)#9,999 |
| 82. | 03431 | 5.8% | 5.2%(+0.598)#82 | 5.3%(+0.505)#10,060 |
| 83. | 03835 | 5.8% | 5.2%(+0.593)#83 | 5.3%(+0.499)#10,072 |
| 84. | 03457 | 5.7% | 5.2%(+0.463)#84 | 5.3%(+0.369)#10,502 |
| 85. | 03868 | 5.6% | 5.2%(+0.430)#85 | 5.3%(+0.337)#10,631 |
| 86. | 03109 | 5.5% | 5.2%(+0.325)#86 | 5.3%(+0.231)#11,010 |
| 87. | 03873 | 5.5% | 5.2%(+0.322)#87 | 5.3%(+0.229)#11,024 |
| 88. | 03833 | 5.4% | 5.2%(+0.249)#88 | 5.3%(+0.155)#11,260 |
| 89. | 03243 | 5.4% | 5.2%(+0.188)#89 | 5.3%(+0.094)#11,468 |
| 90. | 03840 | 5.4% | 5.2%(+0.162)#90 | 5.3%(+0.069)#11,563 |
| 91. | 03773 | 5.3% | 5.2%(+0.130)#91 | 5.3%(+0.036)#11,684 |
| 92. | 03449 | 5.2% | 5.2%(+0.031)#92 | 5.3%(-0.062)#12,051 |
| 93. | 03303 | 5.2% | 5.2%(-0.025)#93 | 5.3%(-0.118)#12,287 |
| 94. | 03268 | 5.1% | 5.2%(-0.075)#94 | 5.3%(-0.168)#12,474 |
| 95. | 03849 | 5.1% | 5.2%(-0.082)#95 | 5.3%(-0.176)#12,503 |
| 96. | 03064 | 5.0% | 5.2%(-0.159)#96 | 5.3%(-0.253)#12,818 |
| 97. | 03245 | 5.0% | 5.2%(-0.170)#97 | 5.3%(-0.264)#12,857 |
| 98. | 03869 | 5.0% | 5.2%(-0.178)#98 | 5.3%(-0.271)#12,890 |
| 99. | 03045 | 5.0% | 5.2%(-0.229)#99 | 5.3%(-0.322)#13,090 |
| 100. | 03101 | 4.9% | 5.2%(-0.245)#100 | 5.3%(-0.339)#13,158 |
Common Questions
What are the Top 10 Zip Codes with the Highest Percentage of Population Employed in Food Preparation & Serving in New Hampshire?
Top 10 Zip Codes with the Highest Percentage of Population Employed in Food Preparation & Serving in New Hampshire are:
What zip code has the Highest Percentage of Population Employed in Food Preparation & Serving in New Hampshire?
03293 has the Highest Percentage of Population Employed in Food Preparation & Serving in New Hampshire with 43.8%.
What is the Percentage of Population Employed in Food Preparation & Serving in the State of New Hampshire?
Percentage of Population Employed in Food Preparation & Serving in New Hampshire is 5.2%.
What is the Percentage of Population Employed in Food Preparation & Serving in the United States?
Percentage of Population Employed in Food Preparation & Serving in the United States is 5.3%.