Zip Codes with the Highest Percentage of Population Employed in Food Preparation & Serving in Iowa
RELATED REPORTS & OPTIONS
Food Preparation & Serving
Iowa
Compare Zip Codes
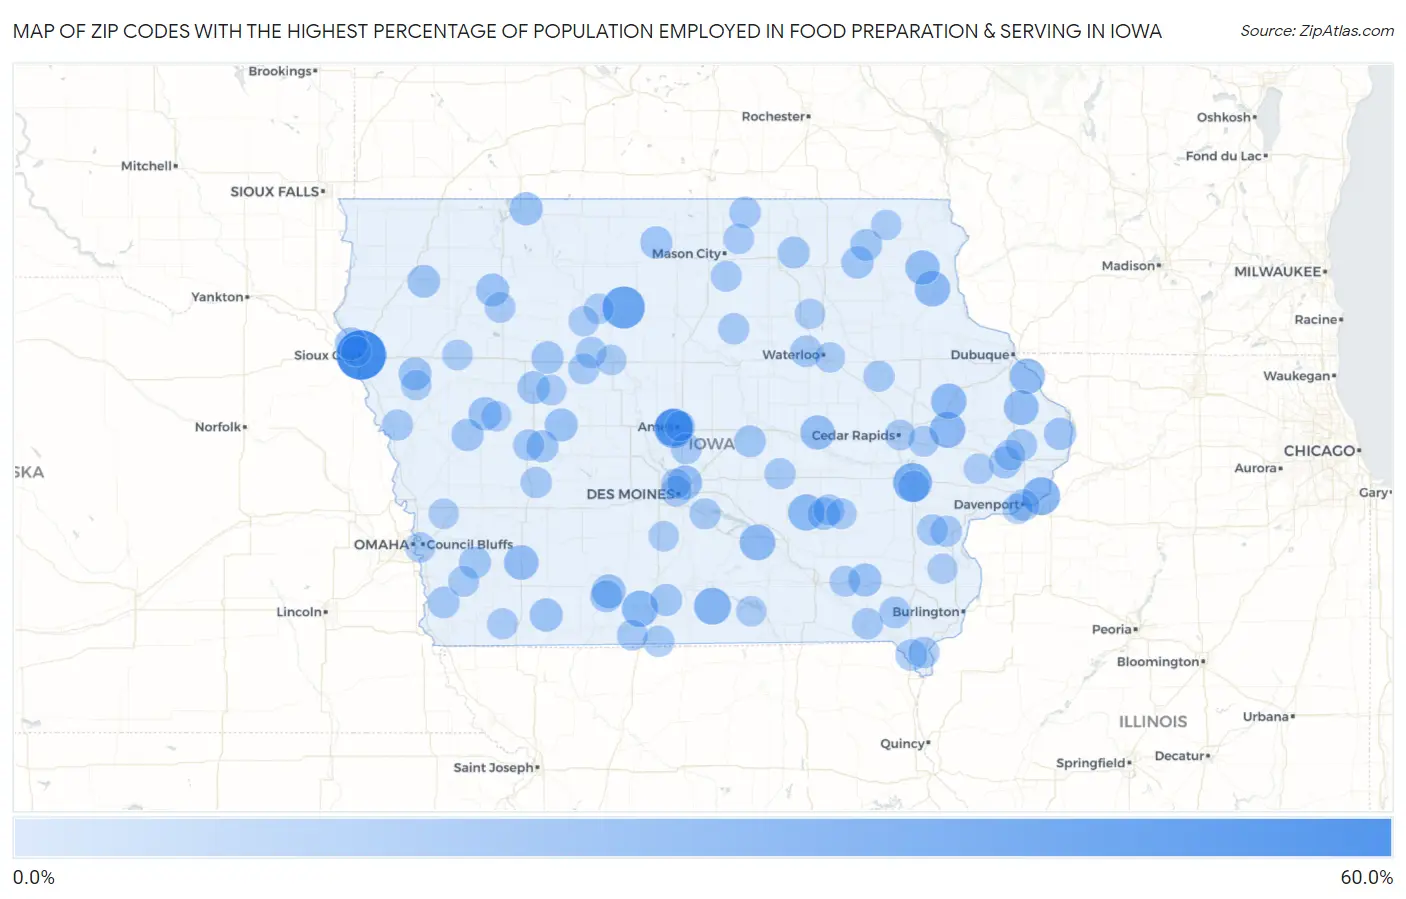
Map of Zip Codes with the Highest Percentage of Population Employed in Food Preparation & Serving in Iowa
0.0%
60.0%
Zip Codes with the Highest Percentage of Population Employed in Food Preparation & Serving in Iowa
| Zip Code | % Employed | vs State | vs National | |
| 1. | 51101 | 52.4% | 5.1%(+47.3)#1 | 5.3%(+47.1)#48 |
| 2. | 50545 | 34.9% | 5.1%(+29.8)#2 | 5.3%(+29.6)#150 |
| 3. | 52242 | 27.4% | 5.1%(+22.3)#3 | 5.3%(+22.1)#254 |
| 4. | 50013 | 27.0% | 5.1%(+21.9)#4 | 5.3%(+21.7)#263 |
| 5. | 50012 | 25.2% | 5.1%(+20.1)#5 | 5.3%(+19.9)#309 |
| 6. | 52767 | 24.6% | 5.1%(+19.5)#6 | 5.3%(+19.3)#324 |
| 7. | 50165 | 22.7% | 5.1%(+17.6)#7 | 5.3%(+17.4)#391 |
| 8. | 50108 | 21.3% | 5.1%(+16.2)#8 | 5.3%(+16.0)#445 |
| 9. | 50027 | 21.0% | 5.1%(+15.9)#9 | 5.3%(+15.7)#459 |
| 10. | 50256 | 20.2% | 5.1%(+15.1)#10 | 5.3%(+15.0)#489 |
| 11. | 52312 | 20.0% | 5.1%(+14.9)#11 | 5.3%(+14.7)#506 |
| 12. | 52072 | 19.5% | 5.1%(+14.4)#12 | 5.3%(+14.2)#532 |
| 13. | 52252 | 19.4% | 5.1%(+14.3)#13 | 5.3%(+14.1)#540 |
| 14. | 52071 | 18.9% | 5.1%(+13.8)#14 | 5.3%(+13.6)#573 |
| 15. | 52030 | 18.0% | 5.1%(+12.9)#15 | 5.3%(+12.7)#664 |
| 16. | 50847 | 17.4% | 5.1%(+12.3)#16 | 5.3%(+12.1)#715 |
| 17. | 52156 | 17.0% | 5.1%(+11.9)#17 | 5.3%(+11.8)#743 |
| 18. | 52348 | 16.7% | 5.1%(+11.6)#18 | 5.3%(+11.4)#783 |
| 19. | 50032 | 16.3% | 5.1%(+11.2)#19 | 5.3%(+11.0)#817 |
| 20. | 50831 | 15.4% | 5.1%(+10.3)#20 | 5.3%(+10.1)#934 |
| 21. | 51441 | 14.2% | 5.1%(+9.09)#21 | 5.3%(+8.92)#1,122 |
| 22. | 50848 | 14.1% | 5.1%(+9.00)#22 | 5.3%(+8.83)#1,140 |
| 23. | 51363 | 14.0% | 5.1%(+8.92)#23 | 5.3%(+8.75)#1,152 |
| 24. | 52557 | 14.0% | 5.1%(+8.90)#24 | 5.3%(+8.73)#1,156 |
| 25. | 51459 | 13.8% | 5.1%(+8.68)#25 | 5.3%(+8.51)#1,210 |
| 26. | 51033 | 13.7% | 5.1%(+8.57)#26 | 5.3%(+8.39)#1,237 |
| 27. | 51004 | 13.3% | 5.1%(+8.23)#27 | 5.3%(+8.06)#1,303 |
| 28. | 51022 | 13.3% | 5.1%(+8.15)#28 | 5.3%(+7.98)#1,325 |
| 29. | 51109 | 13.1% | 5.1%(+7.96)#29 | 5.3%(+7.78)#1,375 |
| 30. | 51433 | 13.0% | 5.1%(+7.89)#30 | 5.3%(+7.72)#1,392 |
| 31. | 50432 | 12.5% | 5.1%(+7.39)#31 | 5.3%(+7.21)#1,518 |
| 32. | 50255 | 12.5% | 5.1%(+7.39)#32 | 5.3%(+7.21)#1,524 |
| 33. | 50551 | 12.5% | 5.1%(+7.39)#33 | 5.3%(+7.21)#1,525 |
| 34. | 52171 | 12.3% | 5.1%(+7.23)#34 | 5.3%(+7.06)#1,556 |
| 35. | 51520 | 12.3% | 5.1%(+7.19)#35 | 5.3%(+7.02)#1,565 |
| 36. | 52701 | 12.2% | 5.1%(+7.08)#36 | 5.3%(+6.91)#1,598 |
| 37. | 50861 | 11.7% | 5.1%(+6.61)#37 | 5.3%(+6.44)#1,762 |
| 38. | 51440 | 11.5% | 5.1%(+6.37)#38 | 5.3%(+6.20)#1,847 |
| 39. | 50620 | 11.4% | 5.1%(+6.31)#39 | 5.3%(+6.14)#1,865 |
| 40. | 50264 | 11.4% | 5.1%(+6.25)#40 | 5.3%(+6.08)#1,890 |
| 41. | 51541 | 11.3% | 5.1%(+6.23)#41 | 5.3%(+6.05)#1,902 |
| 42. | 52168 | 11.3% | 5.1%(+6.20)#42 | 5.3%(+6.02)#1,915 |
| 43. | 52729 | 11.1% | 5.1%(+6.02)#43 | 5.3%(+5.85)#1,986 |
| 44. | 50120 | 11.1% | 5.1%(+6.00)#44 | 5.3%(+5.83)#1,998 |
| 45. | 52630 | 10.9% | 5.1%(+5.76)#45 | 5.3%(+5.58)#2,125 |
| 46. | 50613 | 10.9% | 5.1%(+5.74)#46 | 5.3%(+5.57)#2,135 |
| 47. | 51653 | 10.7% | 5.1%(+5.63)#47 | 5.3%(+5.46)#2,185 |
| 48. | 50426 | 10.7% | 5.1%(+5.60)#48 | 5.3%(+5.43)#2,203 |
| 49. | 52619 | 10.7% | 5.1%(+5.55)#49 | 5.3%(+5.38)#2,223 |
| 50. | 52774 | 10.7% | 5.1%(+5.55)#50 | 5.3%(+5.38)#2,224 |
| 51. | 52801 | 10.6% | 5.1%(+5.47)#51 | 5.3%(+5.30)#2,269 |
| 52. | 52240 | 10.3% | 5.1%(+5.23)#52 | 5.3%(+5.05)#2,401 |
| 53. | 52639 | 10.3% | 5.1%(+5.18)#53 | 5.3%(+5.00)#2,430 |
| 54. | 51463 | 10.1% | 5.1%(+5.02)#54 | 5.3%(+4.85)#2,535 |
| 55. | 50065 | 10.0% | 5.1%(+4.93)#55 | 5.3%(+4.75)#2,601 |
| 56. | 52565 | 10.0% | 5.1%(+4.90)#56 | 5.3%(+4.73)#2,619 |
| 57. | 52754 | 9.9% | 5.1%(+4.82)#57 | 5.3%(+4.65)#2,680 |
| 58. | 50117 | 9.9% | 5.1%(+4.78)#58 | 5.3%(+4.60)#2,718 |
| 59. | 50633 | 9.8% | 5.1%(+4.73)#59 | 5.3%(+4.56)#2,754 |
| 60. | 50518 | 9.7% | 5.1%(+4.58)#60 | 5.3%(+4.41)#2,887 |
| 61. | 52739 | 9.7% | 5.1%(+4.55)#61 | 5.3%(+4.38)#2,909 |
| 62. | 50112 | 9.6% | 5.1%(+4.53)#62 | 5.3%(+4.36)#2,933 |
| 63. | 50586 | 9.6% | 5.1%(+4.50)#63 | 5.3%(+4.33)#2,955 |
| 64. | 50140 | 9.6% | 5.1%(+4.49)#64 | 5.3%(+4.32)#2,965 |
| 65. | 51040 | 9.5% | 5.1%(+4.41)#65 | 5.3%(+4.24)#3,031 |
| 66. | 50118 | 9.5% | 5.1%(+4.39)#66 | 5.3%(+4.21)#3,052 |
| 67. | 50136 | 9.5% | 5.1%(+4.36)#67 | 5.3%(+4.19)#3,080 |
| 68. | 50469 | 9.4% | 5.1%(+4.27)#68 | 5.3%(+4.09)#3,156 |
| 69. | 52329 | 9.3% | 5.1%(+4.15)#69 | 5.3%(+3.97)#3,270 |
| 70. | 51540 | 9.2% | 5.1%(+4.08)#70 | 5.3%(+3.91)#3,328 |
| 71. | 51656 | 9.1% | 5.1%(+3.98)#71 | 5.3%(+3.80)#3,438 |
| 72. | 50046 | 9.0% | 5.1%(+3.92)#72 | 5.3%(+3.75)#3,492 |
| 73. | 52751 | 9.0% | 5.1%(+3.85)#73 | 5.3%(+3.68)#3,559 |
| 74. | 52355 | 9.0% | 5.1%(+3.84)#74 | 5.3%(+3.67)#3,568 |
| 75. | 52533 | 8.9% | 5.1%(+3.76)#75 | 5.3%(+3.59)#3,641 |
| 76. | 52314 | 8.9% | 5.1%(+3.74)#76 | 5.3%(+3.57)#3,658 |
| 77. | 50464 | 8.8% | 5.1%(+3.65)#77 | 5.3%(+3.48)#3,769 |
| 78. | 50314 | 8.7% | 5.1%(+3.60)#78 | 5.3%(+3.43)#3,824 |
| 79. | 50576 | 8.7% | 5.1%(+3.58)#79 | 5.3%(+3.41)#3,853 |
| 80. | 52401 | 8.5% | 5.1%(+3.41)#80 | 5.3%(+3.24)#4,042 |
| 81. | 51025 | 8.5% | 5.1%(+3.36)#81 | 5.3%(+3.19)#4,097 |
| 82. | 51044 | 8.3% | 5.1%(+3.22)#82 | 5.3%(+3.05)#4,268 |
| 83. | 52101 | 8.3% | 5.1%(+3.18)#83 | 5.3%(+3.00)#4,330 |
| 84. | 51449 | 8.2% | 5.1%(+3.08)#84 | 5.3%(+2.90)#4,451 |
| 85. | 50501 | 8.1% | 5.1%(+3.02)#85 | 5.3%(+2.85)#4,533 |
| 86. | 50241 | 8.1% | 5.1%(+2.99)#86 | 5.3%(+2.82)#4,562 |
| 87. | 52574 | 8.1% | 5.1%(+2.95)#87 | 5.3%(+2.78)#4,637 |
| 88. | 50582 | 8.0% | 5.1%(+2.92)#88 | 5.3%(+2.75)#4,679 |
| 89. | 51501 | 8.0% | 5.1%(+2.91)#89 | 5.3%(+2.74)#4,694 |
| 90. | 52802 | 8.0% | 5.1%(+2.90)#90 | 5.3%(+2.73)#4,706 |
| 91. | 52721 | 8.0% | 5.1%(+2.87)#91 | 5.3%(+2.70)#4,749 |
| 92. | 51559 | 8.0% | 5.1%(+2.86)#92 | 5.3%(+2.69)#4,760 |
| 93. | 51103 | 7.9% | 5.1%(+2.83)#93 | 5.3%(+2.65)#4,828 |
| 94. | 50313 | 7.9% | 5.1%(+2.80)#94 | 5.3%(+2.63)#4,867 |
| 95. | 50541 | 7.9% | 5.1%(+2.79)#95 | 5.3%(+2.61)#4,888 |
| 96. | 50707 | 7.9% | 5.1%(+2.77)#96 | 5.3%(+2.60)#4,915 |
| 97. | 52640 | 7.9% | 5.1%(+2.77)#97 | 5.3%(+2.59)#4,921 |
| 98. | 50010 | 7.8% | 5.1%(+2.72)#98 | 5.3%(+2.55)#4,983 |
| 99. | 50677 | 7.8% | 5.1%(+2.71)#99 | 5.3%(+2.53)#5,011 |
| 100. | 51465 | 7.8% | 5.1%(+2.70)#100 | 5.3%(+2.53)#5,022 |
Common Questions
What are the Top 10 Zip Codes with the Highest Percentage of Population Employed in Food Preparation & Serving in Iowa?
Top 10 Zip Codes with the Highest Percentage of Population Employed in Food Preparation & Serving in Iowa are:
What zip code has the Highest Percentage of Population Employed in Food Preparation & Serving in Iowa?
51101 has the Highest Percentage of Population Employed in Food Preparation & Serving in Iowa with 52.4%.
What is the Percentage of Population Employed in Food Preparation & Serving in the State of Iowa?
Percentage of Population Employed in Food Preparation & Serving in Iowa is 5.1%.
What is the Percentage of Population Employed in Food Preparation & Serving in the United States?
Percentage of Population Employed in Food Preparation & Serving in the United States is 5.3%.