Bristol, WI Map & Demographics
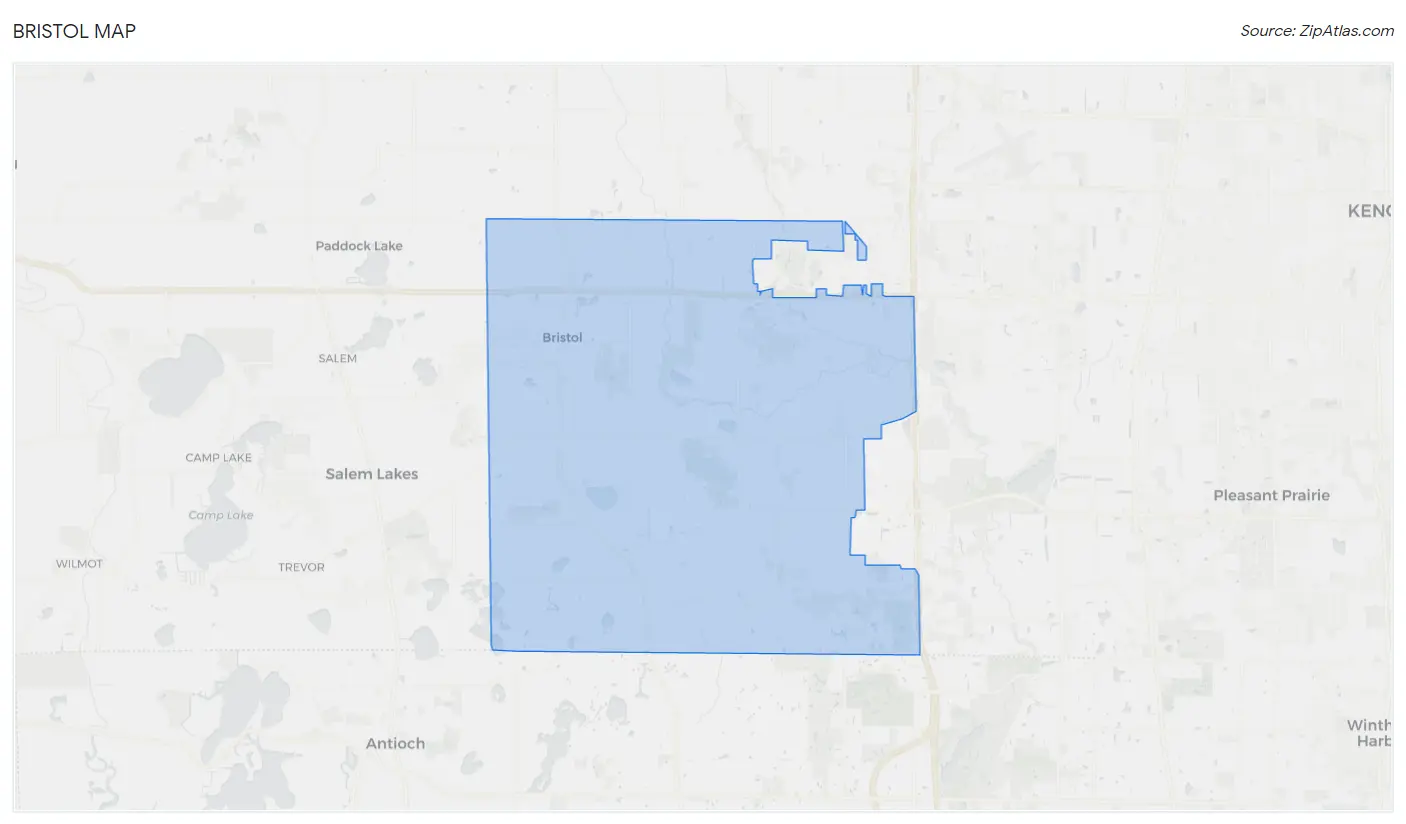
Bristol Map
Bristol Overview
$49,589
PER CAPITA INCOME
$135,855
AVG FAMILY INCOME
$103,652
AVG HOUSEHOLD INCOME
36.9%
WAGE / INCOME GAP [ % ]
63.1¢/ $1
WAGE / INCOME GAP [ $ ]
0.43
INEQUALITY / GINI INDEX
5,169
TOTAL POPULATION
2,952
MALE POPULATION
2,217
FEMALE POPULATION
133.15
MALES / 100 FEMALES
75.10
FEMALES / 100 MALES
45.8
MEDIAN AGE
3.0
AVG FAMILY SIZE
2.6
AVG HOUSEHOLD SIZE
2,959
LABOR FORCE [ PEOPLE ]
68.7%
PERCENT IN LABOR FORCE
7.9%
UNEMPLOYMENT RATE
Bristol Zip Codes
Bristol Area Codes
Income in Bristol
Income Overview in Bristol
Per Capita Income in Bristol is $49,589, while median incomes of families and households are $135,855 and $103,652 respectively.
| Characteristic | Number | Measure |
| Per Capita Income | 5,169 | $49,589 |
| Median Family Income | 1,522 | $135,855 |
| Mean Family Income | 1,522 | $142,429 |
| Median Household Income | 2,009 | $103,652 |
| Mean Household Income | 2,009 | $126,348 |
| Income Deficit | 1,522 | $0 |
| Wage / Income Gap (%) | 5,169 | 36.88% |
| Wage / Income Gap ($) | 5,169 | 63.12¢ per $1 |
| Gini / Inequality Index | 5,169 | 0.43 |
Earnings by Sex in Bristol
Average Earnings in Bristol are $44,279, $55,446 for men and $35,000 for women, a difference of 36.9%.
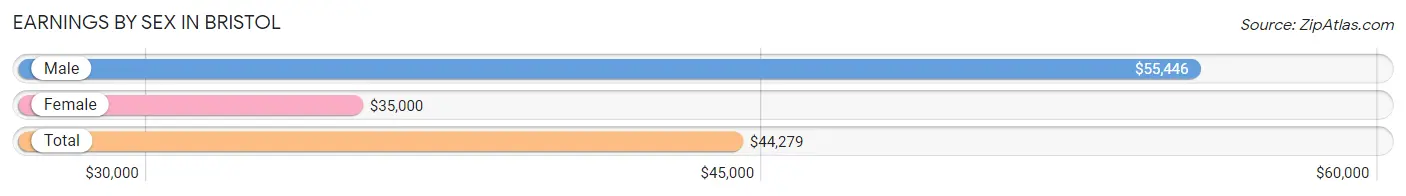
| Sex | Number | Average Earnings |
| Male | 1,713 (56.7%) | $55,446 |
| Female | 1,310 (43.3%) | $35,000 |
| Total | 3,023 (100.0%) | $44,279 |
Earnings by Sex by Income Bracket in Bristol
The most common earnings brackets in Bristol are $100,000+ for men (517 | 30.2%) and $2,500 to $4,999 for women (125 | 9.5%).
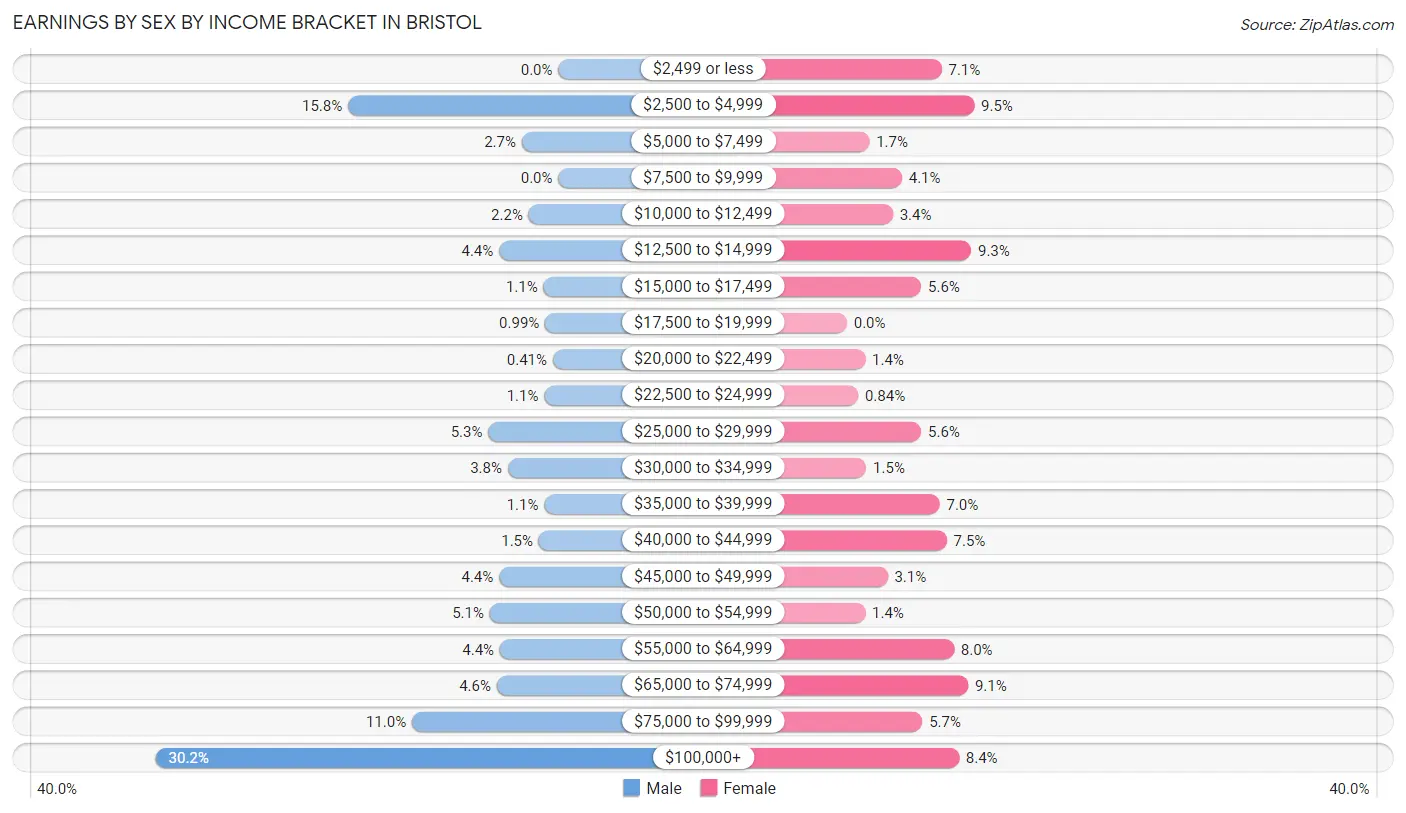
| Income | Male | Female |
| $2,499 or less | 0 (0.0%) | 93 (7.1%) |
| $2,500 to $4,999 | 270 (15.8%) | 125 (9.5%) |
| $5,000 to $7,499 | 47 (2.7%) | 22 (1.7%) |
| $7,500 to $9,999 | 0 (0.0%) | 54 (4.1%) |
| $10,000 to $12,499 | 38 (2.2%) | 45 (3.4%) |
| $12,500 to $14,999 | 76 (4.4%) | 122 (9.3%) |
| $15,000 to $17,499 | 19 (1.1%) | 73 (5.6%) |
| $17,500 to $19,999 | 17 (1.0%) | 0 (0.0%) |
| $20,000 to $22,499 | 7 (0.4%) | 18 (1.4%) |
| $22,500 to $24,999 | 18 (1.1%) | 11 (0.8%) |
| $25,000 to $29,999 | 90 (5.2%) | 73 (5.6%) |
| $30,000 to $34,999 | 65 (3.8%) | 19 (1.5%) |
| $35,000 to $39,999 | 18 (1.1%) | 91 (7.0%) |
| $40,000 to $44,999 | 25 (1.5%) | 98 (7.5%) |
| $45,000 to $49,999 | 76 (4.4%) | 40 (3.0%) |
| $50,000 to $54,999 | 88 (5.1%) | 18 (1.4%) |
| $55,000 to $64,999 | 75 (4.4%) | 105 (8.0%) |
| $65,000 to $74,999 | 79 (4.6%) | 119 (9.1%) |
| $75,000 to $99,999 | 188 (11.0%) | 74 (5.7%) |
| $100,000+ | 517 (30.2%) | 110 (8.4%) |
| Total | 1,713 (100.0%) | 1,310 (100.0%) |
Earnings by Sex by Educational Attainment in Bristol
Average earnings in Bristol are $79,798 for men and $37,418 for women, a difference of 53.1%. Men with an educational attainment of graduate degree enjoy the highest average annual earnings of $166,324, while those with college or associate's degree education earn the least with $61,583. Women with an educational attainment of bachelor's degree earn the most with the average annual earnings of $58,102, while those with graduate degree education have the smallest earnings of $36,083.
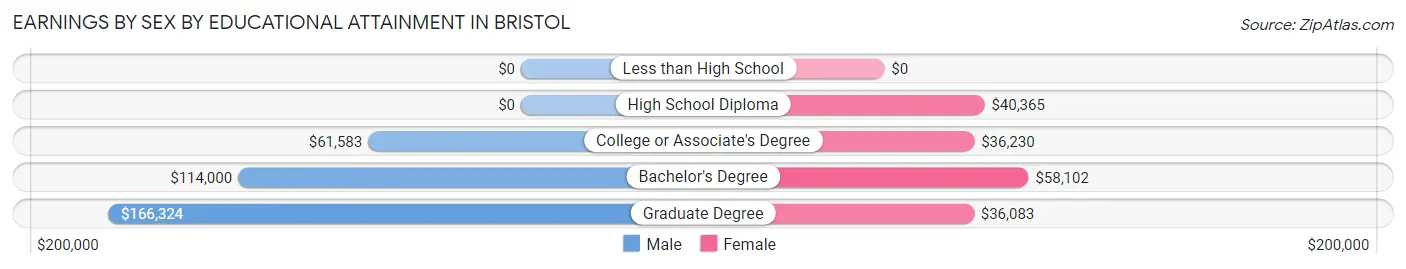
| Educational Attainment | Male Income | Female Income |
| Less than High School | - | - |
| High School Diploma | - | - |
| College or Associate's Degree | $61,583 | $36,230 |
| Bachelor's Degree | $114,000 | $58,102 |
| Graduate Degree | $166,324 | $36,083 |
| Total | $79,798 | $37,418 |
Family Income in Bristol
Family Income Brackets in Bristol
According to the Bristol family income data, there are 486 families falling into the $100,000 to $149,999 income range, which is the most common income bracket and makes up 31.9% of all families. Conversely, the less than $10,000 income bracket is the least frequent group with only 18 families (1.2%) belonging to this category.
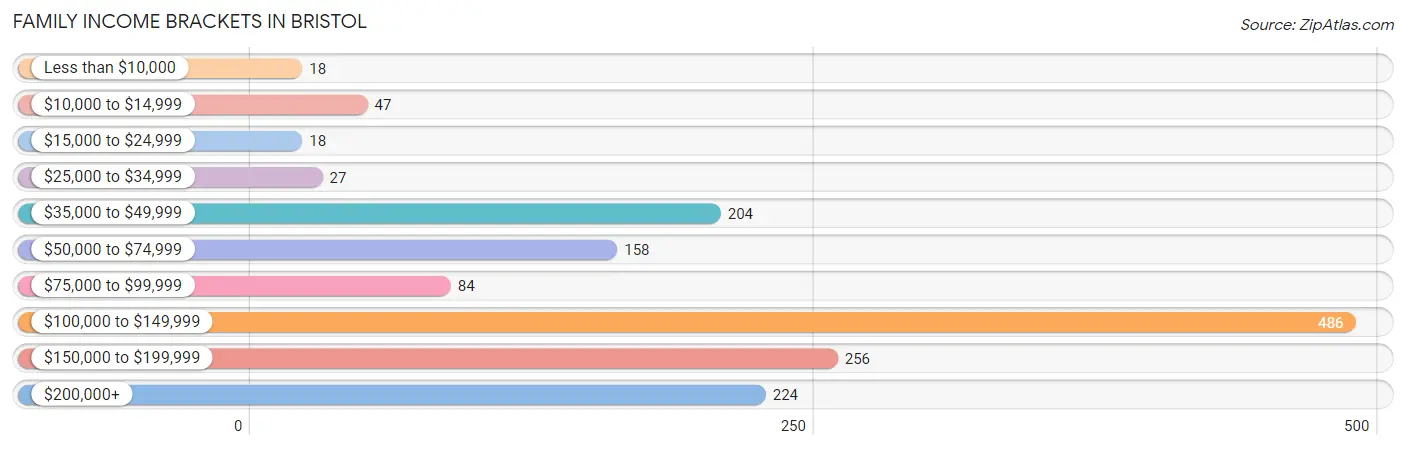
| Income Bracket | # Families | % Families |
| Less than $10,000 | 18 | 1.2% |
| $10,000 to $14,999 | 47 | 3.1% |
| $15,000 to $24,999 | 18 | 1.2% |
| $25,000 to $34,999 | 27 | 1.8% |
| $35,000 to $49,999 | 204 | 13.4% |
| $50,000 to $74,999 | 158 | 10.4% |
| $75,000 to $99,999 | 84 | 5.5% |
| $100,000 to $149,999 | 486 | 31.9% |
| $150,000 to $199,999 | 256 | 16.8% |
| $200,000+ | 224 | 14.7% |
Family Income by Famaliy Size in Bristol
6-person families (34 | 2.2%) account for the highest median family income in Bristol with $155,789 per family, while 2-person families (837 | 55.0%) have the highest median income of $51,702 per family member.
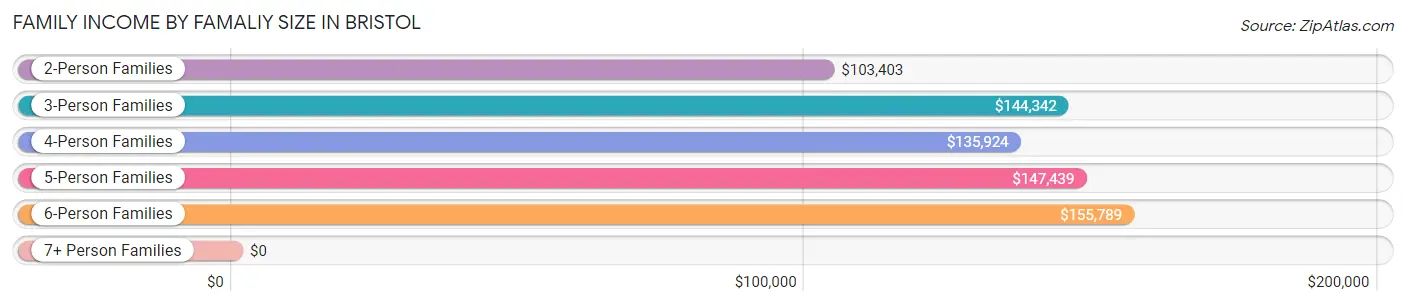
| Income Bracket | # Families | Median Income |
| 2-Person Families | 837 (55.0%) | $103,403 |
| 3-Person Families | 214 (14.1%) | $144,342 |
| 4-Person Families | 277 (18.2%) | $135,924 |
| 5-Person Families | 160 (10.5%) | $147,439 |
| 6-Person Families | 34 (2.2%) | $155,789 |
| 7+ Person Families | 0 (0.0%) | $0 |
| Total | 1,522 (100.0%) | $135,855 |
Family Income by Number of Earners in Bristol
The median family income in Bristol is $135,855, with families comprising 2 earners (580) having the highest median family income of $152,750, while families with no earners (298) have the lowest median family income of $42,277, accounting for 38.1% and 19.6% of families, respectively.
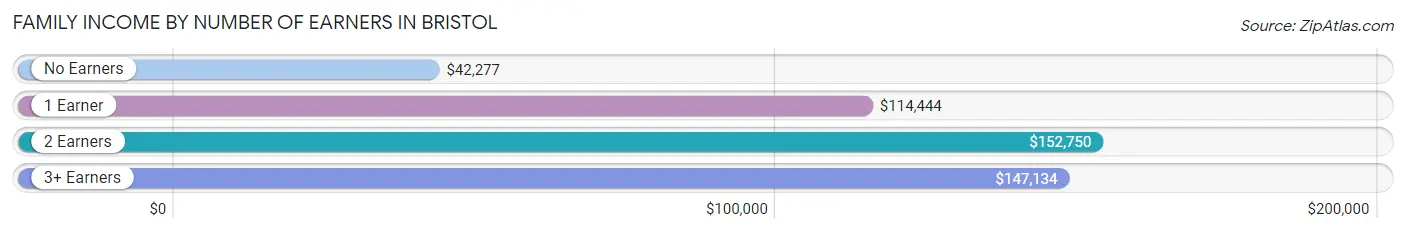
| Number of Earners | # Families | Median Income |
| No Earners | 298 (19.6%) | $42,277 |
| 1 Earner | 404 (26.5%) | $114,444 |
| 2 Earners | 580 (38.1%) | $152,750 |
| 3+ Earners | 240 (15.8%) | $147,134 |
| Total | 1,522 (100.0%) | $135,855 |
Household Income in Bristol
Household Income Brackets in Bristol
With 542 households falling in the category, the $100,000 to $149,999 income range is the most frequent in Bristol, accounting for 27.0% of all households. In contrast, only 34 households (1.7%) fall into the less than $10,000 income bracket, making it the least populous group.
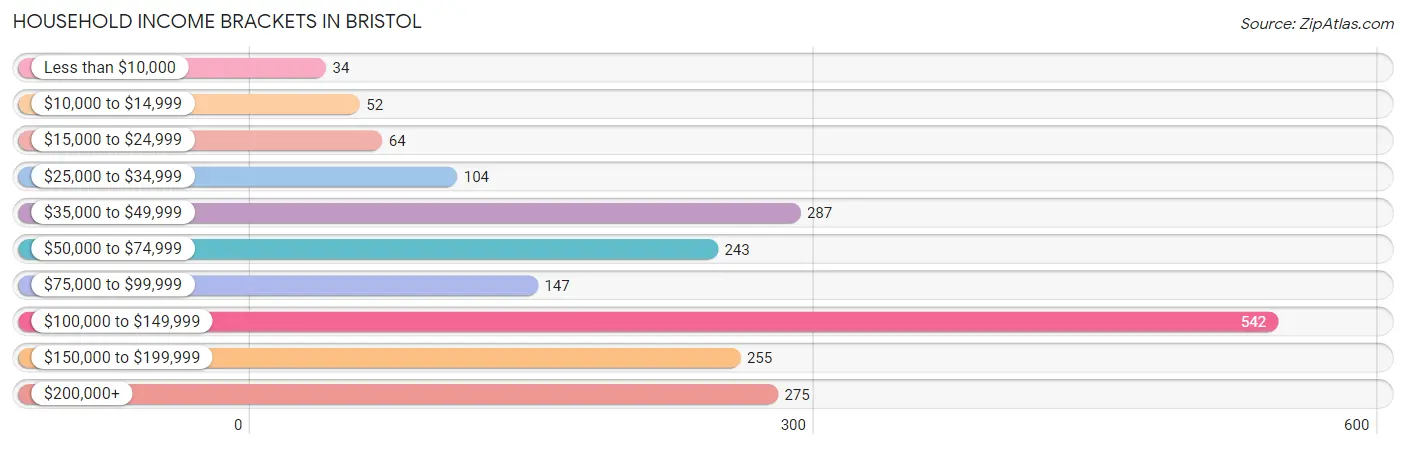
| Income Bracket | # Households | % Households |
| Less than $10,000 | 34 | 1.7% |
| $10,000 to $14,999 | 52 | 2.6% |
| $15,000 to $24,999 | 64 | 3.2% |
| $25,000 to $34,999 | 104 | 5.2% |
| $35,000 to $49,999 | 287 | 14.3% |
| $50,000 to $74,999 | 243 | 12.1% |
| $75,000 to $99,999 | 147 | 7.3% |
| $100,000 to $149,999 | 542 | 27.0% |
| $150,000 to $199,999 | 255 | 12.7% |
| $200,000+ | 275 | 13.7% |
Household Income by Householder Age in Bristol
The median household income in Bristol is $103,652, with the highest median household income of $146,860 found in the 45 to 64 years age bracket for the primary householder. A total of 780 households (38.8%) fall into this category. Meanwhile, the 15 to 24 years age bracket for the primary householder has the lowest median household income of $0, with 35 households (1.7%) in this group.
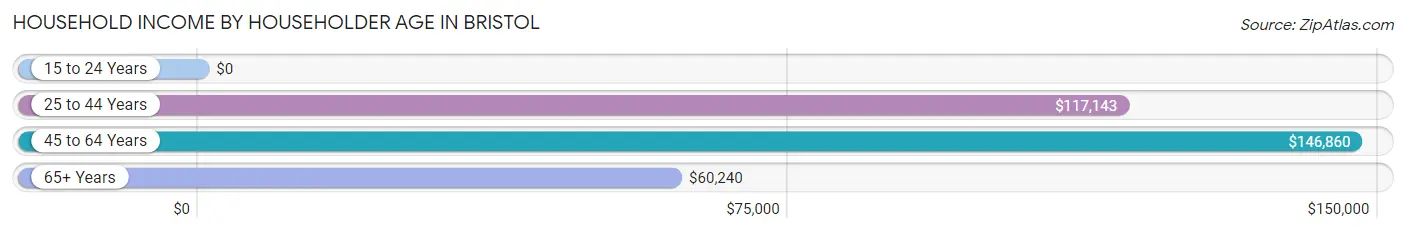
| Income Bracket | # Households | Median Income |
| 15 to 24 Years | 35 (1.7%) | $0 |
| 25 to 44 Years | 444 (22.1%) | $117,143 |
| 45 to 64 Years | 780 (38.8%) | $146,860 |
| 65+ Years | 750 (37.3%) | $60,240 |
| Total | 2,009 (100.0%) | $103,652 |
Poverty in Bristol
Income Below Poverty by Sex and Age in Bristol
With 5.1% poverty level for males and 3.1% for females among the residents of Bristol, 75 year old and over males and 65 to 74 year old females are the most vulnerable to poverty, with 43 males (33.9%) and 53 females (11.9%) in their respective age groups living below the poverty level.
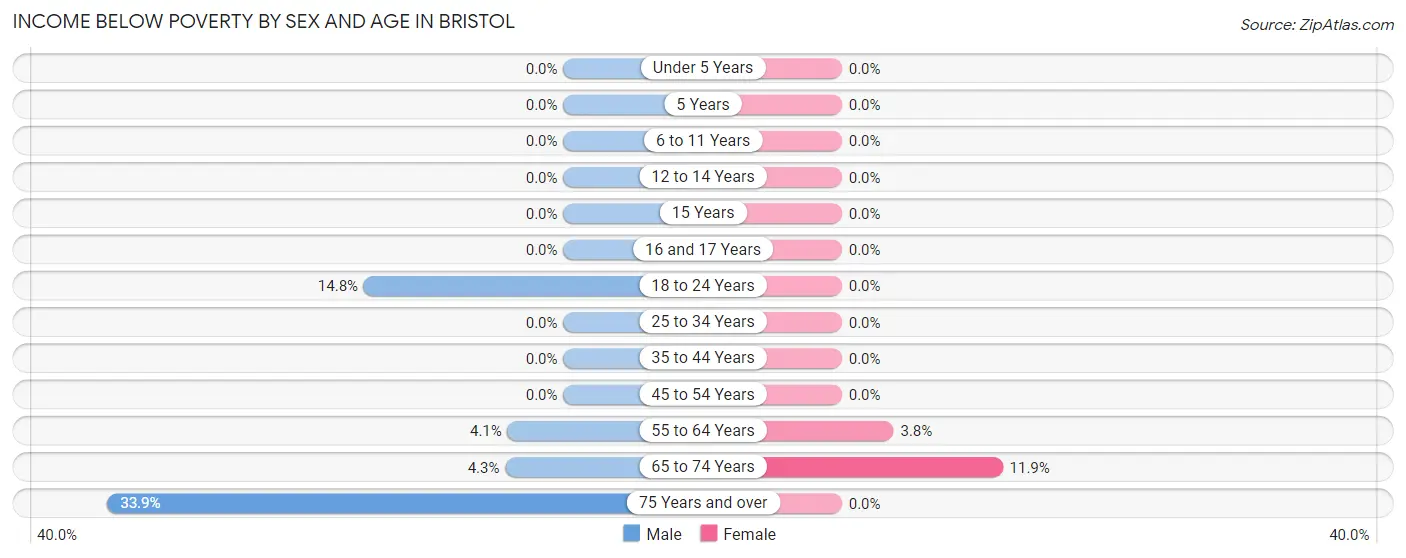
| Age Bracket | Male | Female |
| Under 5 Years | 0 (0.0%) | 0 (0.0%) |
| 5 Years | 0 (0.0%) | 0 (0.0%) |
| 6 to 11 Years | 0 (0.0%) | 0 (0.0%) |
| 12 to 14 Years | 0 (0.0%) | 0 (0.0%) |
| 15 Years | 0 (0.0%) | 0 (0.0%) |
| 16 and 17 Years | 0 (0.0%) | 0 (0.0%) |
| 18 to 24 Years | 73 (14.8%) | 0 (0.0%) |
| 25 to 34 Years | 0 (0.0%) | 0 (0.0%) |
| 35 to 44 Years | 0 (0.0%) | 0 (0.0%) |
| 45 to 54 Years | 0 (0.0%) | 0 (0.0%) |
| 55 to 64 Years | 18 (4.1%) | 16 (3.8%) |
| 65 to 74 Years | 16 (4.3%) | 53 (11.9%) |
| 75 Years and over | 43 (33.9%) | 0 (0.0%) |
| Total | 150 (5.1%) | 69 (3.1%) |
Income Above Poverty by Sex and Age in Bristol
According to the poverty statistics in Bristol, males aged under 5 years and females aged under 5 years are the age groups that are most secure financially, with 100.0% of males and 100.0% of females in these age groups living above the poverty line.
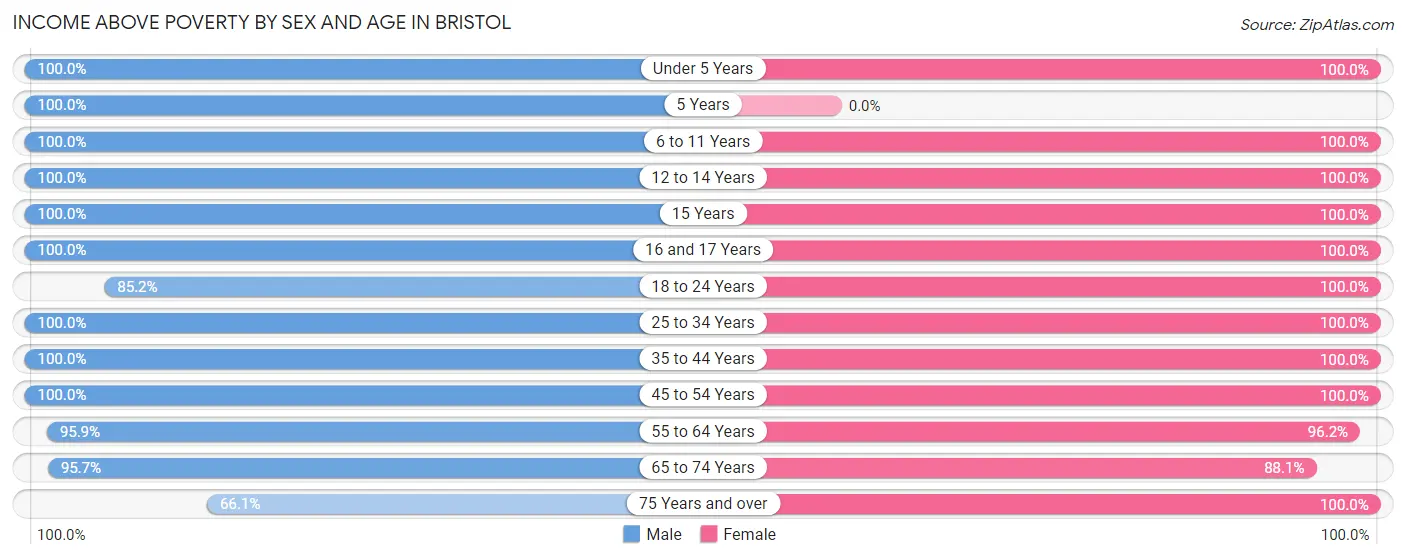
| Age Bracket | Male | Female |
| Under 5 Years | 205 (100.0%) | 34 (100.0%) |
| 5 Years | 38 (100.0%) | 0 (0.0%) |
| 6 to 11 Years | 199 (100.0%) | 129 (100.0%) |
| 12 to 14 Years | 132 (100.0%) | 85 (100.0%) |
| 15 Years | 22 (100.0%) | 18 (100.0%) |
| 16 and 17 Years | 109 (100.0%) | 59 (100.0%) |
| 18 to 24 Years | 420 (85.2%) | 117 (100.0%) |
| 25 to 34 Years | 151 (100.0%) | 183 (100.0%) |
| 35 to 44 Years | 301 (100.0%) | 247 (100.0%) |
| 45 to 54 Years | 369 (100.0%) | 358 (100.0%) |
| 55 to 64 Years | 417 (95.9%) | 401 (96.2%) |
| 65 to 74 Years | 355 (95.7%) | 391 (88.1%) |
| 75 Years and over | 84 (66.1%) | 126 (100.0%) |
| Total | 2,802 (94.9%) | 2,148 (96.9%) |
Income Below Poverty Among Married-Couple Families in Bristol
The poverty statistics for married-couple families in Bristol show that 4.8% or 65 of the total 1,362 families live below the poverty line. Families with no children have the highest poverty rate of 6.9%, comprising of 65 families. On the other hand, families with 1 or 2 children have the lowest poverty rate of 0.0%, which includes 0 families.
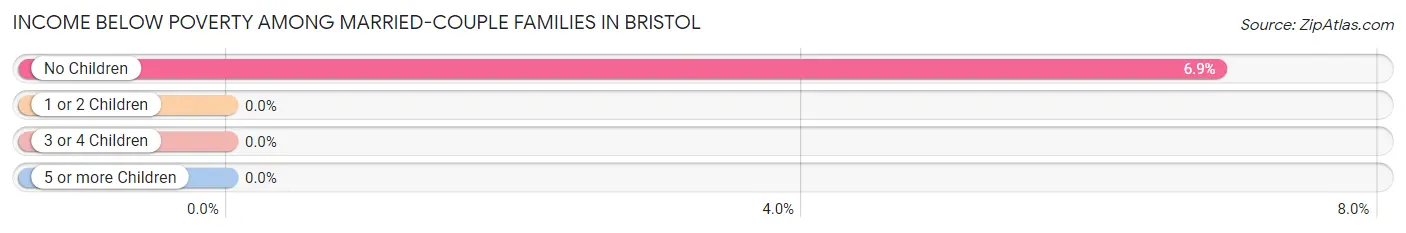
| Children | Above Poverty | Below Poverty |
| No Children | 878 (93.1%) | 65 (6.9%) |
| 1 or 2 Children | 359 (100.0%) | 0 (0.0%) |
| 3 or 4 Children | 60 (100.0%) | 0 (0.0%) |
| 5 or more Children | 0 (0.0%) | 0 (0.0%) |
| Total | 1,297 (95.2%) | 65 (4.8%) |
Income Below Poverty Among Single-Parent Households in Bristol
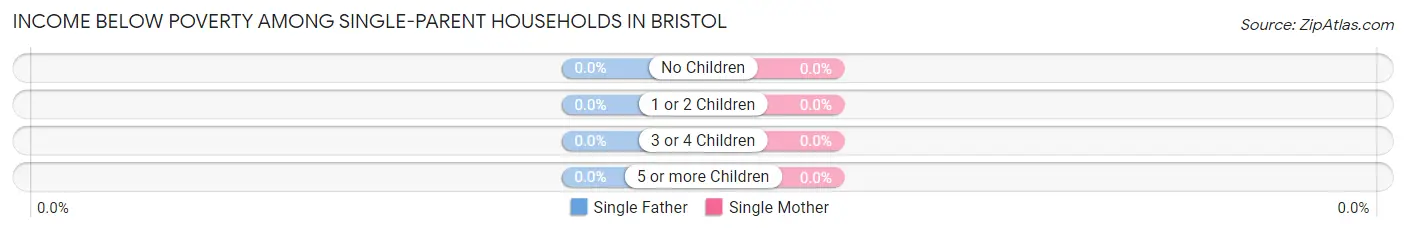
| Children | Single Father | Single Mother |
| No Children | 0 (0.0%) | 0 (0.0%) |
| 1 or 2 Children | 0 (0.0%) | 0 (0.0%) |
| 3 or 4 Children | 0 (0.0%) | 0 (0.0%) |
| 5 or more Children | 0 (0.0%) | 0 (0.0%) |
| Total | 0 (0.0%) | 0 (0.0%) |
Income Below Poverty Among Married-Couple vs Single-Parent Households in Bristol
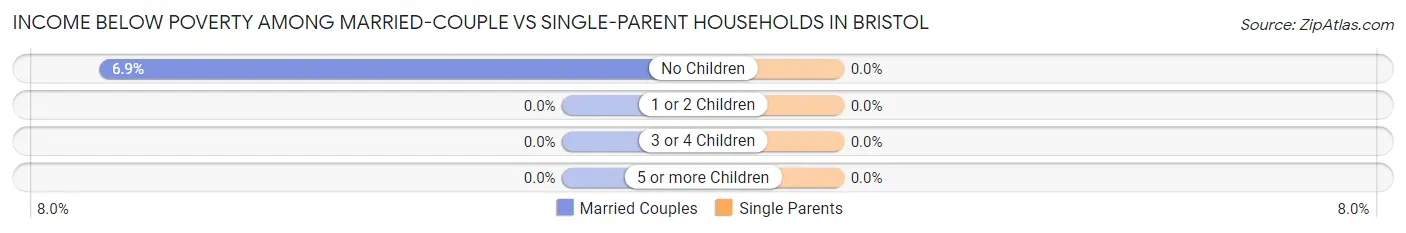
| Children | Married-Couple Families | Single-Parent Households |
| No Children | 65 (6.9%) | 0 (0.0%) |
| 1 or 2 Children | 0 (0.0%) | 0 (0.0%) |
| 3 or 4 Children | 0 (0.0%) | 0 (0.0%) |
| 5 or more Children | 0 (0.0%) | 0 (0.0%) |
| Total | 65 (4.8%) | 0 (0.0%) |
Race in Bristol
The most populous races in Bristol are White / Caucasian (5,019 | 97.1%), Hispanic or Latino (175 | 3.4%), and Two or more Races (100 | 1.9%).
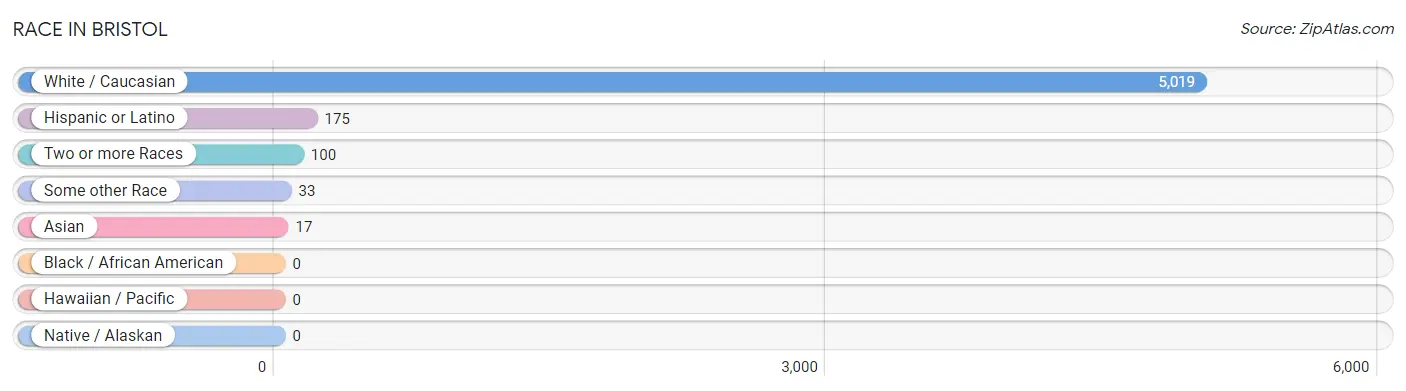
| Race | # Population | % Population |
| Asian | 17 | 0.3% |
| Black / African American | 0 | 0.0% |
| Hawaiian / Pacific | 0 | 0.0% |
| Hispanic or Latino | 175 | 3.4% |
| Native / Alaskan | 0 | 0.0% |
| White / Caucasian | 5,019 | 97.1% |
| Two or more Races | 100 | 1.9% |
| Some other Race | 33 | 0.6% |
| Total | 5,169 | 100.0% |
Ancestry in Bristol
The most populous ancestries reported in Bristol are German (2,039 | 39.5%), Italian (922 | 17.8%), English (521 | 10.1%), Polish (420 | 8.1%), and Irish (415 | 8.0%), together accounting for 83.5% of all Bristol residents.
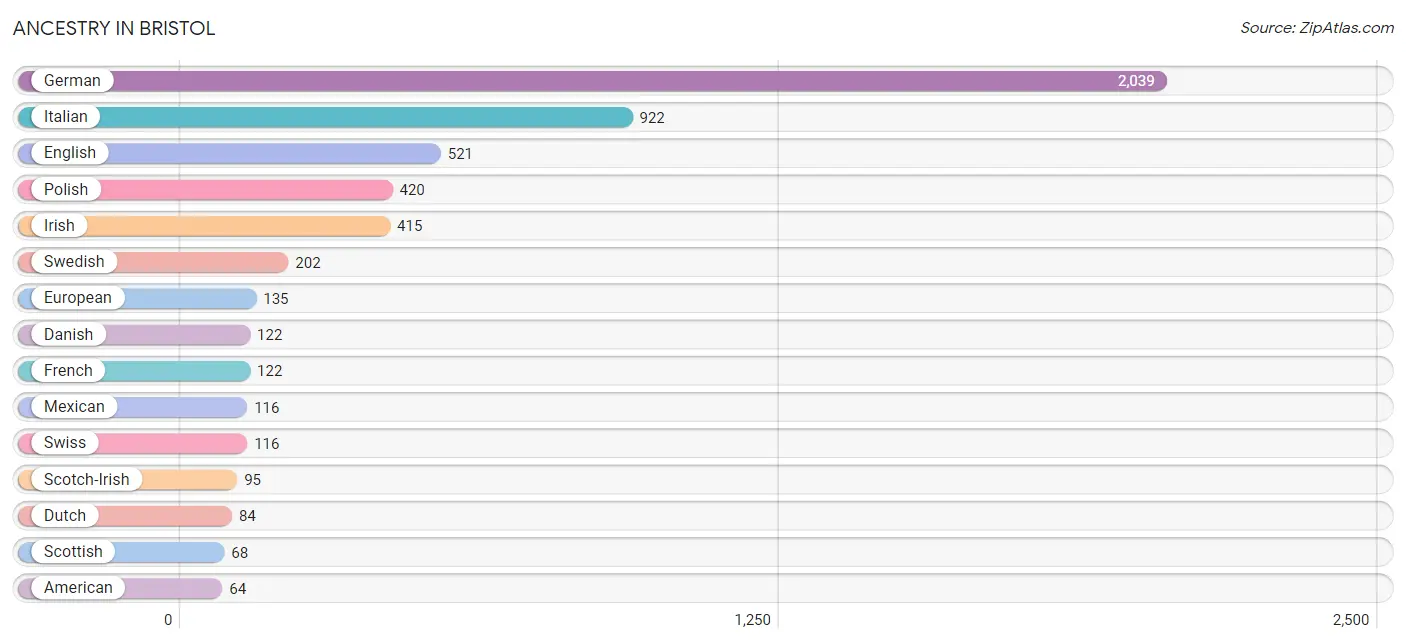
| Ancestry | # Population | % Population |
| American | 64 | 1.2% |
| Arab | 26 | 0.5% |
| Bhutanese | 17 | 0.3% |
| Canadian | 1 | 0.0% |
| Colombian | 13 | 0.3% |
| Czech | 29 | 0.6% |
| Danish | 122 | 2.4% |
| Dominican | 29 | 0.6% |
| Dutch | 84 | 1.6% |
| English | 521 | 10.1% |
| European | 135 | 2.6% |
| Finnish | 23 | 0.4% |
| French | 122 | 2.4% |
| French Canadian | 9 | 0.2% |
| German | 2,039 | 39.5% |
| Greek | 22 | 0.4% |
| Hungarian | 49 | 0.9% |
| Icelander | 15 | 0.3% |
| Irish | 415 | 8.0% |
| Italian | 922 | 17.8% |
| Lebanese | 26 | 0.5% |
| Lithuanian | 22 | 0.4% |
| Mexican | 116 | 2.2% |
| Northern European | 20 | 0.4% |
| Norwegian | 58 | 1.1% |
| Pennsylvania German | 22 | 0.4% |
| Polish | 420 | 8.1% |
| Puerto Rican | 17 | 0.3% |
| Russian | 35 | 0.7% |
| Scandinavian | 20 | 0.4% |
| Scotch-Irish | 95 | 1.8% |
| Scottish | 68 | 1.3% |
| Slovak | 30 | 0.6% |
| South American | 13 | 0.3% |
| Swedish | 202 | 3.9% |
| Swiss | 116 | 2.2% |
| Ukrainian | 43 | 0.8% |
| Welsh | 46 | 0.9% | View All 38 Rows |
Immigrants in Bristol
The most numerous immigrant groups reported in Bristol came from Europe (104 | 2.0%), Western Europe (49 | 0.9%), Germany (33 | 0.6%), Italy (20 | 0.4%), and Southern Europe (20 | 0.4%), together accounting for 4.4% of all Bristol residents.
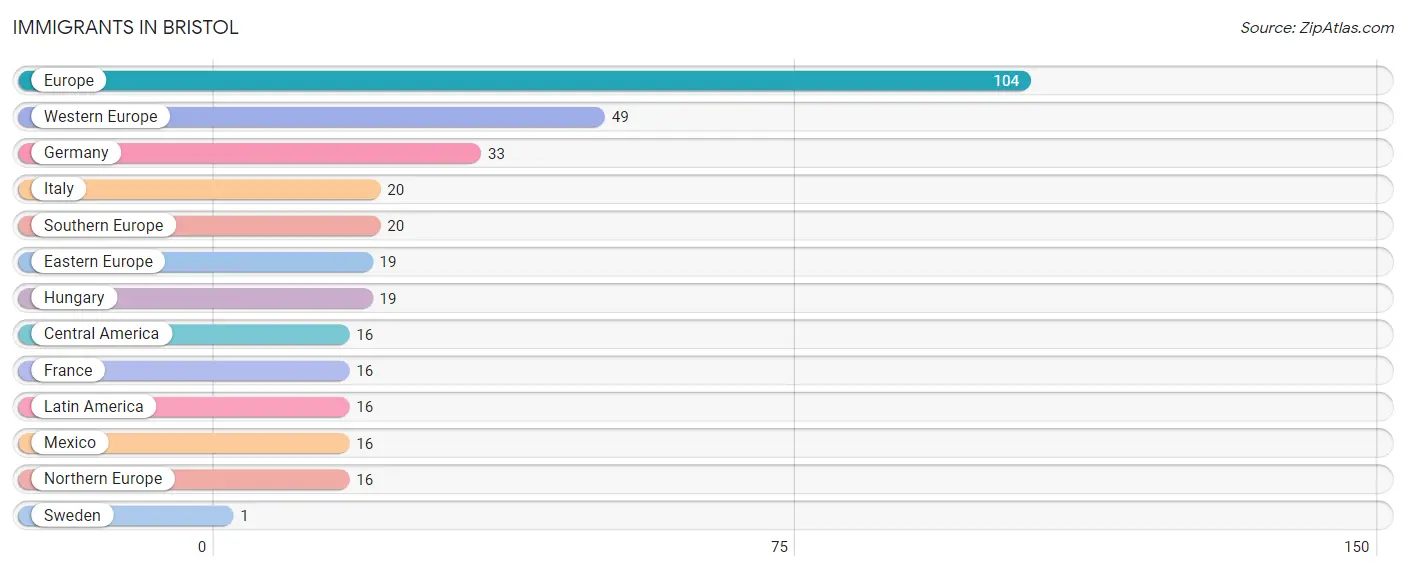
| Immigration Origin | # Population | % Population |
| Central America | 16 | 0.3% |
| Eastern Europe | 19 | 0.4% |
| Europe | 104 | 2.0% |
| France | 16 | 0.3% |
| Germany | 33 | 0.6% |
| Hungary | 19 | 0.4% |
| Italy | 20 | 0.4% |
| Latin America | 16 | 0.3% |
| Mexico | 16 | 0.3% |
| Northern Europe | 16 | 0.3% |
| Southern Europe | 20 | 0.4% |
| Sweden | 1 | 0.0% |
| Western Europe | 49 | 0.9% | View All 13 Rows |
Sex and Age in Bristol
Sex and Age in Bristol
The most populous age groups in Bristol are 15 to 19 Years (339 | 11.5%) for men and 70 to 74 Years (270 | 12.2%) for women.
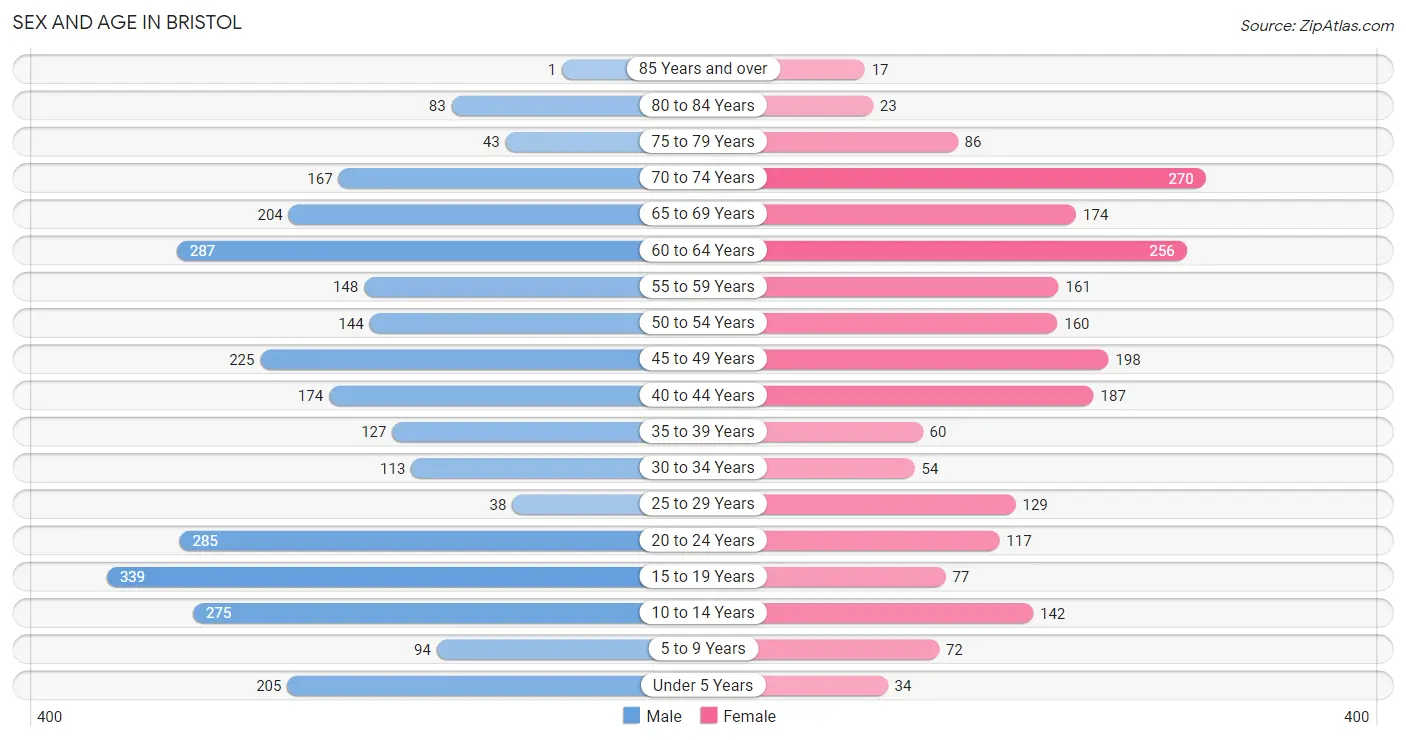
| Age Bracket | Male | Female |
| Under 5 Years | 205 (6.9%) | 34 (1.5%) |
| 5 to 9 Years | 94 (3.2%) | 72 (3.3%) |
| 10 to 14 Years | 275 (9.3%) | 142 (6.4%) |
| 15 to 19 Years | 339 (11.5%) | 77 (3.5%) |
| 20 to 24 Years | 285 (9.7%) | 117 (5.3%) |
| 25 to 29 Years | 38 (1.3%) | 129 (5.8%) |
| 30 to 34 Years | 113 (3.8%) | 54 (2.4%) |
| 35 to 39 Years | 127 (4.3%) | 60 (2.7%) |
| 40 to 44 Years | 174 (5.9%) | 187 (8.4%) |
| 45 to 49 Years | 225 (7.6%) | 198 (8.9%) |
| 50 to 54 Years | 144 (4.9%) | 160 (7.2%) |
| 55 to 59 Years | 148 (5.0%) | 161 (7.3%) |
| 60 to 64 Years | 287 (9.7%) | 256 (11.6%) |
| 65 to 69 Years | 204 (6.9%) | 174 (7.9%) |
| 70 to 74 Years | 167 (5.7%) | 270 (12.2%) |
| 75 to 79 Years | 43 (1.5%) | 86 (3.9%) |
| 80 to 84 Years | 83 (2.8%) | 23 (1.0%) |
| 85 Years and over | 1 (0.0%) | 17 (0.8%) |
| Total | 2,952 (100.0%) | 2,217 (100.0%) |
Families and Households in Bristol
Median Family Size in Bristol
The median family size in Bristol is 2.96 persons per family, with single female/mother families (94 | 6.2%) accounting for the largest median family size of 3.3 persons per family. On the other hand, married-couple families (1,362 | 89.5%) represent the smallest median family size with 2.92 persons per family.
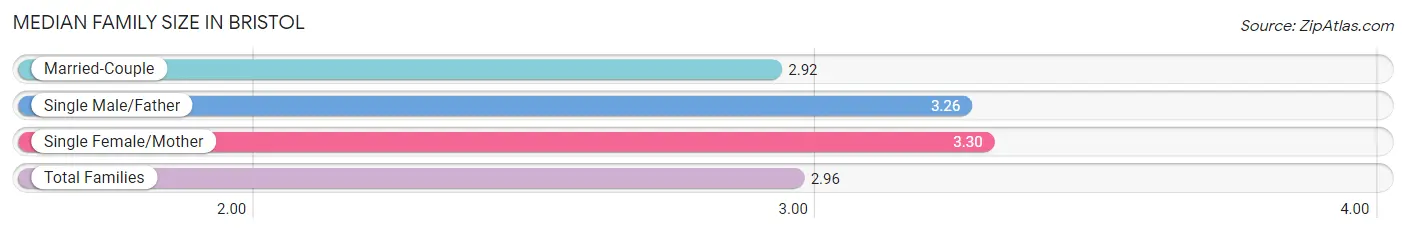
| Family Type | # Families | Family Size |
| Married-Couple | 1,362 (89.5%) | 2.92 |
| Single Male/Father | 66 (4.3%) | 3.26 |
| Single Female/Mother | 94 (6.2%) | 3.30 |
| Total Families | 1,522 (100.0%) | 2.96 |
Median Household Size in Bristol
The median household size in Bristol is 2.57 persons per household, with single female/mother households (94 | 4.7%) accounting for the largest median household size of 3.3 persons per household. non-family households (487 | 24.2%) represent the smallest median household size with 1.36 persons per household.
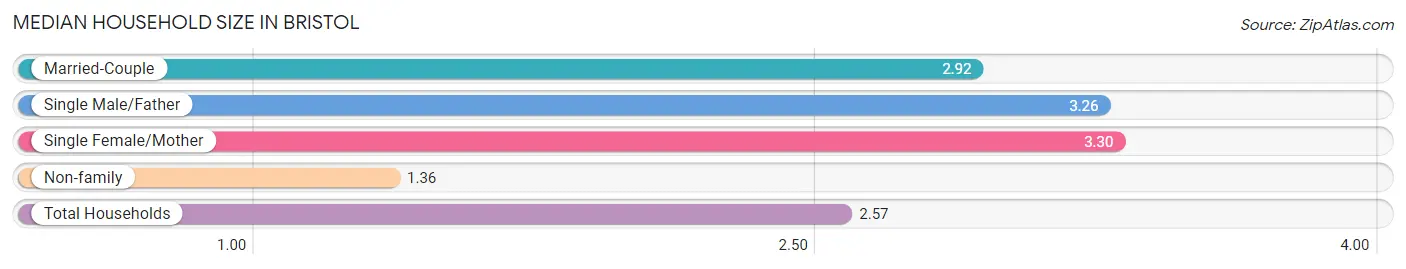
| Household Type | # Households | Household Size |
| Married-Couple | 1,362 (67.8%) | 2.92 |
| Single Male/Father | 66 (3.3%) | 3.26 |
| Single Female/Mother | 94 (4.7%) | 3.30 |
| Non-family | 487 (24.2%) | 1.36 |
| Total Households | 2,009 (100.0%) | 2.57 |
Household Size by Marriage Status in Bristol
Out of a total of 2,009 households in Bristol, 1,522 (75.8%) are family households, while 487 (24.2%) are nonfamily households. The most numerous type of family households are 2-person households, comprising 837, and the most common type of nonfamily households are 1-person households, comprising 371.
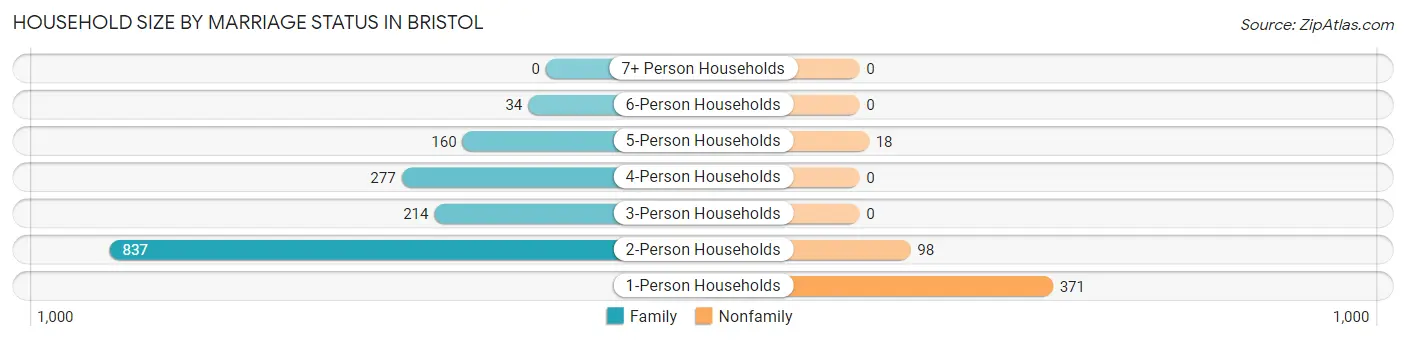
| Household Size | Family Households | Nonfamily Households |
| 1-Person Households | - | 371 (18.5%) |
| 2-Person Households | 837 (41.7%) | 98 (4.9%) |
| 3-Person Households | 214 (10.6%) | 0 (0.0%) |
| 4-Person Households | 277 (13.8%) | 0 (0.0%) |
| 5-Person Households | 160 (8.0%) | 18 (0.9%) |
| 6-Person Households | 34 (1.7%) | 0 (0.0%) |
| 7+ Person Households | 0 (0.0%) | 0 (0.0%) |
| Total | 1,522 (75.8%) | 487 (24.2%) |
Female Fertility in Bristol
Fertility by Age in Bristol
Average fertility rate in Bristol is 45.0 births per 1,000 women. Women in the age bracket of 20 to 34 years have the highest fertility rate with 130.0 births per 1,000 women. Women in the age bracket of 20 to 34 years acount for 100.0% of all women with births.
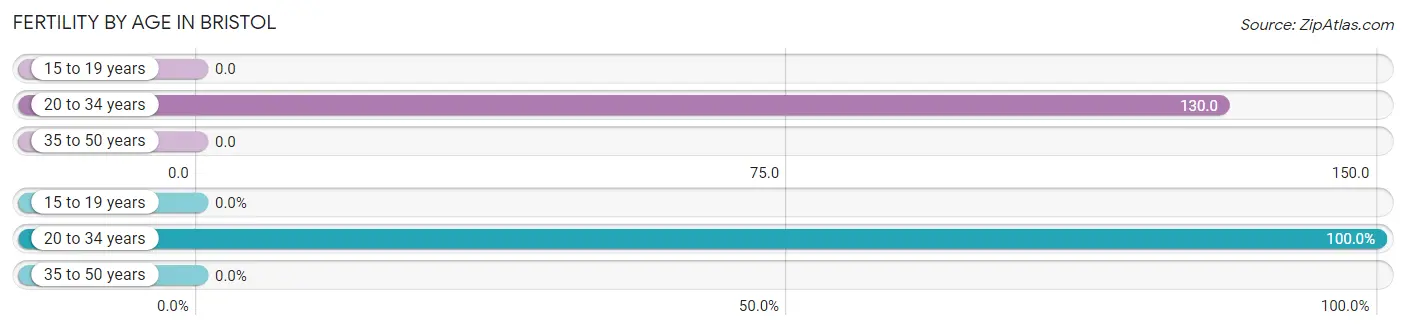
| Age Bracket | Women with Births | Births / 1,000 Women |
| 15 to 19 years | 0 (0.0%) | 0.0 |
| 20 to 34 years | 39 (100.0%) | 130.0 |
| 35 to 50 years | 0 (0.0%) | 0.0 |
| Total | 39 (100.0%) | 45.0 |
Fertility by Age by Marriage Status in Bristol
56.4% of women with births (39) in Bristol are married. The highest percentage of unmarried women with births falls into 20 to 34 years age bracket with 43.6% of them unmarried at the time of birth, while the lowest percentage of unmarried women with births belong to 20 to 34 years age bracket with 43.6% of them unmarried.
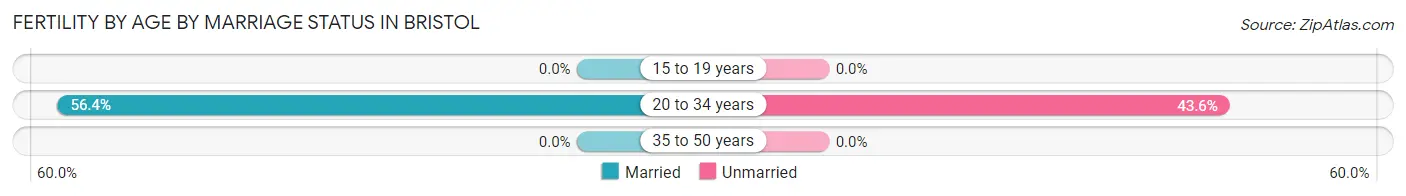
| Age Bracket | Married | Unmarried |
| 15 to 19 years | 0 (0.0%) | 0 (0.0%) |
| 20 to 34 years | 22 (56.4%) | 17 (43.6%) |
| 35 to 50 years | 0 (0.0%) | 0 (0.0%) |
| Total | 22 (56.4%) | 17 (43.6%) |
Fertility by Education in Bristol
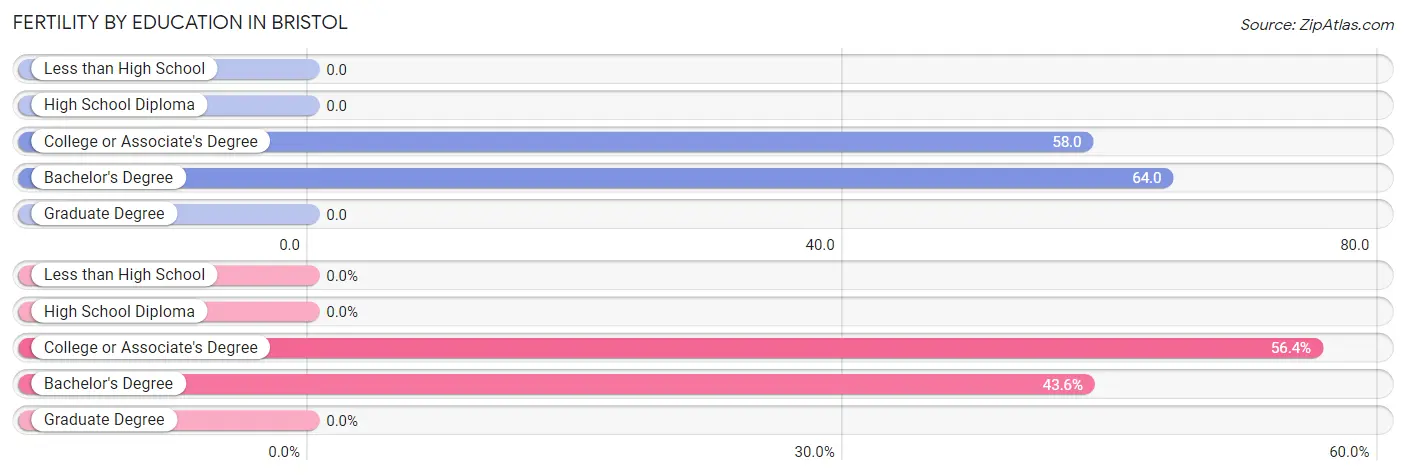
| Educational Attainment | Women with Births | Births / 1,000 Women |
| Less than High School | 0 (0.0%) | 0.0 |
| High School Diploma | 0 (0.0%) | 0.0 |
| College or Associate's Degree | 22 (56.4%) | 58.0 |
| Bachelor's Degree | 17 (43.6%) | 64.0 |
| Graduate Degree | 0 (0.0%) | 0.0 |
| Total | 39 (100.0%) | 45.0 |
Fertility by Education by Marriage Status in Bristol
43.6% of women with births in Bristol are unmarried. Women with the educational attainment of college or associate's degree are most likely to be married with 100.0% of them married at childbirth, while women with the educational attainment of bachelor's degree are least likely to be married with 100.0% of them unmarried at childbirth.
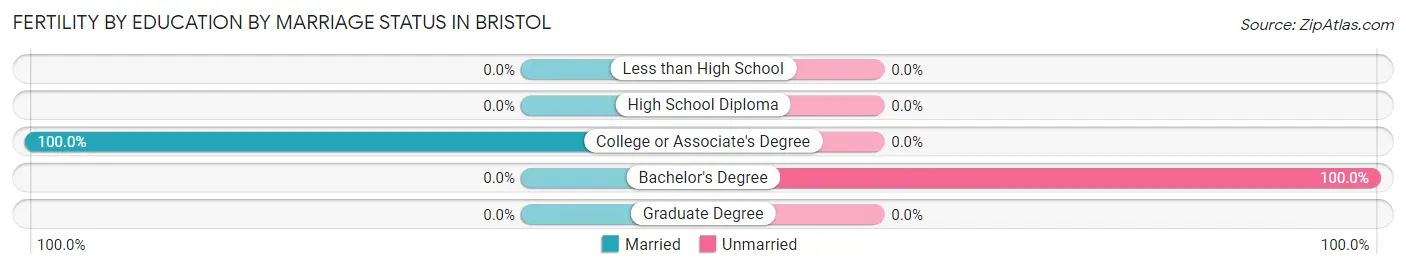
| Educational Attainment | Married | Unmarried |
| Less than High School | 0 (0.0%) | 0 (0.0%) |
| High School Diploma | 0 (0.0%) | 0 (0.0%) |
| College or Associate's Degree | 22 (100.0%) | 0 (0.0%) |
| Bachelor's Degree | 0 (0.0%) | 17 (100.0%) |
| Graduate Degree | 0 (0.0%) | 0 (0.0%) |
| Total | 22 (56.4%) | 17 (43.6%) |
Employment Characteristics in Bristol
Employment by Class of Employer in Bristol
Among the 2,705 employed individuals in Bristol, private company employees (1,744 | 64.5%), not-for-profit organizations (336 | 12.4%), and local government employees (279 | 10.3%) make up the most common classes of employment.
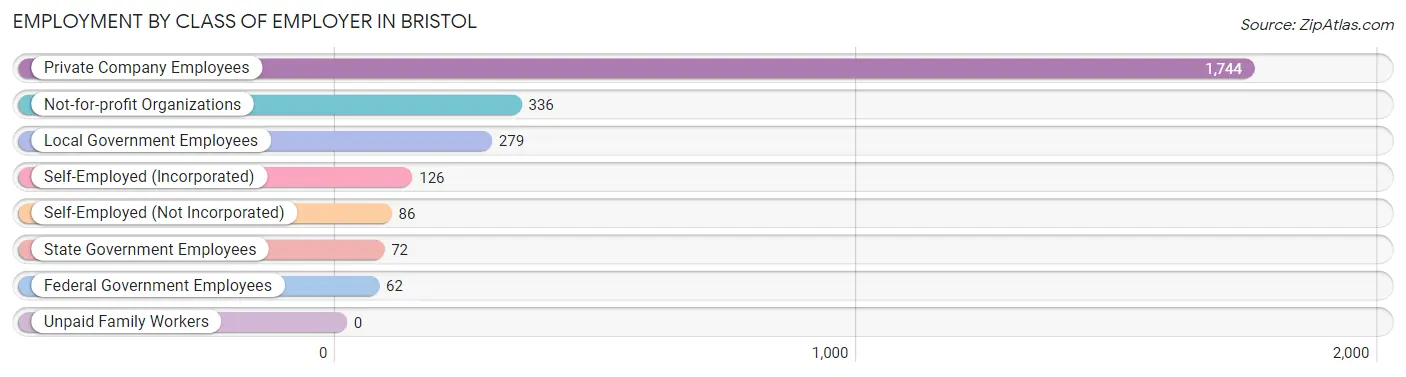
| Employer Class | # Employees | % Employees |
| Private Company Employees | 1,744 | 64.5% |
| Self-Employed (Incorporated) | 126 | 4.7% |
| Self-Employed (Not Incorporated) | 86 | 3.2% |
| Not-for-profit Organizations | 336 | 12.4% |
| Local Government Employees | 279 | 10.3% |
| State Government Employees | 72 | 2.7% |
| Federal Government Employees | 62 | 2.3% |
| Unpaid Family Workers | 0 | 0.0% |
| Total | 2,705 | 100.0% |
Employment Status by Age in Bristol
According to the labor force statistics for Bristol, out of the total population over 16 years of age (4,307), 68.7% or 2,959 individuals are in the labor force, with 7.9% or 234 of them unemployed. The age group with the highest labor force participation rate is 25 to 29 years, with 100.0% or 167 individuals in the labor force. Within the labor force, the 20 to 24 years age range has the highest percentage of unemployed individuals, with 28.5% or 113 of them being unemployed.
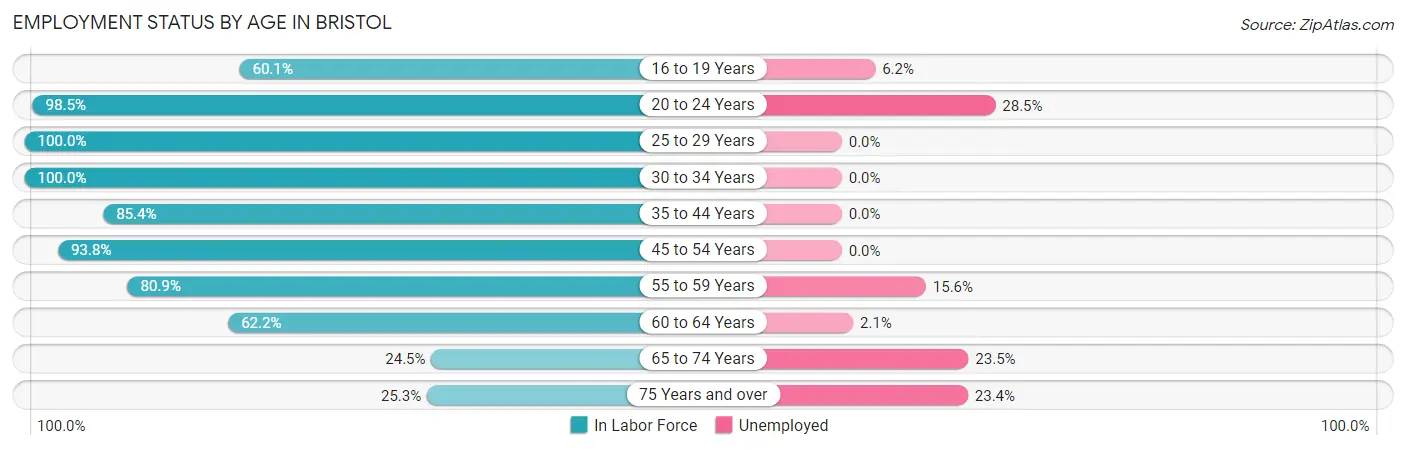
| Age Bracket | In Labor Force | Unemployed |
| 16 to 19 Years | 226 (60.1%) | 14 (6.2%) |
| 20 to 24 Years | 396 (98.5%) | 113 (28.5%) |
| 25 to 29 Years | 167 (100.0%) | 0 (0.0%) |
| 30 to 34 Years | 167 (100.0%) | 0 (0.0%) |
| 35 to 44 Years | 468 (85.4%) | 0 (0.0%) |
| 45 to 54 Years | 682 (93.8%) | 0 (0.0%) |
| 55 to 59 Years | 250 (80.9%) | 39 (15.6%) |
| 60 to 64 Years | 338 (62.2%) | 7 (2.1%) |
| 65 to 74 Years | 200 (24.5%) | 47 (23.5%) |
| 75 Years and over | 64 (25.3%) | 15 (23.4%) |
| Total | 2,959 (68.7%) | 234 (7.9%) |
Employment Status by Educational Attainment in Bristol
According to labor force statistics for Bristol, 84.2% of individuals (2,072) out of the total population between 25 and 64 years of age (2,461) are in the labor force, with 2.2% or 46 of them being unemployed. The group with the highest labor force participation rate are those with the educational attainment of bachelor's degree or higher, with 89.5% or 771 individuals in the labor force. Within the labor force, individuals with high school diploma education have the highest percentage of unemployment, with 5.6% or 18 of them being unemployed.
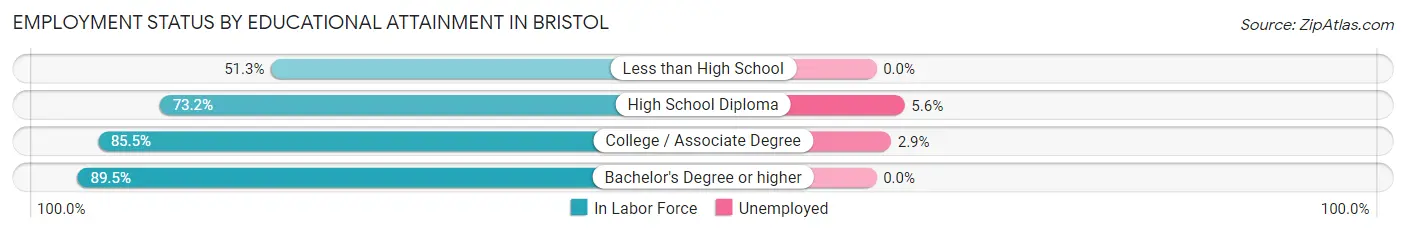
| Educational Attainment | In Labor Force | Unemployed |
| Less than High School | 20 (51.3%) | 0 (0.0%) |
| High School Diploma | 319 (73.2%) | 24 (5.6%) |
| College / Associate Degree | 962 (85.5%) | 33 (2.9%) |
| Bachelor's Degree or higher | 771 (89.5%) | 0 (0.0%) |
| Total | 2,072 (84.2%) | 54 (2.2%) |
Employment Occupations by Sex in Bristol
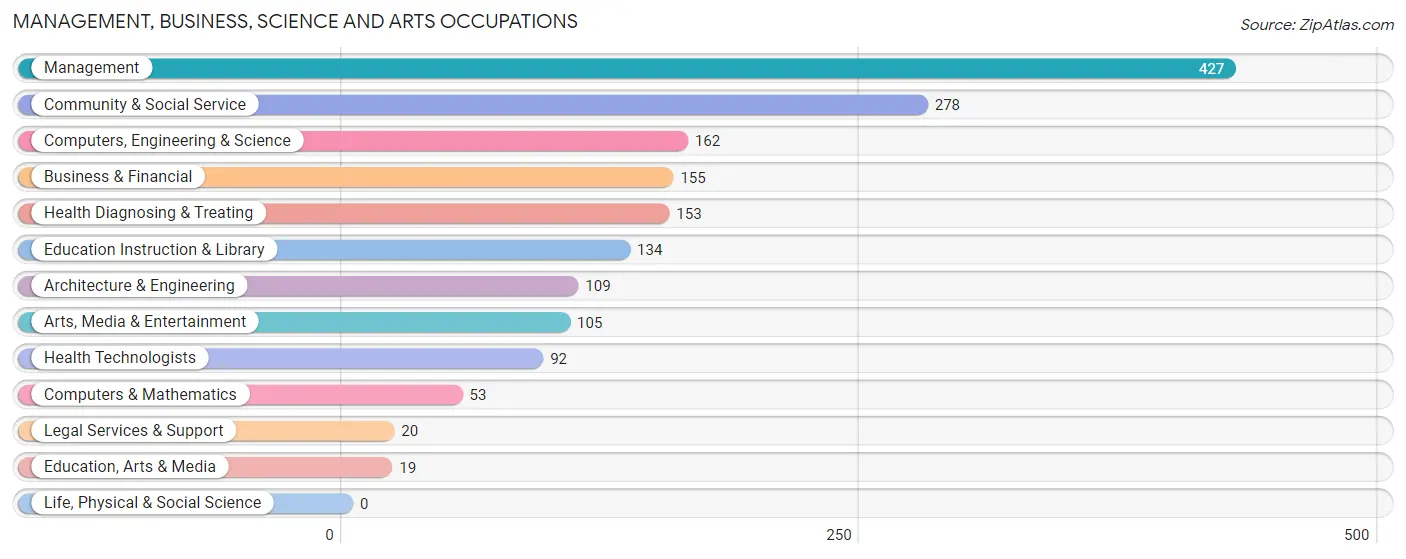
Management, Business, Science and Arts Occupations
The most common Management, Business, Science and Arts occupations in Bristol are Management (427 | 15.7%), Community & Social Service (278 | 10.2%), Computers, Engineering & Science (162 | 5.9%), Business & Financial (155 | 5.7%), and Health Diagnosing & Treating (153 | 5.6%).
Management, Business, Science and Arts Occupations by Sex
Within the Management, Business, Science and Arts occupations in Bristol, the most male-oriented occupations are Computers & Mathematics (100.0%), Legal Services & Support (100.0%), and Computers, Engineering & Science (83.3%), while the most female-oriented occupations are Education, Arts & Media (100.0%), Business & Financial (76.8%), and Education Instruction & Library (73.1%).
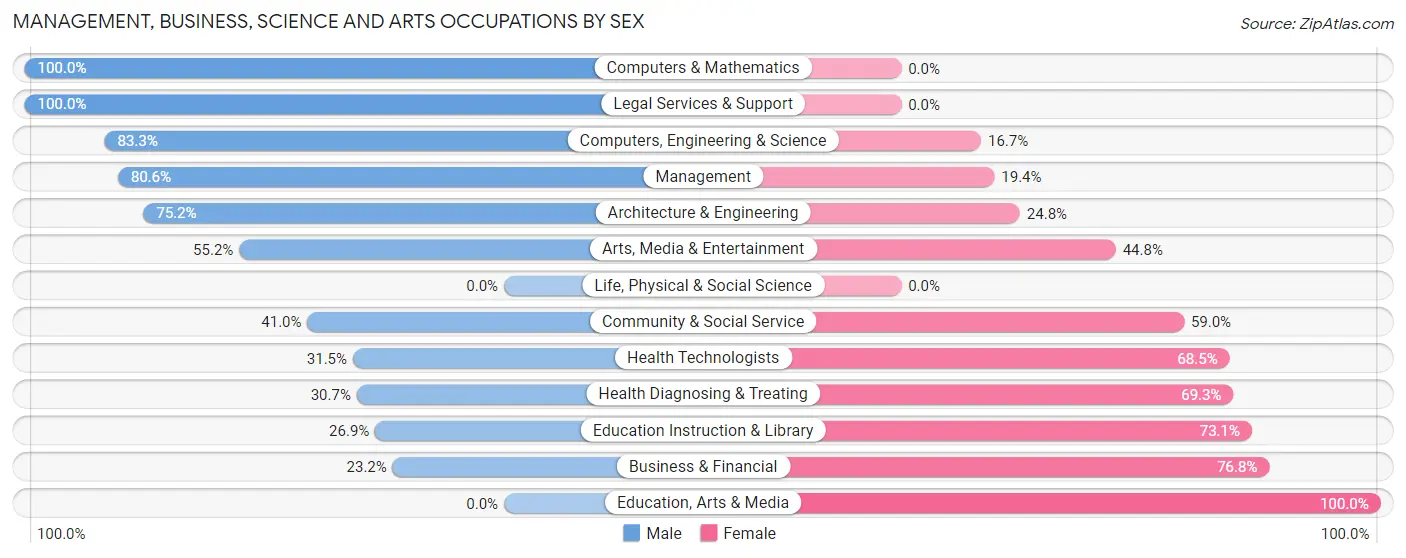
| Occupation | Male | Female |
| Management | 344 (80.6%) | 83 (19.4%) |
| Business & Financial | 36 (23.2%) | 119 (76.8%) |
| Computers, Engineering & Science | 135 (83.3%) | 27 (16.7%) |
| Computers & Mathematics | 53 (100.0%) | 0 (0.0%) |
| Architecture & Engineering | 82 (75.2%) | 27 (24.8%) |
| Life, Physical & Social Science | 0 (0.0%) | 0 (0.0%) |
| Community & Social Service | 114 (41.0%) | 164 (59.0%) |
| Education, Arts & Media | 0 (0.0%) | 19 (100.0%) |
| Legal Services & Support | 20 (100.0%) | 0 (0.0%) |
| Education Instruction & Library | 36 (26.9%) | 98 (73.1%) |
| Arts, Media & Entertainment | 58 (55.2%) | 47 (44.8%) |
| Health Diagnosing & Treating | 47 (30.7%) | 106 (69.3%) |
| Health Technologists | 29 (31.5%) | 63 (68.5%) |
| Total (Category) | 676 (57.5%) | 499 (42.5%) |
| Total (Overall) | 1,507 (55.3%) | 1,216 (44.7%) |
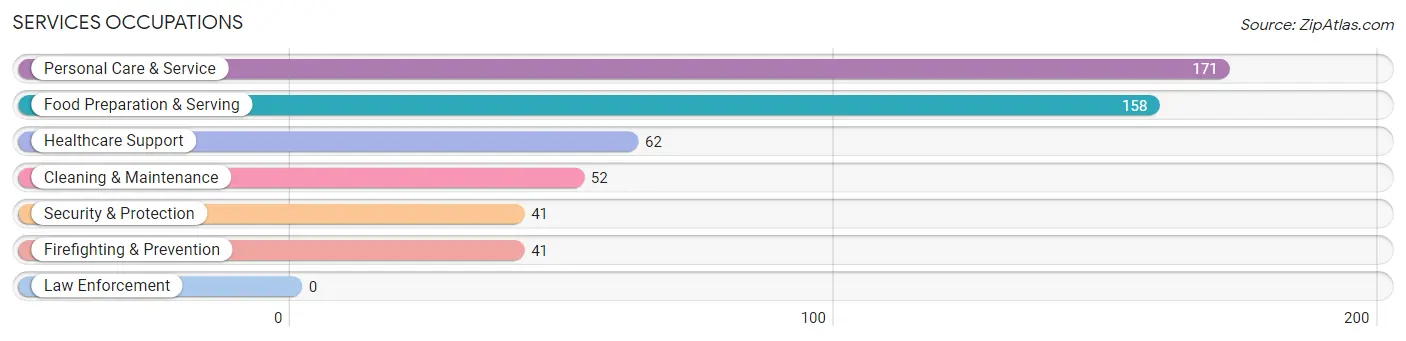
Services Occupations
The most common Services occupations in Bristol are Personal Care & Service (171 | 6.3%), Food Preparation & Serving (158 | 5.8%), Healthcare Support (62 | 2.3%), Cleaning & Maintenance (52 | 1.9%), and Security & Protection (41 | 1.5%).
Services Occupations by Sex
Within the Services occupations in Bristol, the most male-oriented occupations are Security & Protection (100.0%), Firefighting & Prevention (100.0%), and Food Preparation & Serving (96.8%), while the most female-oriented occupations are Personal Care & Service (100.0%), Healthcare Support (69.4%), and Cleaning & Maintenance (25.0%).
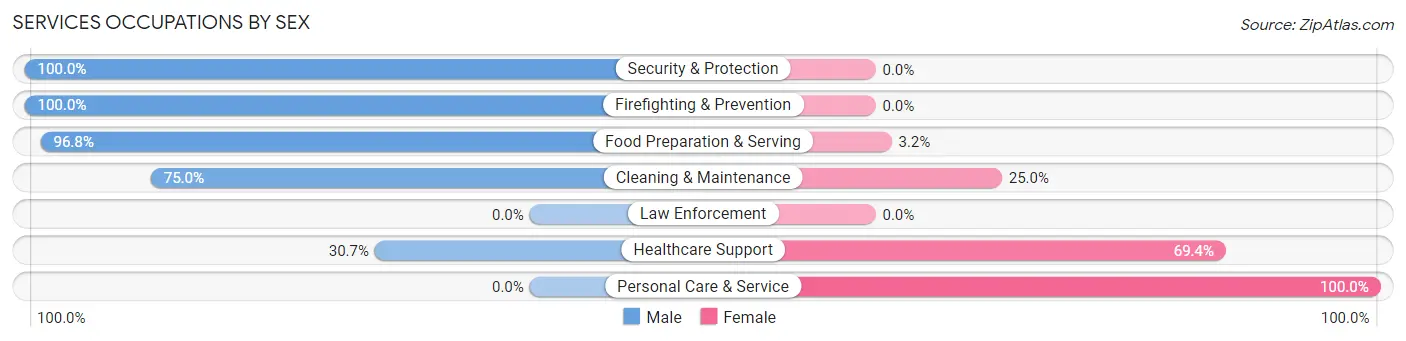
| Occupation | Male | Female |
| Healthcare Support | 19 (30.6%) | 43 (69.4%) |
| Security & Protection | 41 (100.0%) | 0 (0.0%) |
| Firefighting & Prevention | 41 (100.0%) | 0 (0.0%) |
| Law Enforcement | 0 (0.0%) | 0 (0.0%) |
| Food Preparation & Serving | 153 (96.8%) | 5 (3.2%) |
| Cleaning & Maintenance | 39 (75.0%) | 13 (25.0%) |
| Personal Care & Service | 0 (0.0%) | 171 (100.0%) |
| Total (Category) | 252 (52.1%) | 232 (47.9%) |
| Total (Overall) | 1,507 (55.3%) | 1,216 (44.7%) |
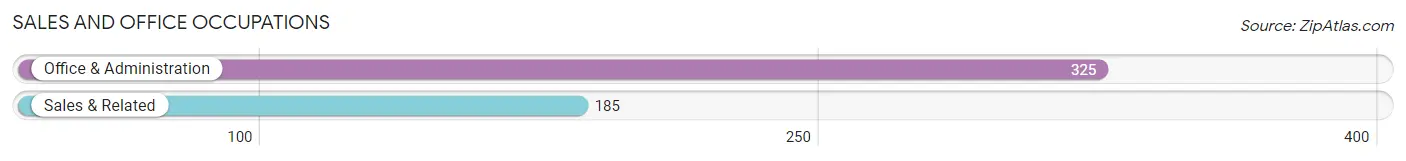
Sales and Office Occupations
The most common Sales and Office occupations in Bristol are Office & Administration (325 | 11.9%), and Sales & Related (185 | 6.8%).
Sales and Office Occupations by Sex
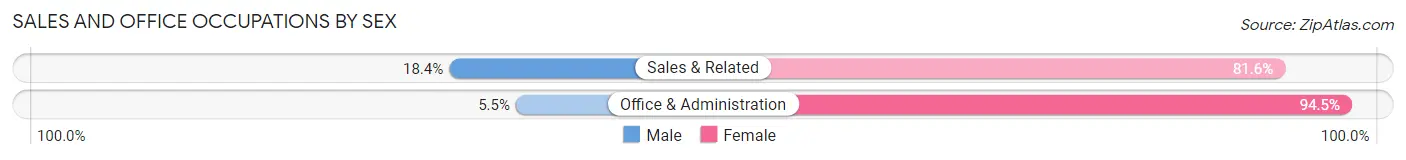
| Occupation | Male | Female |
| Sales & Related | 34 (18.4%) | 151 (81.6%) |
| Office & Administration | 18 (5.5%) | 307 (94.5%) |
| Total (Category) | 52 (10.2%) | 458 (89.8%) |
| Total (Overall) | 1,507 (55.3%) | 1,216 (44.7%) |
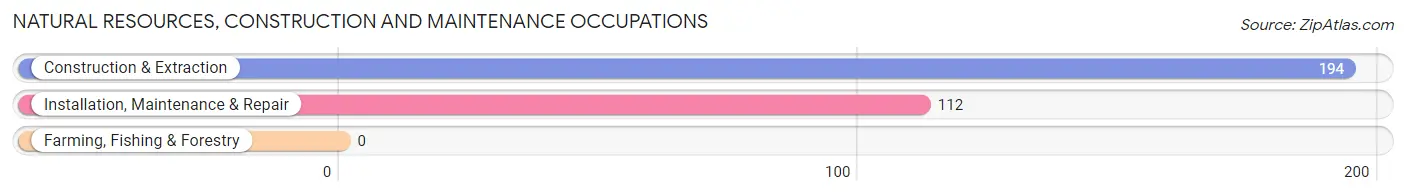
Natural Resources, Construction and Maintenance Occupations
The most common Natural Resources, Construction and Maintenance occupations in Bristol are Construction & Extraction (194 | 7.1%), and Installation, Maintenance & Repair (112 | 4.1%).
Natural Resources, Construction and Maintenance Occupations by Sex
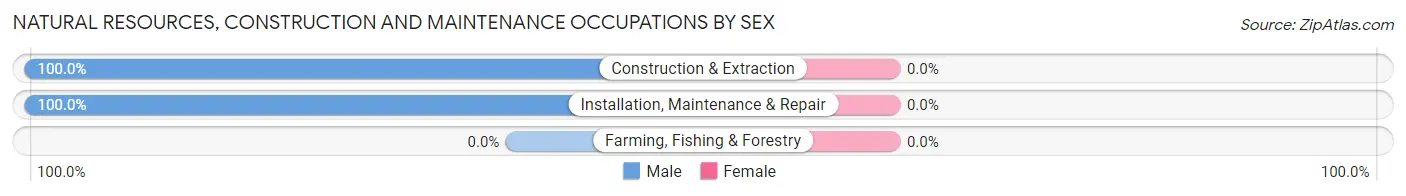
| Occupation | Male | Female |
| Farming, Fishing & Forestry | 0 (0.0%) | 0 (0.0%) |
| Construction & Extraction | 194 (100.0%) | 0 (0.0%) |
| Installation, Maintenance & Repair | 112 (100.0%) | 0 (0.0%) |
| Total (Category) | 306 (100.0%) | 0 (0.0%) |
| Total (Overall) | 1,507 (55.3%) | 1,216 (44.7%) |
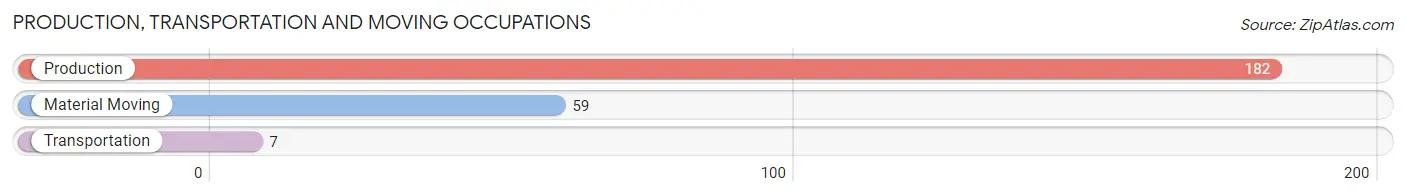
Production, Transportation and Moving Occupations
The most common Production, Transportation and Moving occupations in Bristol are Production (182 | 6.7%), Material Moving (59 | 2.2%), and Transportation (7 | 0.3%).
Production, Transportation and Moving Occupations by Sex
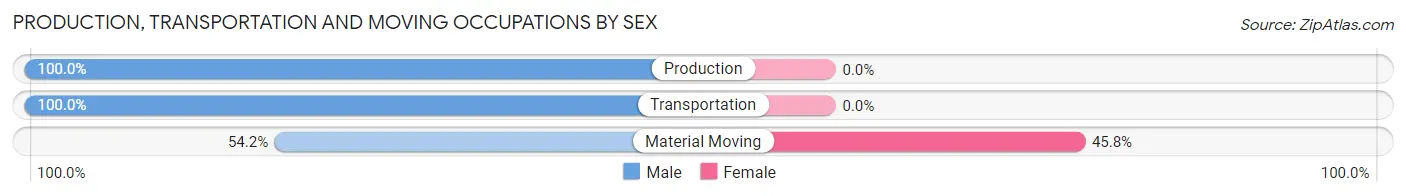
| Occupation | Male | Female |
| Production | 182 (100.0%) | 0 (0.0%) |
| Transportation | 7 (100.0%) | 0 (0.0%) |
| Material Moving | 32 (54.2%) | 27 (45.8%) |
| Total (Category) | 221 (89.1%) | 27 (10.9%) |
| Total (Overall) | 1,507 (55.3%) | 1,216 (44.7%) |
Employment Industries by Sex in Bristol
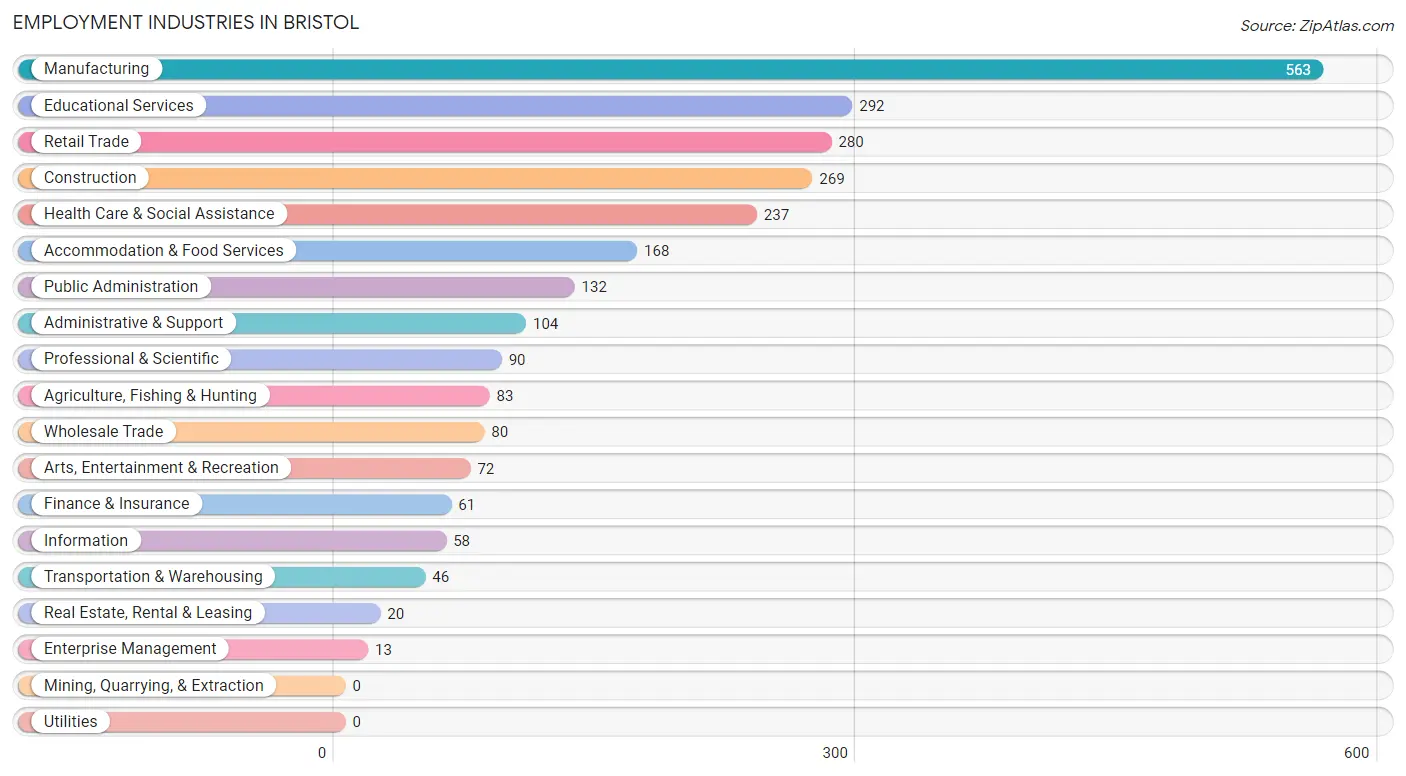
Employment Industries in Bristol
The major employment industries in Bristol include Manufacturing (563 | 20.7%), Educational Services (292 | 10.7%), Retail Trade (280 | 10.3%), Construction (269 | 9.9%), and Health Care & Social Assistance (237 | 8.7%).
Employment Industries by Sex in Bristol
The Bristol industries that see more men than women are Agriculture, Fishing & Hunting (100.0%), Construction (100.0%), and Real Estate, Rental & Leasing (100.0%), whereas the industries that tend to have a higher number of women are Enterprise Management (100.0%), Health Care & Social Assistance (77.6%), and Retail Trade (71.4%).
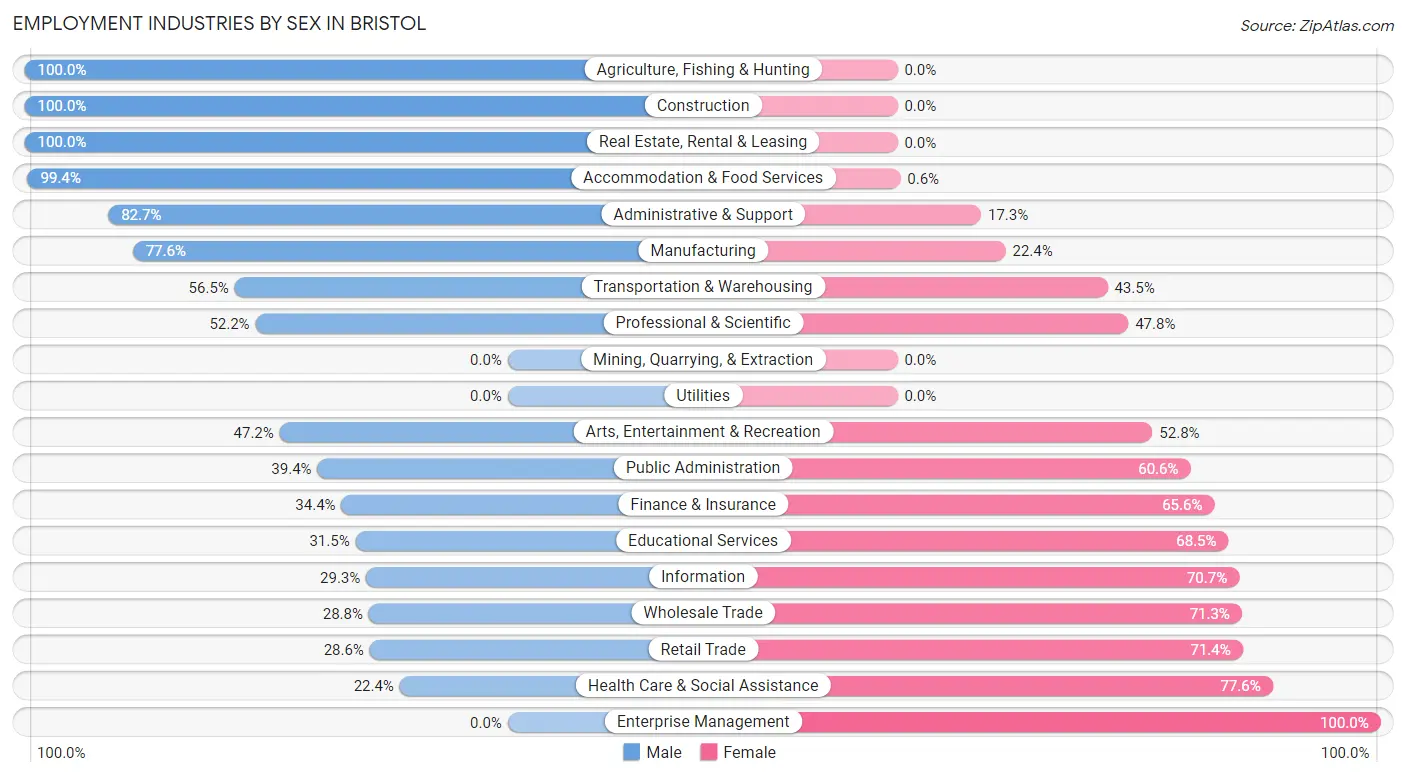
| Industry | Male | Female |
| Agriculture, Fishing & Hunting | 83 (100.0%) | 0 (0.0%) |
| Mining, Quarrying, & Extraction | 0 (0.0%) | 0 (0.0%) |
| Construction | 269 (100.0%) | 0 (0.0%) |
| Manufacturing | 437 (77.6%) | 126 (22.4%) |
| Wholesale Trade | 23 (28.7%) | 57 (71.3%) |
| Retail Trade | 80 (28.6%) | 200 (71.4%) |
| Transportation & Warehousing | 26 (56.5%) | 20 (43.5%) |
| Utilities | 0 (0.0%) | 0 (0.0%) |
| Information | 17 (29.3%) | 41 (70.7%) |
| Finance & Insurance | 21 (34.4%) | 40 (65.6%) |
| Real Estate, Rental & Leasing | 20 (100.0%) | 0 (0.0%) |
| Professional & Scientific | 47 (52.2%) | 43 (47.8%) |
| Enterprise Management | 0 (0.0%) | 13 (100.0%) |
| Administrative & Support | 86 (82.7%) | 18 (17.3%) |
| Educational Services | 92 (31.5%) | 200 (68.5%) |
| Health Care & Social Assistance | 53 (22.4%) | 184 (77.6%) |
| Arts, Entertainment & Recreation | 34 (47.2%) | 38 (52.8%) |
| Accommodation & Food Services | 167 (99.4%) | 1 (0.6%) |
| Public Administration | 52 (39.4%) | 80 (60.6%) |
| Total | 1,507 (55.3%) | 1,216 (44.7%) |
Education in Bristol
School Enrollment in Bristol
The most common levels of schooling among the 1,280 students in Bristol are high school (379 | 29.6%), middle school (361 | 28.2%), and college / undergraduate (291 | 22.7%).
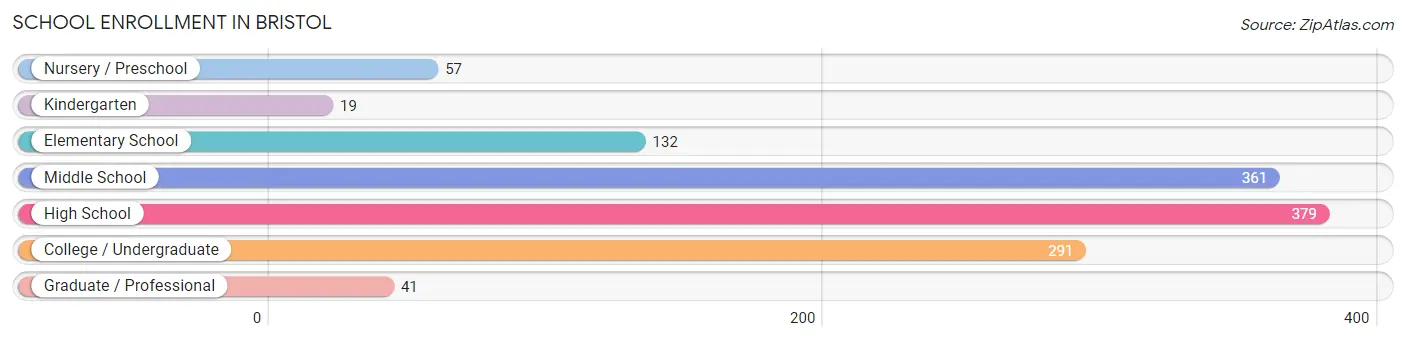
| School Level | # Students | % Students |
| Nursery / Preschool | 57 | 4.4% |
| Kindergarten | 19 | 1.5% |
| Elementary School | 132 | 10.3% |
| Middle School | 361 | 28.2% |
| High School | 379 | 29.6% |
| College / Undergraduate | 291 | 22.7% |
| Graduate / Professional | 41 | 3.2% |
| Total | 1,280 | 100.0% |
School Enrollment by Age by Funding Source in Bristol
Out of a total of 1,280 students who are enrolled in schools in Bristol, 179 (14.0%) attend a private institution, while the remaining 1,101 (86.0%) are enrolled in public schools. The age group of 35 years and over has the highest likelihood of being enrolled in private schools, with 18 (100.0% in the age bracket) enrolled. Conversely, the age group of 5 to 9 year old has the lowest likelihood of being enrolled in a private school, with 166 (100.0% in the age bracket) attending a public institution.
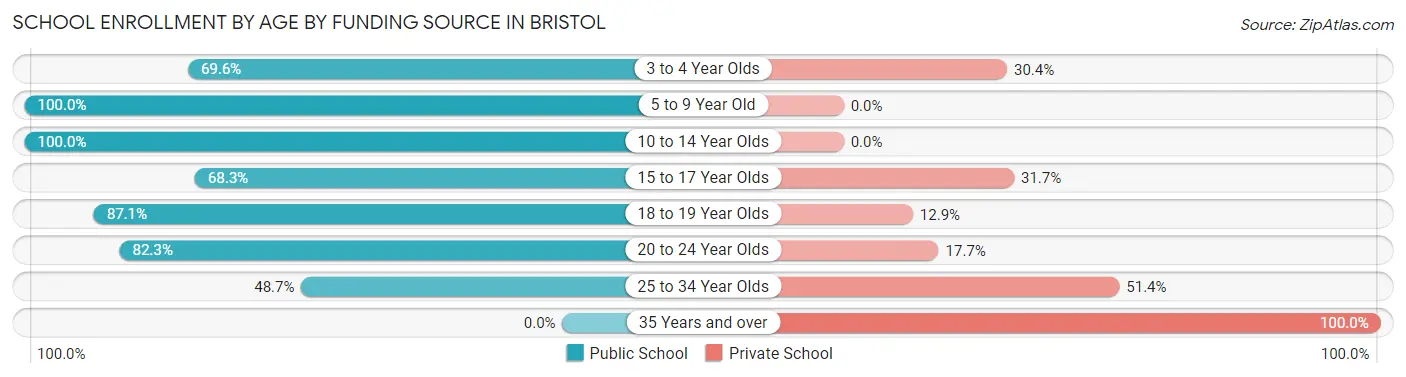
| Age Bracket | Public School | Private School |
| 3 to 4 Year Olds | 16 (69.6%) | 7 (30.4%) |
| 5 to 9 Year Old | 166 (100.0%) | 0 (0.0%) |
| 10 to 14 Year Olds | 396 (100.0%) | 0 (0.0%) |
| 15 to 17 Year Olds | 142 (68.3%) | 66 (31.7%) |
| 18 to 19 Year Olds | 135 (87.1%) | 20 (12.9%) |
| 20 to 24 Year Olds | 228 (82.3%) | 49 (17.7%) |
| 25 to 34 Year Olds | 18 (48.6%) | 19 (51.3%) |
| 35 Years and over | 0 (0.0%) | 18 (100.0%) |
| Total | 1,101 (86.0%) | 179 (14.0%) |
Educational Attainment by Field of Study in Bristol
Business (274 | 22.4%), education (205 | 16.8%), social sciences (117 | 9.6%), science & technology (107 | 8.7%), and arts & humanities (97 | 7.9%) are the most common fields of study among 1,223 individuals in Bristol who have obtained a bachelor's degree or higher.
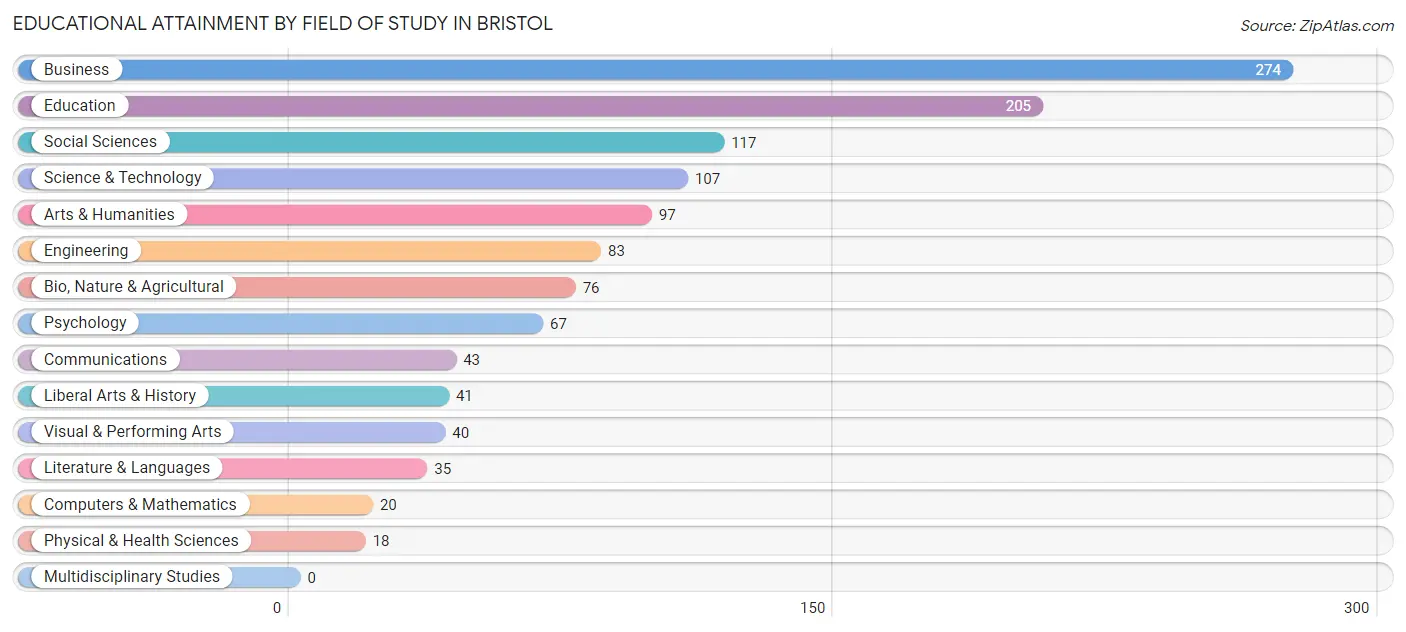
| Field of Study | # Graduates | % Graduates |
| Computers & Mathematics | 20 | 1.6% |
| Bio, Nature & Agricultural | 76 | 6.2% |
| Physical & Health Sciences | 18 | 1.5% |
| Psychology | 67 | 5.5% |
| Social Sciences | 117 | 9.6% |
| Engineering | 83 | 6.8% |
| Multidisciplinary Studies | 0 | 0.0% |
| Science & Technology | 107 | 8.7% |
| Business | 274 | 22.4% |
| Education | 205 | 16.8% |
| Literature & Languages | 35 | 2.9% |
| Liberal Arts & History | 41 | 3.4% |
| Visual & Performing Arts | 40 | 3.3% |
| Communications | 43 | 3.5% |
| Arts & Humanities | 97 | 7.9% |
| Total | 1,223 | 100.0% |
Transportation & Commute in Bristol
Vehicle Availability by Sex in Bristol
The most prevalent vehicle ownership categories in Bristol are males with 2 vehicles (623, accounting for 41.8%) and females with 2 vehicles (556, making up 51.2%).
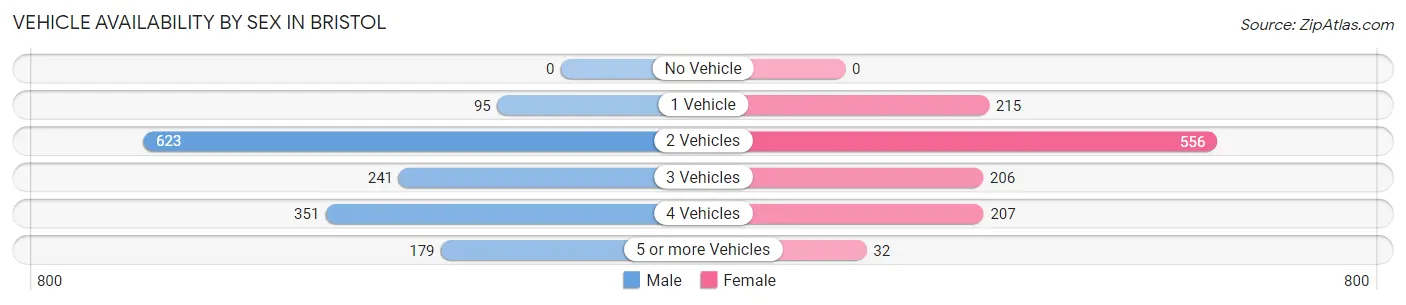
| Vehicles Available | Male | Female |
| No Vehicle | 0 (0.0%) | 0 (0.0%) |
| 1 Vehicle | 95 (6.4%) | 215 (17.7%) |
| 2 Vehicles | 623 (41.8%) | 556 (45.7%) |
| 3 Vehicles | 241 (16.2%) | 206 (16.9%) |
| 4 Vehicles | 351 (23.6%) | 207 (17.0%) |
| 5 or more Vehicles | 179 (12.0%) | 32 (2.6%) |
| Total | 1,489 (100.0%) | 1,216 (100.0%) |
Commute Time in Bristol
The most frequently occuring commute durations in Bristol are 20 to 24 minutes (426 commuters, 17.1%), 45 to 59 minutes (385 commuters, 15.5%), and 30 to 34 minutes (366 commuters, 14.7%).
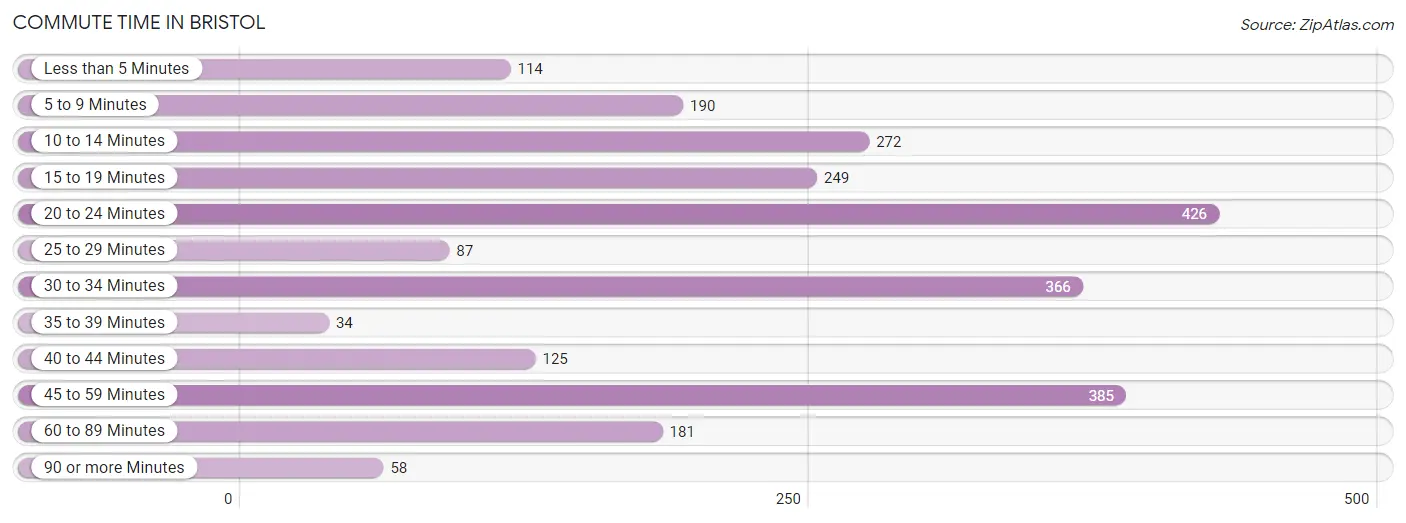
| Commute Time | # Commuters | % Commuters |
| Less than 5 Minutes | 114 | 4.6% |
| 5 to 9 Minutes | 190 | 7.6% |
| 10 to 14 Minutes | 272 | 10.9% |
| 15 to 19 Minutes | 249 | 10.0% |
| 20 to 24 Minutes | 426 | 17.1% |
| 25 to 29 Minutes | 87 | 3.5% |
| 30 to 34 Minutes | 366 | 14.7% |
| 35 to 39 Minutes | 34 | 1.4% |
| 40 to 44 Minutes | 125 | 5.0% |
| 45 to 59 Minutes | 385 | 15.5% |
| 60 to 89 Minutes | 181 | 7.3% |
| 90 or more Minutes | 58 | 2.3% |
Commute Time by Sex in Bristol
The most common commute times in Bristol are 45 to 59 minutes (280 commuters, 20.6%) for males and 20 to 24 minutes (275 commuters, 24.4%) for females.
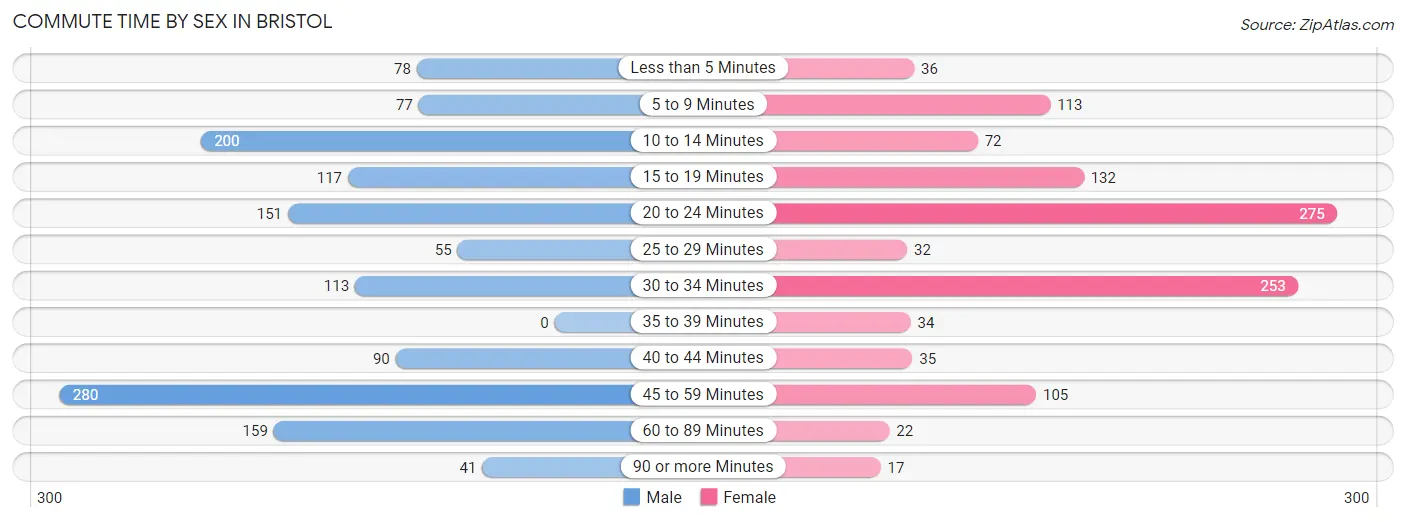
| Commute Time | Male | Female |
| Less than 5 Minutes | 78 (5.7%) | 36 (3.2%) |
| 5 to 9 Minutes | 77 (5.7%) | 113 (10.0%) |
| 10 to 14 Minutes | 200 (14.7%) | 72 (6.4%) |
| 15 to 19 Minutes | 117 (8.6%) | 132 (11.7%) |
| 20 to 24 Minutes | 151 (11.1%) | 275 (24.4%) |
| 25 to 29 Minutes | 55 (4.0%) | 32 (2.8%) |
| 30 to 34 Minutes | 113 (8.3%) | 253 (22.5%) |
| 35 to 39 Minutes | 0 (0.0%) | 34 (3.0%) |
| 40 to 44 Minutes | 90 (6.6%) | 35 (3.1%) |
| 45 to 59 Minutes | 280 (20.6%) | 105 (9.3%) |
| 60 to 89 Minutes | 159 (11.7%) | 22 (1.9%) |
| 90 or more Minutes | 41 (3.0%) | 17 (1.5%) |
Time of Departure to Work by Sex in Bristol
The most frequent times of departure to work in Bristol are 12:00 AM to 4:59 AM (243, 17.8%) for males and 12:00 PM to 3:59 PM (232, 20.6%) for females.
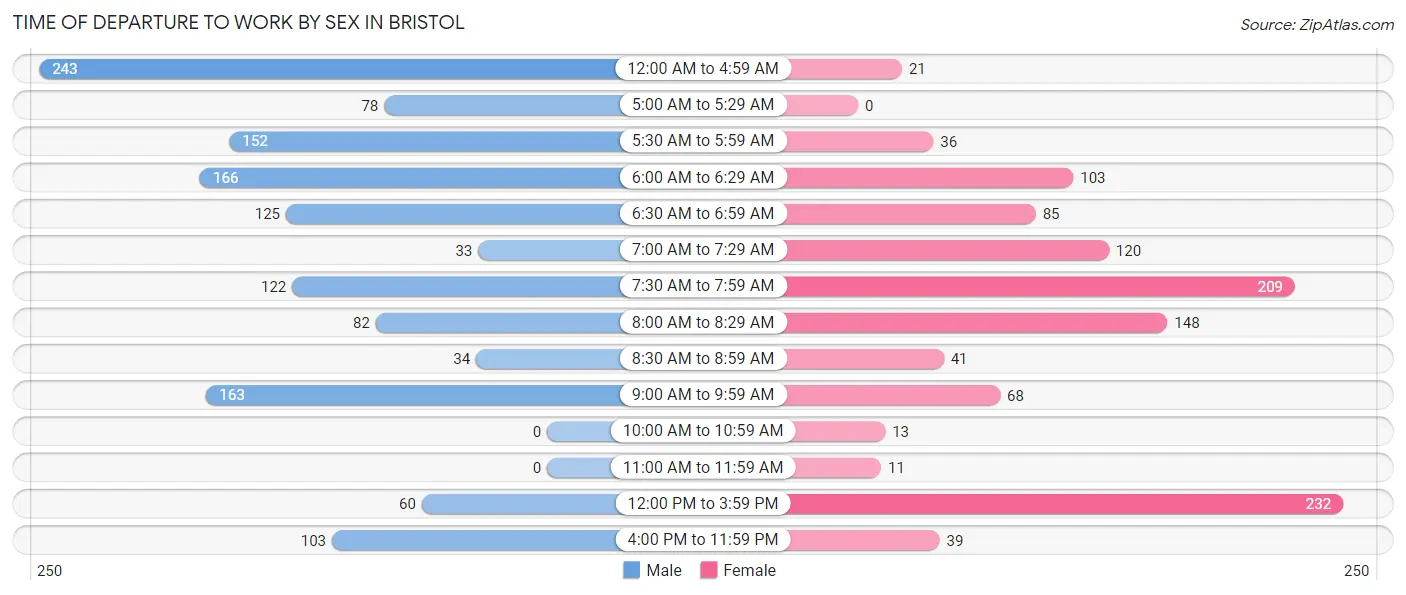
| Time of Departure | Male | Female |
| 12:00 AM to 4:59 AM | 243 (17.8%) | 21 (1.9%) |
| 5:00 AM to 5:29 AM | 78 (5.7%) | 0 (0.0%) |
| 5:30 AM to 5:59 AM | 152 (11.2%) | 36 (3.2%) |
| 6:00 AM to 6:29 AM | 166 (12.2%) | 103 (9.1%) |
| 6:30 AM to 6:59 AM | 125 (9.2%) | 85 (7.5%) |
| 7:00 AM to 7:29 AM | 33 (2.4%) | 120 (10.7%) |
| 7:30 AM to 7:59 AM | 122 (9.0%) | 209 (18.6%) |
| 8:00 AM to 8:29 AM | 82 (6.0%) | 148 (13.1%) |
| 8:30 AM to 8:59 AM | 34 (2.5%) | 41 (3.6%) |
| 9:00 AM to 9:59 AM | 163 (12.0%) | 68 (6.0%) |
| 10:00 AM to 10:59 AM | 0 (0.0%) | 13 (1.1%) |
| 11:00 AM to 11:59 AM | 0 (0.0%) | 11 (1.0%) |
| 12:00 PM to 3:59 PM | 60 (4.4%) | 232 (20.6%) |
| 4:00 PM to 11:59 PM | 103 (7.6%) | 39 (3.5%) |
| Total | 1,361 (100.0%) | 1,126 (100.0%) |
Housing Occupancy in Bristol
Occupancy by Ownership in Bristol
Of the total 2,009 dwellings in Bristol, owner-occupied units account for 1,703 (84.8%), while renter-occupied units make up 306 (15.2%).
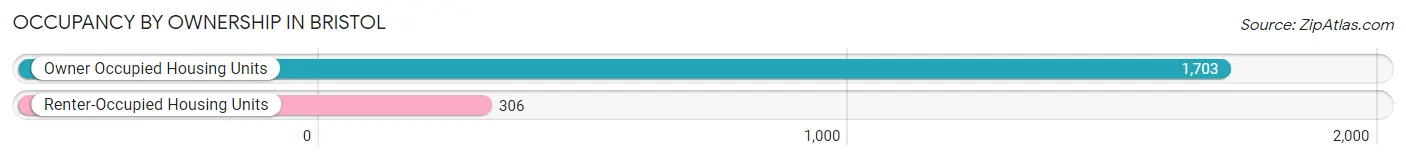
| Occupancy | # Housing Units | % Housing Units |
| Owner Occupied Housing Units | 1,703 | 84.8% |
| Renter-Occupied Housing Units | 306 | 15.2% |
| Total Occupied Housing Units | 2,009 | 100.0% |
Occupancy by Household Size in Bristol
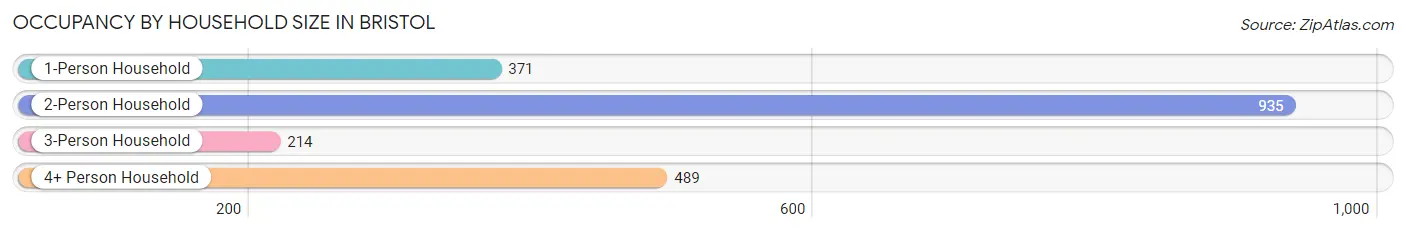
| Household Size | # Housing Units | % Housing Units |
| 1-Person Household | 371 | 18.5% |
| 2-Person Household | 935 | 46.5% |
| 3-Person Household | 214 | 10.6% |
| 4+ Person Household | 489 | 24.3% |
| Total Housing Units | 2,009 | 100.0% |
Occupancy by Ownership by Household Size in Bristol
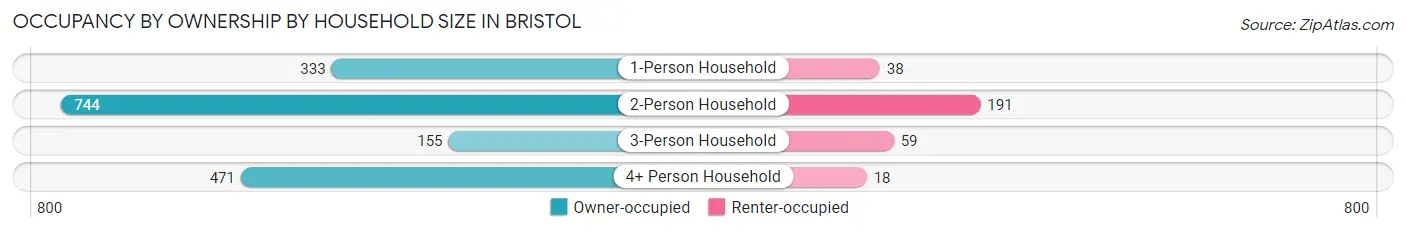
| Household Size | Owner-occupied | Renter-occupied |
| 1-Person Household | 333 (89.8%) | 38 (10.2%) |
| 2-Person Household | 744 (79.6%) | 191 (20.4%) |
| 3-Person Household | 155 (72.4%) | 59 (27.6%) |
| 4+ Person Household | 471 (96.3%) | 18 (3.7%) |
| Total Housing Units | 1,703 (84.8%) | 306 (15.2%) |
Occupancy by Educational Attainment in Bristol
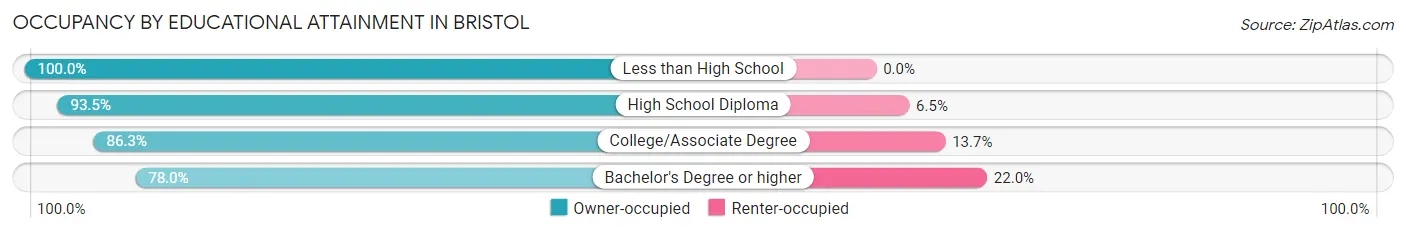
| Household Size | Owner-occupied | Renter-occupied |
| Less than High School | 14 (100.0%) | 0 (0.0%) |
| High School Diploma | 343 (93.5%) | 24 (6.5%) |
| College/Associate Degree | 788 (86.3%) | 125 (13.7%) |
| Bachelor's Degree or higher | 558 (78.0%) | 157 (22.0%) |
Occupancy by Age of Householder in Bristol
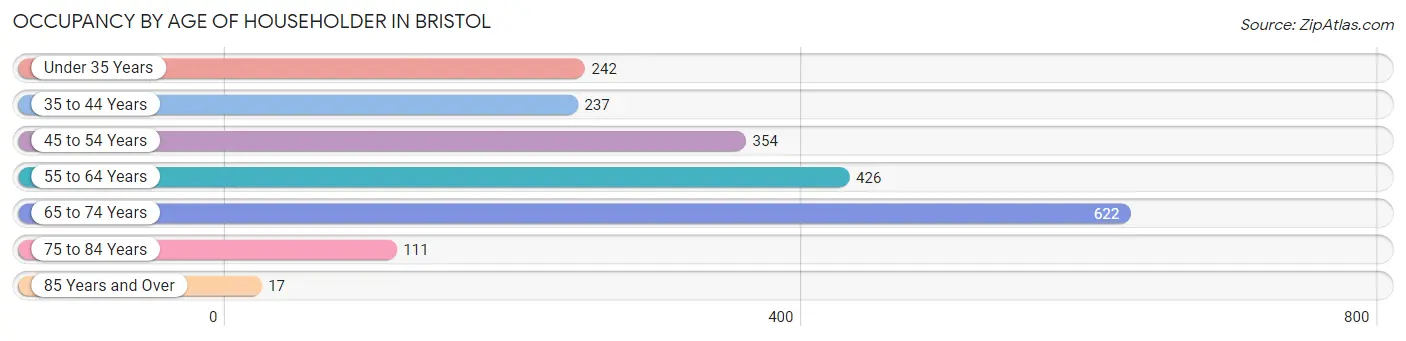
| Age Bracket | # Households | % Households |
| Under 35 Years | 242 | 12.0% |
| 35 to 44 Years | 237 | 11.8% |
| 45 to 54 Years | 354 | 17.6% |
| 55 to 64 Years | 426 | 21.2% |
| 65 to 74 Years | 622 | 31.0% |
| 75 to 84 Years | 111 | 5.5% |
| 85 Years and Over | 17 | 0.9% |
| Total | 2,009 | 100.0% |
Housing Finances in Bristol
Median Income by Occupancy in Bristol
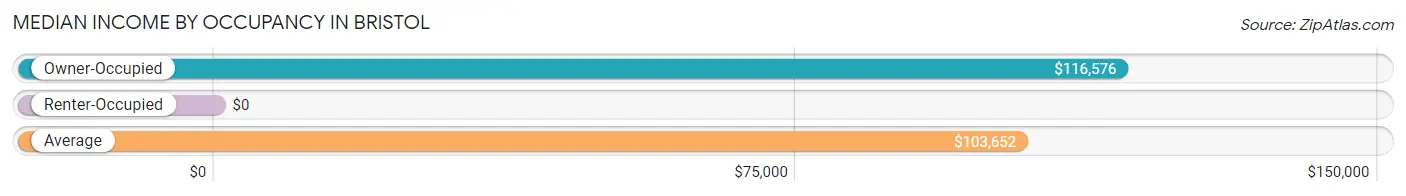
| Occupancy Type | # Households | Median Income |
| Owner-Occupied | 1,703 (84.8%) | $116,576 |
| Renter-Occupied | 306 (15.2%) | $0 |
| Average | 2,009 (100.0%) | $103,652 |
Occupancy by Householder Income Bracket in Bristol
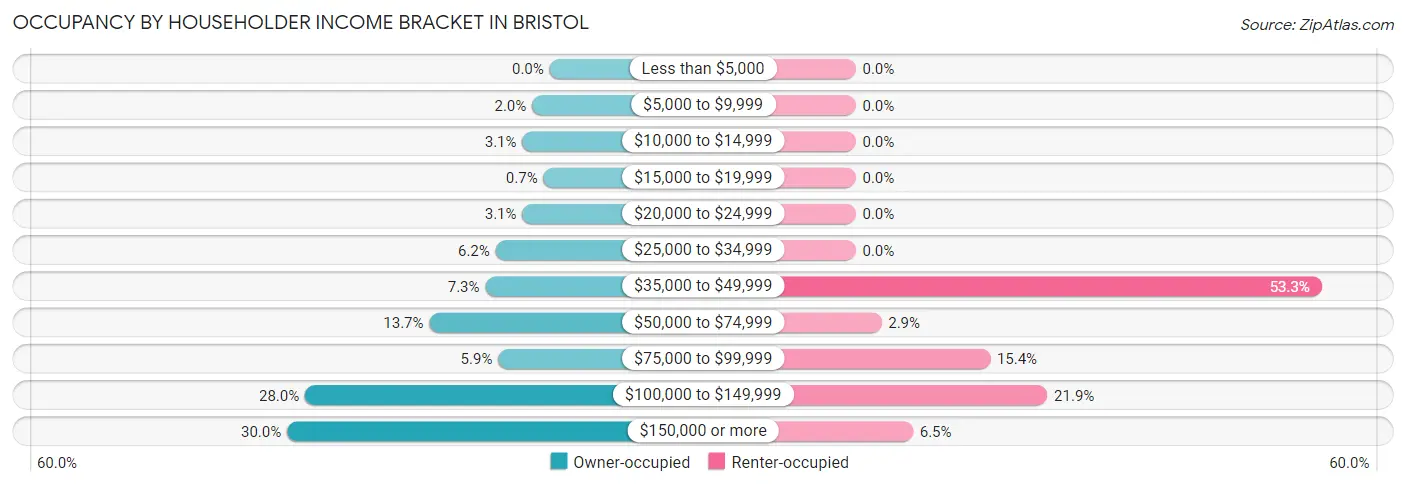
| Income Bracket | Owner-occupied | Renter-occupied |
| Less than $5,000 | 0 (0.0%) | 0 (0.0%) |
| $5,000 to $9,999 | 34 (2.0%) | 0 (0.0%) |
| $10,000 to $14,999 | 53 (3.1%) | 0 (0.0%) |
| $15,000 to $19,999 | 12 (0.7%) | 0 (0.0%) |
| $20,000 to $24,999 | 53 (3.1%) | 0 (0.0%) |
| $25,000 to $34,999 | 105 (6.2%) | 0 (0.0%) |
| $35,000 to $49,999 | 125 (7.3%) | 163 (53.3%) |
| $50,000 to $74,999 | 234 (13.7%) | 9 (2.9%) |
| $75,000 to $99,999 | 100 (5.9%) | 47 (15.4%) |
| $100,000 to $149,999 | 476 (28.0%) | 67 (21.9%) |
| $150,000 or more | 511 (30.0%) | 20 (6.5%) |
| Total | 1,703 (100.0%) | 306 (100.0%) |
Monthly Housing Cost Tiers in Bristol
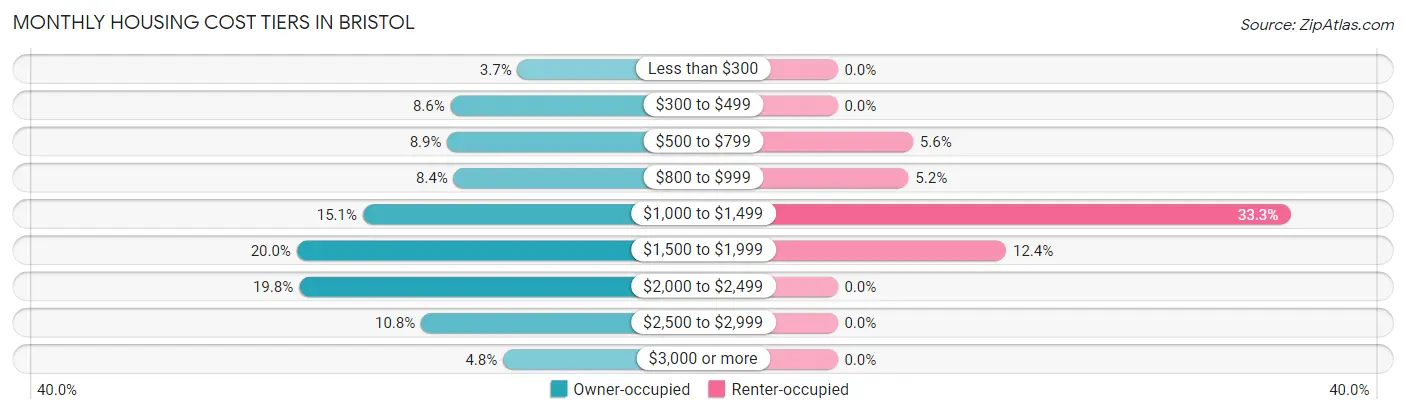
| Monthly Cost | Owner-occupied | Renter-occupied |
| Less than $300 | 63 (3.7%) | 0 (0.0%) |
| $300 to $499 | 147 (8.6%) | 0 (0.0%) |
| $500 to $799 | 151 (8.9%) | 17 (5.6%) |
| $800 to $999 | 143 (8.4%) | 16 (5.2%) |
| $1,000 to $1,499 | 257 (15.1%) | 102 (33.3%) |
| $1,500 to $1,999 | 340 (20.0%) | 38 (12.4%) |
| $2,000 to $2,499 | 337 (19.8%) | 0 (0.0%) |
| $2,500 to $2,999 | 184 (10.8%) | 0 (0.0%) |
| $3,000 or more | 81 (4.8%) | 0 (0.0%) |
| Total | 1,703 (100.0%) | 306 (100.0%) |
Physical Housing Characteristics in Bristol
Housing Structures in Bristol
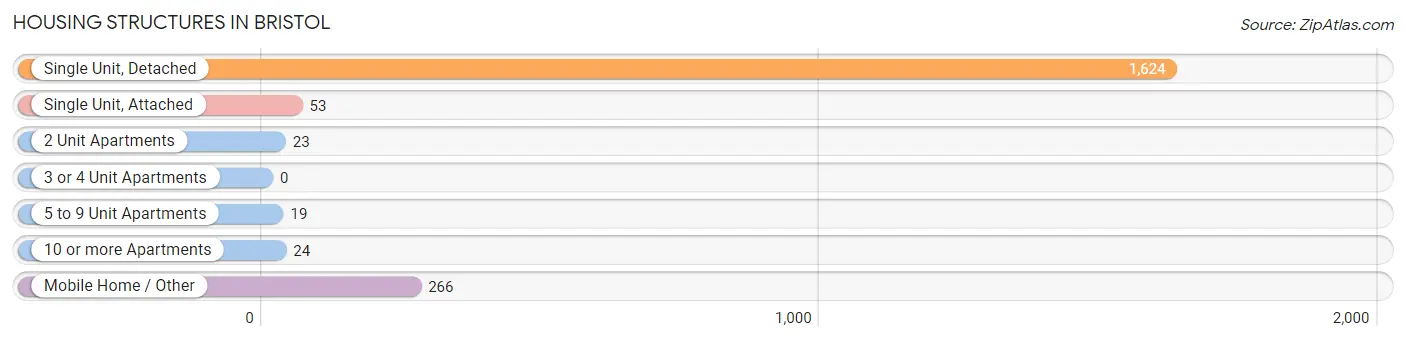
| Structure Type | # Housing Units | % Housing Units |
| Single Unit, Detached | 1,624 | 80.8% |
| Single Unit, Attached | 53 | 2.6% |
| 2 Unit Apartments | 23 | 1.1% |
| 3 or 4 Unit Apartments | 0 | 0.0% |
| 5 to 9 Unit Apartments | 19 | 0.9% |
| 10 or more Apartments | 24 | 1.2% |
| Mobile Home / Other | 266 | 13.2% |
| Total | 2,009 | 100.0% |
Housing Structures by Occupancy in Bristol
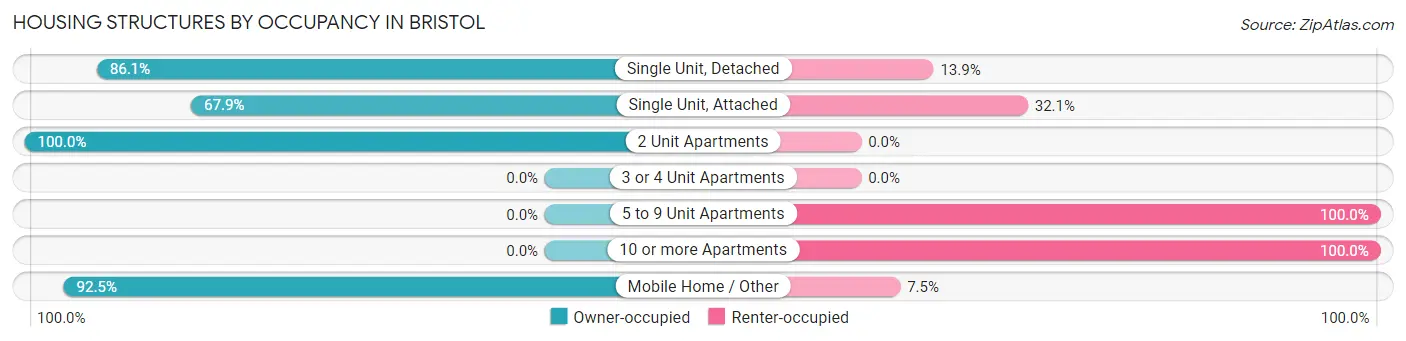
| Structure Type | Owner-occupied | Renter-occupied |
| Single Unit, Detached | 1,398 (86.1%) | 226 (13.9%) |
| Single Unit, Attached | 36 (67.9%) | 17 (32.1%) |
| 2 Unit Apartments | 23 (100.0%) | 0 (0.0%) |
| 3 or 4 Unit Apartments | 0 (0.0%) | 0 (0.0%) |
| 5 to 9 Unit Apartments | 0 (0.0%) | 19 (100.0%) |
| 10 or more Apartments | 0 (0.0%) | 24 (100.0%) |
| Mobile Home / Other | 246 (92.5%) | 20 (7.5%) |
| Total | 1,703 (84.8%) | 306 (15.2%) |
Housing Structures by Number of Rooms in Bristol
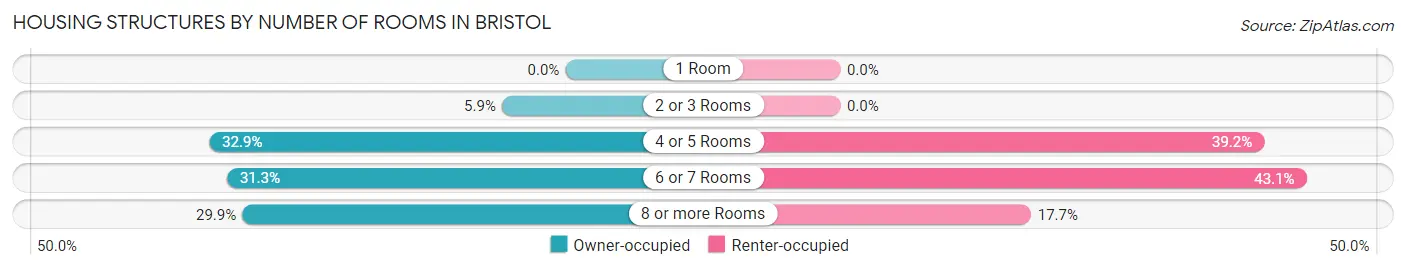
| Number of Rooms | Owner-occupied | Renter-occupied |
| 1 Room | 0 (0.0%) | 0 (0.0%) |
| 2 or 3 Rooms | 100 (5.9%) | 0 (0.0%) |
| 4 or 5 Rooms | 561 (32.9%) | 120 (39.2%) |
| 6 or 7 Rooms | 533 (31.3%) | 132 (43.1%) |
| 8 or more Rooms | 509 (29.9%) | 54 (17.6%) |
| Total | 1,703 (100.0%) | 306 (100.0%) |
Housing Structure by Heating Type in Bristol
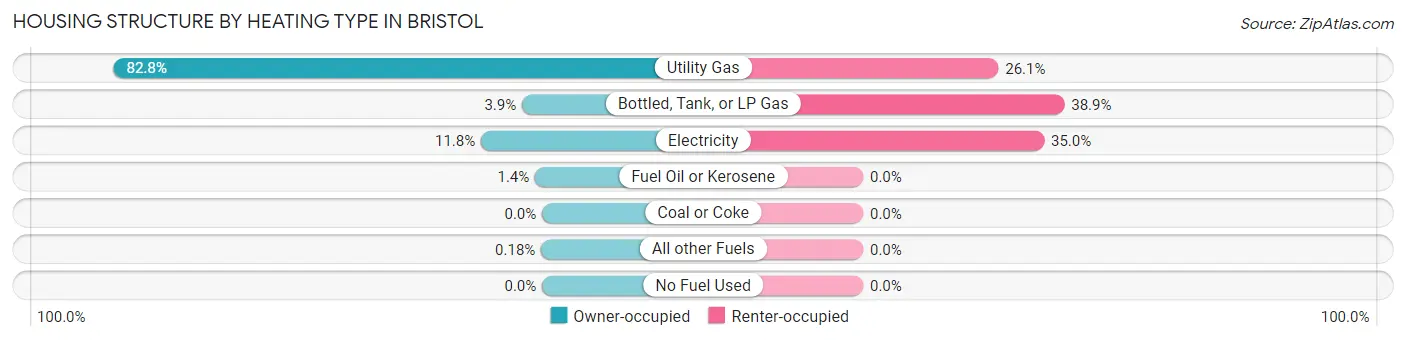
| Heating Type | Owner-occupied | Renter-occupied |
| Utility Gas | 1,410 (82.8%) | 80 (26.1%) |
| Bottled, Tank, or LP Gas | 66 (3.9%) | 119 (38.9%) |
| Electricity | 201 (11.8%) | 107 (35.0%) |
| Fuel Oil or Kerosene | 23 (1.3%) | 0 (0.0%) |
| Coal or Coke | 0 (0.0%) | 0 (0.0%) |
| All other Fuels | 3 (0.2%) | 0 (0.0%) |
| No Fuel Used | 0 (0.0%) | 0 (0.0%) |
| Total | 1,703 (100.0%) | 306 (100.0%) |
Household Vehicle Usage in Bristol
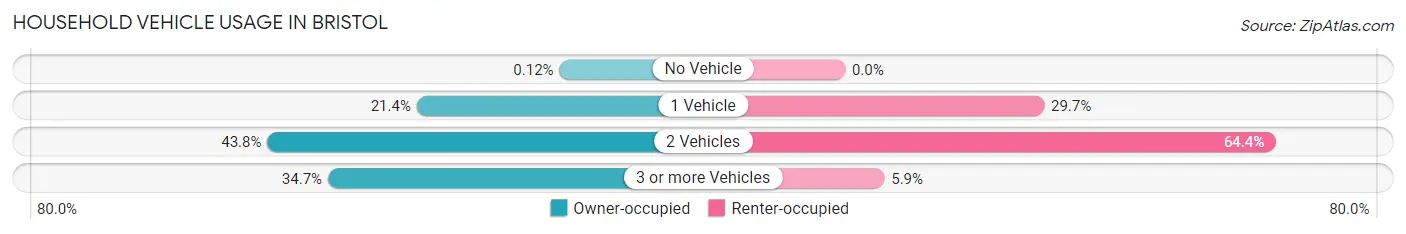
| Vehicles per Household | Owner-occupied | Renter-occupied |
| No Vehicle | 2 (0.1%) | 0 (0.0%) |
| 1 Vehicle | 365 (21.4%) | 91 (29.7%) |
| 2 Vehicles | 745 (43.8%) | 197 (64.4%) |
| 3 or more Vehicles | 591 (34.7%) | 18 (5.9%) |
| Total | 1,703 (100.0%) | 306 (100.0%) |
Real Estate & Mortgages in Bristol
Real Estate and Mortgage Overview in Bristol
| Characteristic | Without Mortgage | With Mortgage |
| Housing Units | 645 | 1,058 |
| Median Property Value | $269,600 | $322,600 |
| Median Household Income | $75,417 | $308 |
| Monthly Housing Costs | $695 | $81 |
| Real Estate Taxes | $3,814 | $0 |
Property Value by Mortgage Status in Bristol
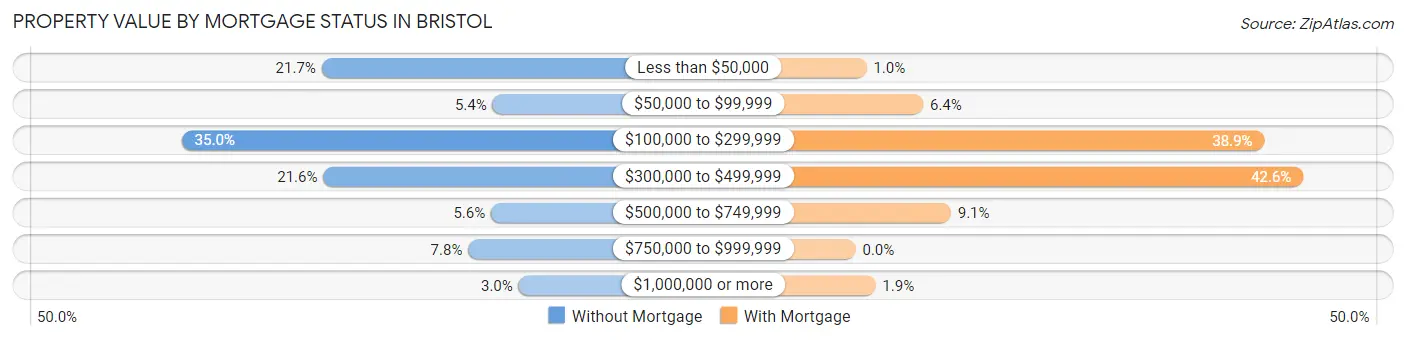
| Property Value | Without Mortgage | With Mortgage |
| Less than $50,000 | 140 (21.7%) | 11 (1.0%) |
| $50,000 to $99,999 | 35 (5.4%) | 68 (6.4%) |
| $100,000 to $299,999 | 226 (35.0%) | 412 (38.9%) |
| $300,000 to $499,999 | 139 (21.5%) | 451 (42.6%) |
| $500,000 to $749,999 | 36 (5.6%) | 96 (9.1%) |
| $750,000 to $999,999 | 50 (7.7%) | 0 (0.0%) |
| $1,000,000 or more | 19 (2.9%) | 20 (1.9%) |
| Total | 645 (100.0%) | 1,058 (100.0%) |
Household Income by Mortgage Status in Bristol
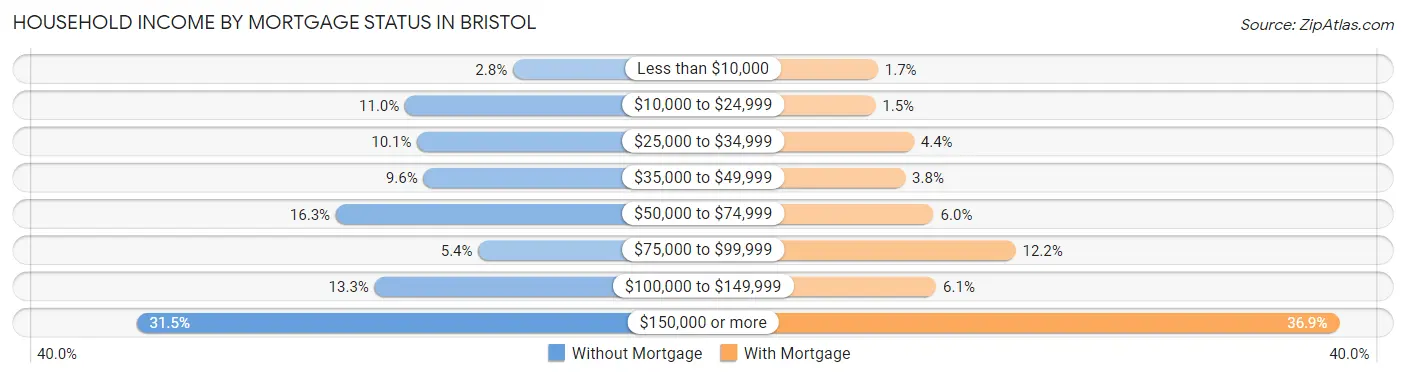
| Household Income | Without Mortgage | With Mortgage |
| Less than $10,000 | 18 (2.8%) | 18 (1.7%) |
| $10,000 to $24,999 | 71 (11.0%) | 16 (1.5%) |
| $25,000 to $34,999 | 65 (10.1%) | 47 (4.4%) |
| $35,000 to $49,999 | 62 (9.6%) | 40 (3.8%) |
| $50,000 to $74,999 | 105 (16.3%) | 63 (5.9%) |
| $75,000 to $99,999 | 35 (5.4%) | 129 (12.2%) |
| $100,000 to $149,999 | 86 (13.3%) | 65 (6.1%) |
| $150,000 or more | 203 (31.5%) | 390 (36.9%) |
| Total | 645 (100.0%) | 1,058 (100.0%) |
Property Value to Household Income Ratio in Bristol
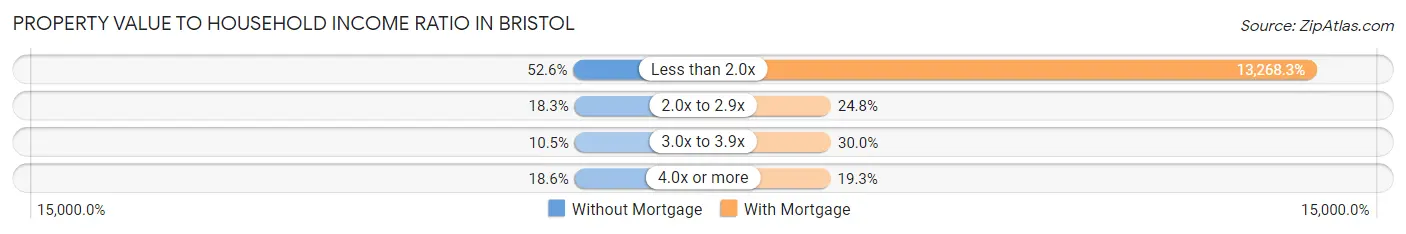
| Value-to-Income Ratio | Without Mortgage | With Mortgage |
| Less than 2.0x | 339 (52.6%) | 140,379 (13,268.3%) |
| 2.0x to 2.9x | 118 (18.3%) | 262 (24.8%) |
| 3.0x to 3.9x | 68 (10.5%) | 317 (30.0%) |
| 4.0x or more | 120 (18.6%) | 204 (19.3%) |
| Total | 645 (100.0%) | 1,058 (100.0%) |
Real Estate Taxes by Mortgage Status in Bristol
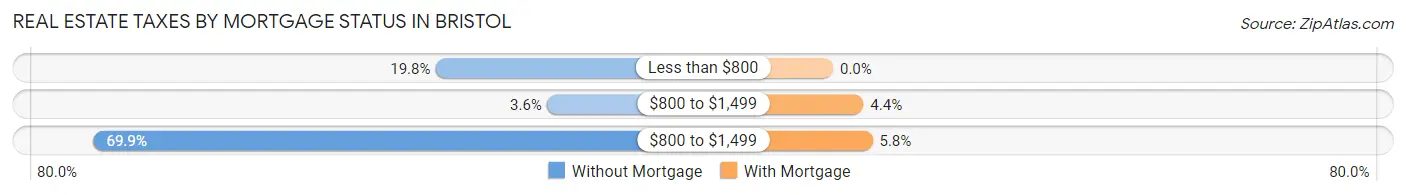
| Property Taxes | Without Mortgage | With Mortgage |
| Less than $800 | 128 (19.8%) | 0 (0.0%) |
| $800 to $1,499 | 23 (3.6%) | 47 (4.4%) |
| $800 to $1,499 | 451 (69.9%) | 61 (5.8%) |
| Total | 645 (100.0%) | 1,058 (100.0%) |
Health & Disability in Bristol
Health Insurance Coverage by Age in Bristol
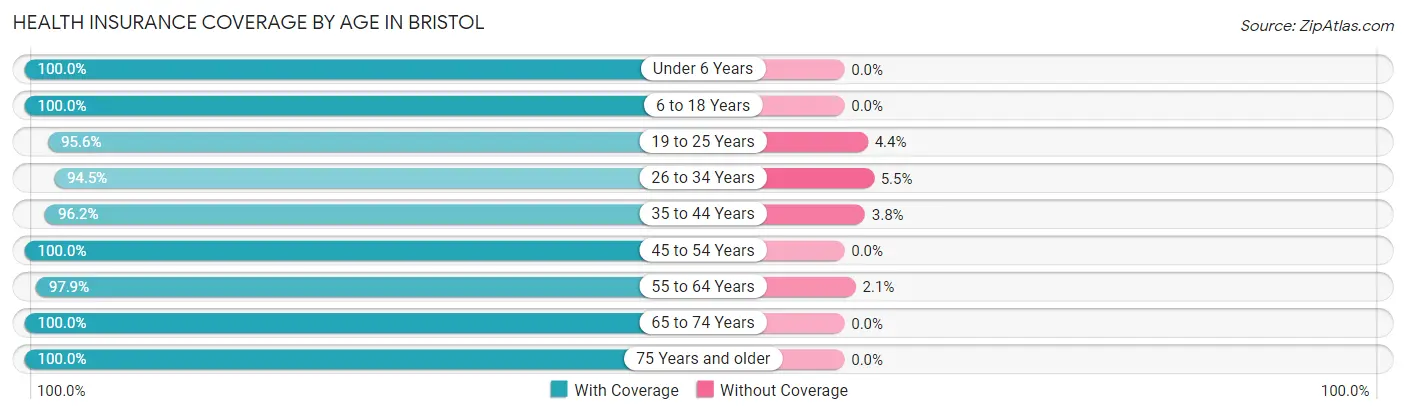
| Age Bracket | With Coverage | Without Coverage |
| Under 6 Years | 277 (100.0%) | 0 (0.0%) |
| 6 to 18 Years | 947 (100.0%) | 0 (0.0%) |
| 19 to 25 Years | 438 (95.6%) | 20 (4.4%) |
| 26 to 34 Years | 276 (94.5%) | 16 (5.5%) |
| 35 to 44 Years | 527 (96.2%) | 21 (3.8%) |
| 45 to 54 Years | 727 (100.0%) | 0 (0.0%) |
| 55 to 64 Years | 834 (97.9%) | 18 (2.1%) |
| 65 to 74 Years | 815 (100.0%) | 0 (0.0%) |
| 75 Years and older | 253 (100.0%) | 0 (0.0%) |
| Total | 5,094 (98.6%) | 75 (1.5%) |
Health Insurance Coverage by Citizenship Status in Bristol
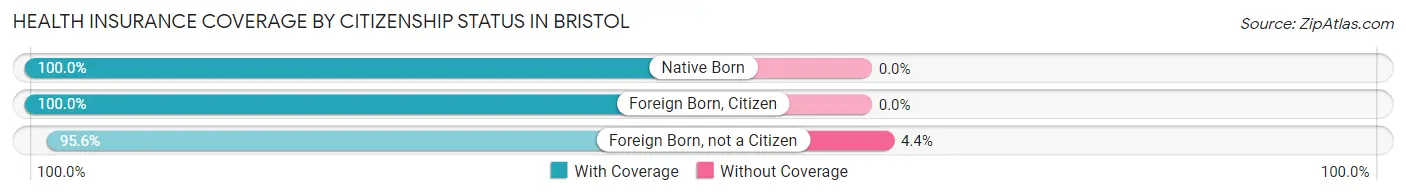
| Citizenship Status | With Coverage | Without Coverage |
| Native Born | 277 (100.0%) | 0 (0.0%) |
| Foreign Born, Citizen | 947 (100.0%) | 0 (0.0%) |
| Foreign Born, not a Citizen | 438 (95.6%) | 20 (4.4%) |
Health Insurance Coverage by Household Income in Bristol
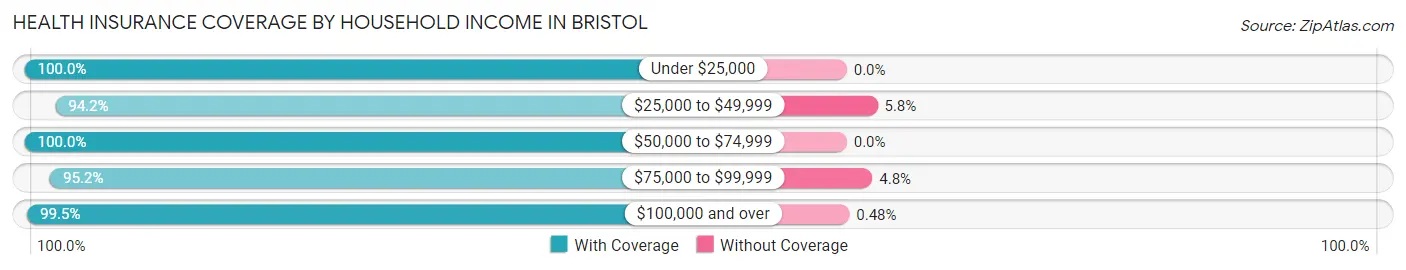
| Household Income | With Coverage | Without Coverage |
| Under $25,000 | 246 (100.0%) | 0 (0.0%) |
| $25,000 to $49,999 | 638 (94.2%) | 39 (5.8%) |
| $50,000 to $74,999 | 477 (100.0%) | 0 (0.0%) |
| $75,000 to $99,999 | 398 (95.2%) | 20 (4.8%) |
| $100,000 and over | 3,334 (99.5%) | 16 (0.5%) |
Public vs Private Health Insurance Coverage by Age in Bristol
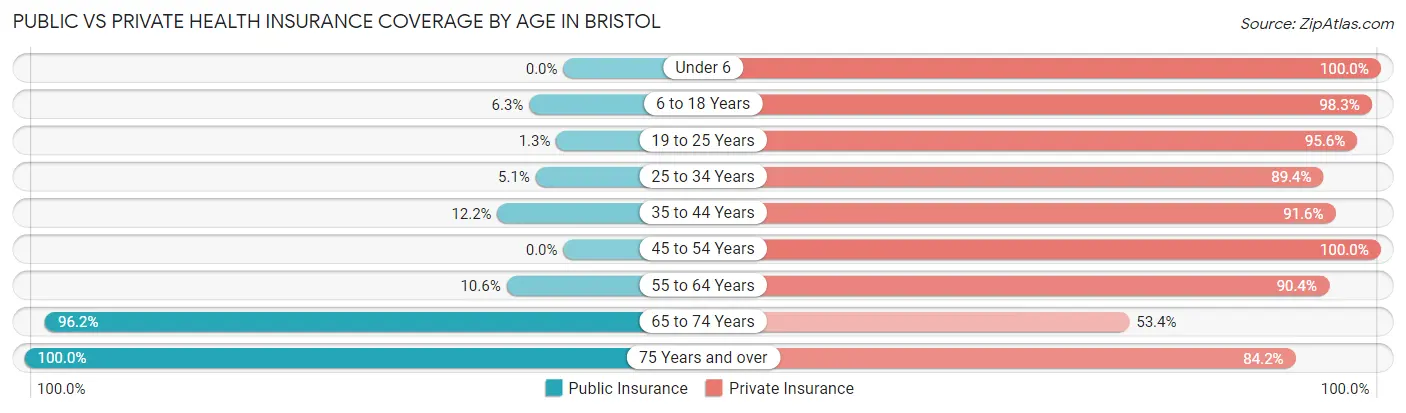
| Age Bracket | Public Insurance | Private Insurance |
| Under 6 | 0 (0.0%) | 277 (100.0%) |
| 6 to 18 Years | 60 (6.3%) | 931 (98.3%) |
| 19 to 25 Years | 6 (1.3%) | 438 (95.6%) |
| 25 to 34 Years | 15 (5.1%) | 261 (89.4%) |
| 35 to 44 Years | 67 (12.2%) | 502 (91.6%) |
| 45 to 54 Years | 0 (0.0%) | 727 (100.0%) |
| 55 to 64 Years | 90 (10.6%) | 770 (90.4%) |
| 65 to 74 Years | 784 (96.2%) | 435 (53.4%) |
| 75 Years and over | 253 (100.0%) | 213 (84.2%) |
| Total | 1,275 (24.7%) | 4,554 (88.1%) |
Disability Status by Sex by Age in Bristol
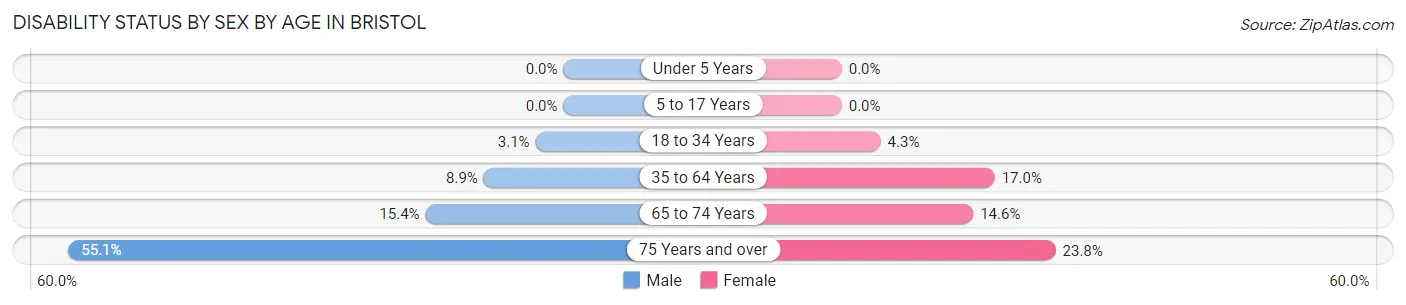
| Age Bracket | Male | Female |
| Under 5 Years | 0 (0.0%) | 0 (0.0%) |
| 5 to 17 Years | 0 (0.0%) | 0 (0.0%) |
| 18 to 34 Years | 20 (3.1%) | 13 (4.3%) |
| 35 to 64 Years | 98 (8.9%) | 174 (17.0%) |
| 65 to 74 Years | 57 (15.4%) | 65 (14.6%) |
| 75 Years and over | 70 (55.1%) | 30 (23.8%) |
Disability Class by Sex by Age in Bristol
Disability Class: Hearing Difficulty
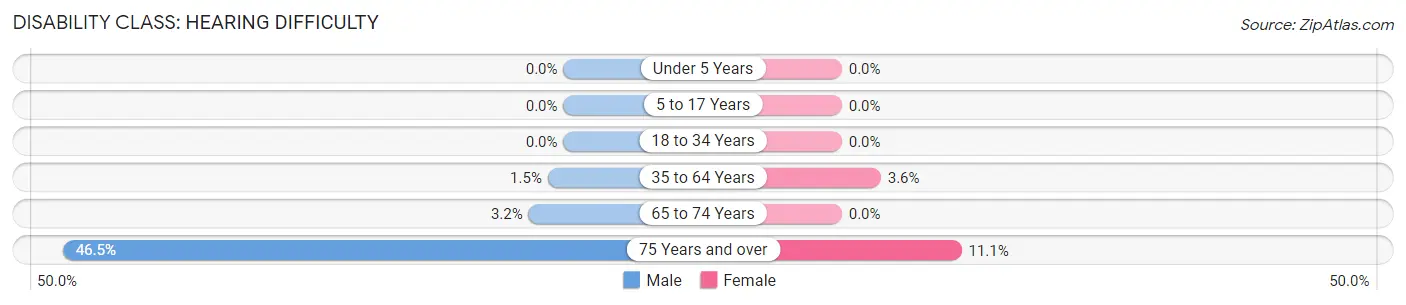
| Age Bracket | Male | Female |
| Under 5 Years | 0 (0.0%) | 0 (0.0%) |
| 5 to 17 Years | 0 (0.0%) | 0 (0.0%) |
| 18 to 34 Years | 0 (0.0%) | 0 (0.0%) |
| 35 to 64 Years | 16 (1.5%) | 37 (3.6%) |
| 65 to 74 Years | 12 (3.2%) | 0 (0.0%) |
| 75 Years and over | 59 (46.5%) | 14 (11.1%) |
Disability Class: Vision Difficulty
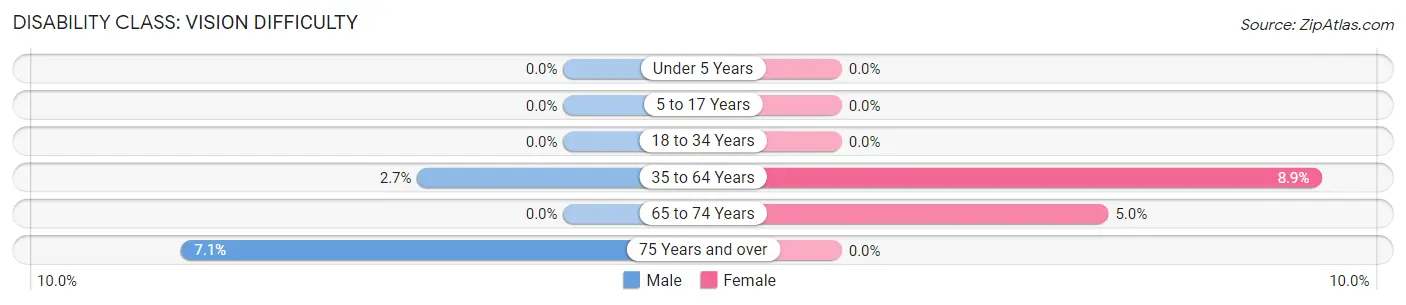
| Age Bracket | Male | Female |
| Under 5 Years | 0 (0.0%) | 0 (0.0%) |
| 5 to 17 Years | 0 (0.0%) | 0 (0.0%) |
| 18 to 34 Years | 0 (0.0%) | 0 (0.0%) |
| 35 to 64 Years | 30 (2.7%) | 91 (8.9%) |
| 65 to 74 Years | 0 (0.0%) | 22 (5.0%) |
| 75 Years and over | 9 (7.1%) | 0 (0.0%) |
Disability Class: Cognitive Difficulty
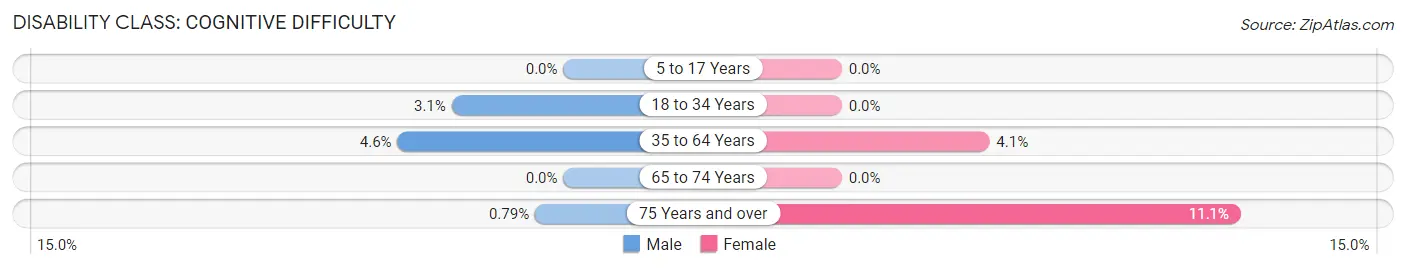
| Age Bracket | Male | Female |
| 5 to 17 Years | 0 (0.0%) | 0 (0.0%) |
| 18 to 34 Years | 20 (3.1%) | 0 (0.0%) |
| 35 to 64 Years | 51 (4.6%) | 42 (4.1%) |
| 65 to 74 Years | 0 (0.0%) | 0 (0.0%) |
| 75 Years and over | 1 (0.8%) | 14 (11.1%) |
Disability Class: Ambulatory Difficulty
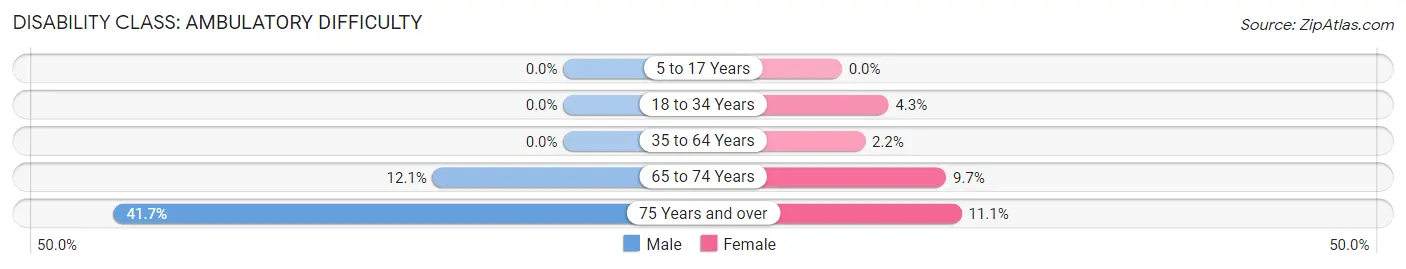
| Age Bracket | Male | Female |
| 5 to 17 Years | 0 (0.0%) | 0 (0.0%) |
| 18 to 34 Years | 0 (0.0%) | 13 (4.3%) |
| 35 to 64 Years | 0 (0.0%) | 22 (2.1%) |
| 65 to 74 Years | 45 (12.1%) | 43 (9.7%) |
| 75 Years and over | 53 (41.7%) | 14 (11.1%) |
Disability Class: Self-Care Difficulty
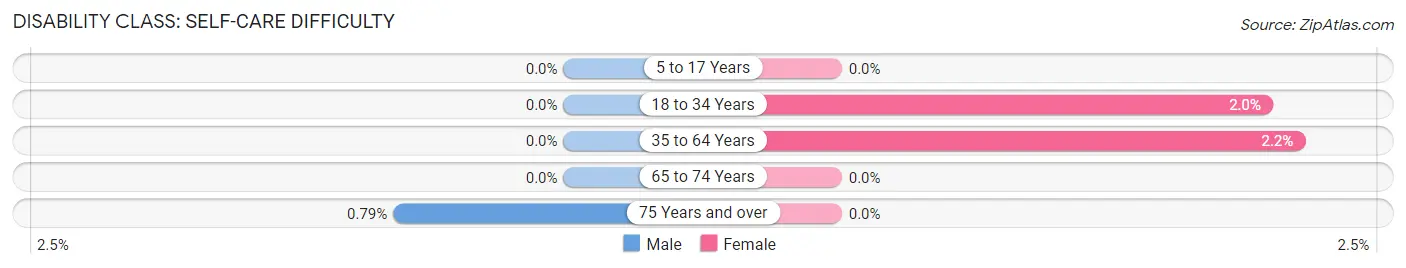
| Age Bracket | Male | Female |
| 5 to 17 Years | 0 (0.0%) | 0 (0.0%) |
| 18 to 34 Years | 0 (0.0%) | 6 (2.0%) |
| 35 to 64 Years | 0 (0.0%) | 22 (2.1%) |
| 65 to 74 Years | 0 (0.0%) | 0 (0.0%) |
| 75 Years and over | 1 (0.8%) | 0 (0.0%) |
Technology Access in Bristol
Computing Device Access in Bristol
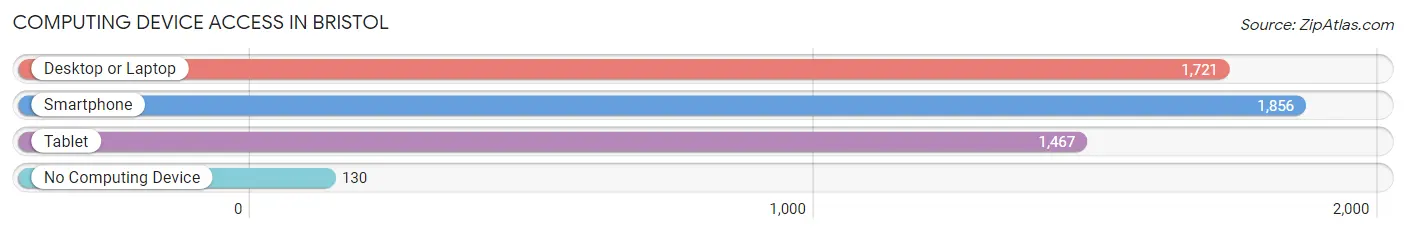
| Device Type | # Households | % Households |
| Desktop or Laptop | 1,721 | 85.7% |
| Smartphone | 1,856 | 92.4% |
| Tablet | 1,467 | 73.0% |
| No Computing Device | 130 | 6.5% |
| Total | 2,009 | 100.0% |
Internet Access in Bristol
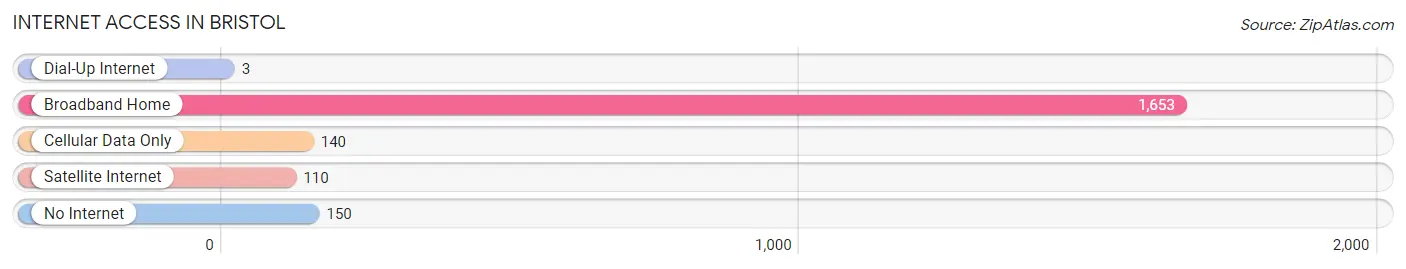
| Internet Type | # Households | % Households |
| Dial-Up Internet | 3 | 0.2% |
| Broadband Home | 1,653 | 82.3% |
| Cellular Data Only | 140 | 7.0% |
| Satellite Internet | 110 | 5.5% |
| No Internet | 150 | 7.5% |
| Total | 2,009 | 100.0% |
Bristol Summary
Bristol, Wisconsin is a small village located in Kenosha County, Wisconsin. It is situated on the banks of the Fox River, about 25 miles south of Milwaukee. The village has a population of approximately 5,000 people and covers an area of 2.2 square miles.
History
The area that is now Bristol was first settled in the early 1800s by settlers from New England. The first settler was a man named William Bristol, who arrived in 1836. He built a log cabin and began farming the land. The village was officially incorporated in 1846 and was named after William Bristol.
In the late 1800s, the village began to grow and prosper. The Fox River provided a source of power for the local industries, which included a sawmill, a grist mill, and a woolen mill. The village also had a blacksmith shop, a general store, and a post office.
In the early 1900s, the village continued to grow and develop. The Fox River was used to transport goods and supplies to and from the village. The village also had a railroad station, which connected it to the larger cities in the area.
Geography
Bristol is located in southeastern Wisconsin, about 25 miles south of Milwaukee. It is situated on the banks of the Fox River, which flows through the village. The village is surrounded by rolling hills and farmland. The climate is humid continental, with cold winters and hot, humid summers.
Economy
The economy of Bristol is largely based on agriculture and manufacturing. The village is home to several small businesses, including a grocery store, a hardware store, and a restaurant. The village also has a few small industrial parks, which are home to several manufacturing companies.
The village is also home to a few tourist attractions, including the Bristol Historical Society Museum and the Bristol Nature Center. The village also hosts several annual festivals, including the Bristol Summer Festival and the Bristol Fall Festival.
Demographics
As of the 2010 census, the population of Bristol was 5,068. The racial makeup of the village was 94.3% White, 1.2% African American, 0.3% Native American, 0.7% Asian, 0.1% Pacific Islander, 1.7% from other races, and 1.9% from two or more races. Hispanic or Latino of any race were 4.2% of the population.
The median household income in Bristol was $50,945, and the median family income was $60,917. The per capita income for the village was $22,945. About 4.3% of families and 5.7% of the population were below the poverty line, including 6.3% of those under age 18 and 4.2% of those age 65 or over.
Common Questions
What is Per Capita Income in Bristol?
Per Capita income in Bristol is $49,589.
What is the Median Family Income in Bristol?
Median Family Income in Bristol is $135,855.
What is the Median Household income in Bristol?
Median Household Income in Bristol is $103,652.
What is Income or Wage Gap in Bristol?
Income or Wage Gap in Bristol is 36.9%.
Women in Bristol earn 63.1 cents for every dollar earned by a man.
What is Inequality or Gini Index in Bristol?
Inequality or Gini Index in Bristol is 0.43.
What is the Total Population of Bristol?
Total Population of Bristol is 5,169.
What is the Total Male Population of Bristol?
Total Male Population of Bristol is 2,952.
What is the Total Female Population of Bristol?
Total Female Population of Bristol is 2,217.
What is the Ratio of Males per 100 Females in Bristol?
There are 133.15 Males per 100 Females in Bristol.
What is the Ratio of Females per 100 Males in Bristol?
There are 75.10 Females per 100 Males in Bristol.
What is the Median Population Age in Bristol?
Median Population Age in Bristol is 45.8 Years.
What is the Average Family Size in Bristol
Average Family Size in Bristol is 3.0 People.
What is the Average Household Size in Bristol
Average Household Size in Bristol is 2.6 People.
How Large is the Labor Force in Bristol?
There are 2,959 People in the Labor Forcein in Bristol.
What is the Percentage of People in the Labor Force in Bristol?
68.7% of People are in the Labor Force in Bristol.
What is the Unemployment Rate in Bristol?
Unemployment Rate in Bristol is 7.9%.