Fairwater, WI Map & Demographics
Fairwater Map
Fairwater Overview
$30,132
PER CAPITA INCOME
$93,750
AVG FAMILY INCOME
$67,083
AVG HOUSEHOLD INCOME
47.0%
WAGE / INCOME GAP [ % ]
53.0¢/ $1
WAGE / INCOME GAP [ $ ]
0.39
INEQUALITY / GINI INDEX
339
TOTAL POPULATION
187
MALE POPULATION
152
FEMALE POPULATION
123.03
MALES / 100 FEMALES
81.28
FEMALES / 100 MALES
31.5
MEDIAN AGE
3.5
AVG FAMILY SIZE
2.6
AVG HOUSEHOLD SIZE
177
LABOR FORCE [ PEOPLE ]
74.7%
PERCENT IN LABOR FORCE
2.3%
UNEMPLOYMENT RATE
Fairwater Zip Codes
Fairwater Area Codes
Income in Fairwater
Income Overview in Fairwater
Per Capita Income in Fairwater is $30,132, while median incomes of families and households are $93,750 and $67,083 respectively.
| Characteristic | Number | Measure |
| Per Capita Income | 339 | $30,132 |
| Median Family Income | 77 | $93,750 |
| Mean Family Income | 77 | $88,599 |
| Median Household Income | 131 | $67,083 |
| Mean Household Income | 131 | $76,703 |
| Income Deficit | 77 | $0 |
| Wage / Income Gap (%) | 339 | 47.00% |
| Wage / Income Gap ($) | 339 | 53.00¢ per $1 |
| Gini / Inequality Index | 339 | 0.39 |
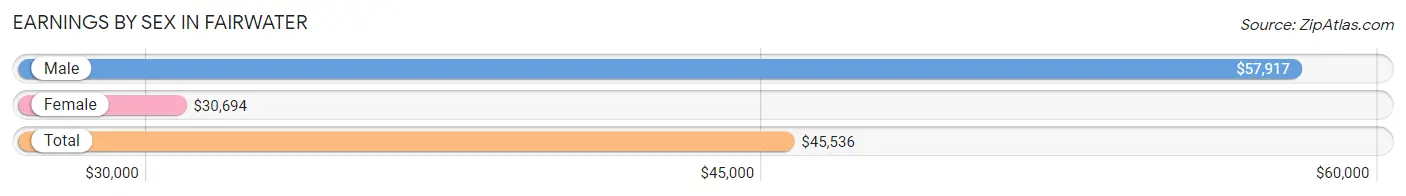
Earnings by Sex in Fairwater
Average Earnings in Fairwater are $45,536, $57,917 for men and $30,694 for women, a difference of 47.0%.
| Sex | Number | Average Earnings |
| Male | 108 (59.0%) | $57,917 |
| Female | 75 (41.0%) | $30,694 |
| Total | 183 (100.0%) | $45,536 |
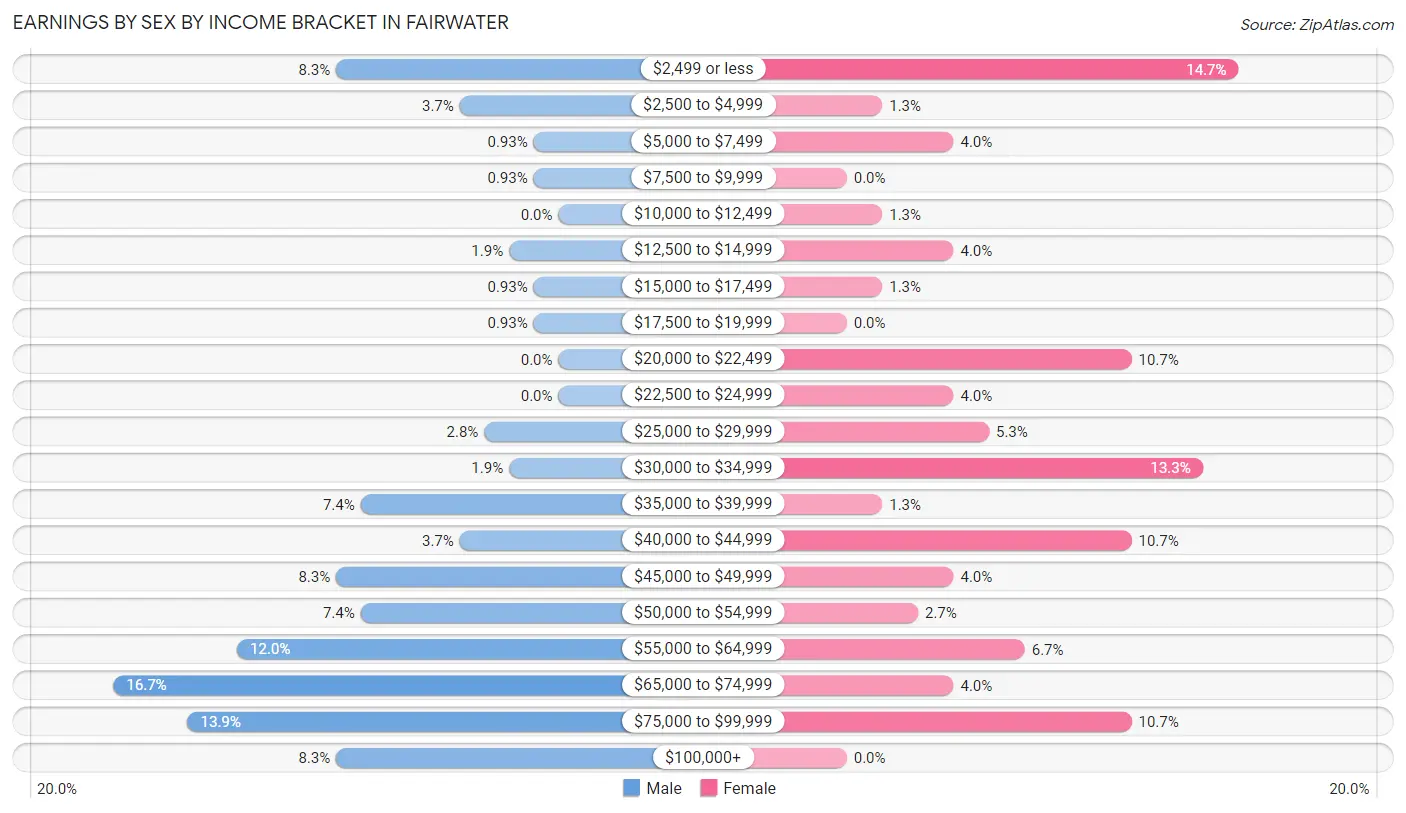
Earnings by Sex by Income Bracket in Fairwater
The most common earnings brackets in Fairwater are $65,000 to $74,999 for men (18 | 16.7%) and $2,499 or less for women (11 | 14.7%).
| Income | Male | Female |
| $2,499 or less | 9 (8.3%) | 11 (14.7%) |
| $2,500 to $4,999 | 4 (3.7%) | 1 (1.3%) |
| $5,000 to $7,499 | 1 (0.9%) | 3 (4.0%) |
| $7,500 to $9,999 | 1 (0.9%) | 0 (0.0%) |
| $10,000 to $12,499 | 0 (0.0%) | 1 (1.3%) |
| $12,500 to $14,999 | 2 (1.8%) | 3 (4.0%) |
| $15,000 to $17,499 | 1 (0.9%) | 1 (1.3%) |
| $17,500 to $19,999 | 1 (0.9%) | 0 (0.0%) |
| $20,000 to $22,499 | 0 (0.0%) | 8 (10.7%) |
| $22,500 to $24,999 | 0 (0.0%) | 3 (4.0%) |
| $25,000 to $29,999 | 3 (2.8%) | 4 (5.3%) |
| $30,000 to $34,999 | 2 (1.8%) | 10 (13.3%) |
| $35,000 to $39,999 | 8 (7.4%) | 1 (1.3%) |
| $40,000 to $44,999 | 4 (3.7%) | 8 (10.7%) |
| $45,000 to $49,999 | 9 (8.3%) | 3 (4.0%) |
| $50,000 to $54,999 | 8 (7.4%) | 2 (2.7%) |
| $55,000 to $64,999 | 13 (12.0%) | 5 (6.7%) |
| $65,000 to $74,999 | 18 (16.7%) | 3 (4.0%) |
| $75,000 to $99,999 | 15 (13.9%) | 8 (10.7%) |
| $100,000+ | 9 (8.3%) | 0 (0.0%) |
| Total | 108 (100.0%) | 75 (100.0%) |
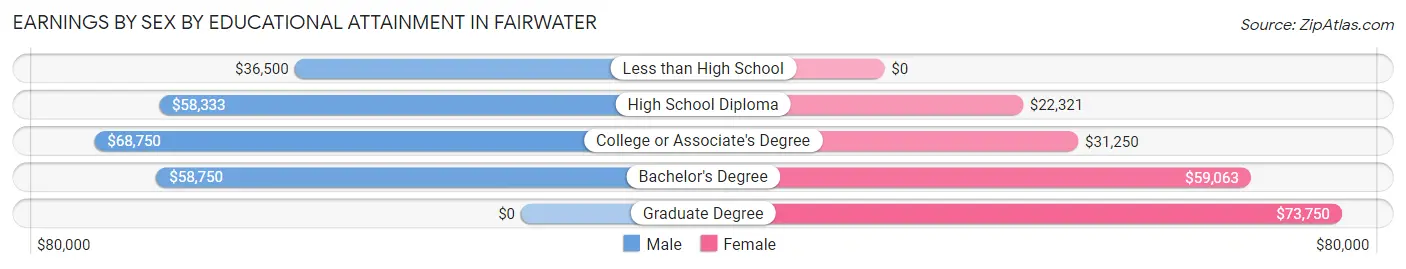
Earnings by Sex by Educational Attainment in Fairwater
Average earnings in Fairwater are $59,792 for men and $31,667 for women, a difference of 47.0%. Men with an educational attainment of college or associate's degree enjoy the highest average annual earnings of $68,750, while those with less than high school education earn the least with $36,500. Women with an educational attainment of graduate degree earn the most with the average annual earnings of $73,750, while those with high school diploma education have the smallest earnings of $22,321.
| Educational Attainment | Male Income | Female Income |
| Less than High School | $36,500 | $0 |
| High School Diploma | $58,333 | $22,321 |
| College or Associate's Degree | $68,750 | $31,250 |
| Bachelor's Degree | $58,750 | $59,063 |
| Graduate Degree | - | - |
| Total | $59,792 | $31,667 |
Family Income in Fairwater
Family Income Brackets in Fairwater
According to the Fairwater family income data, there are 27 families falling into the $100,000 to $149,999 income range, which is the most common income bracket and makes up 35.1% of all families.
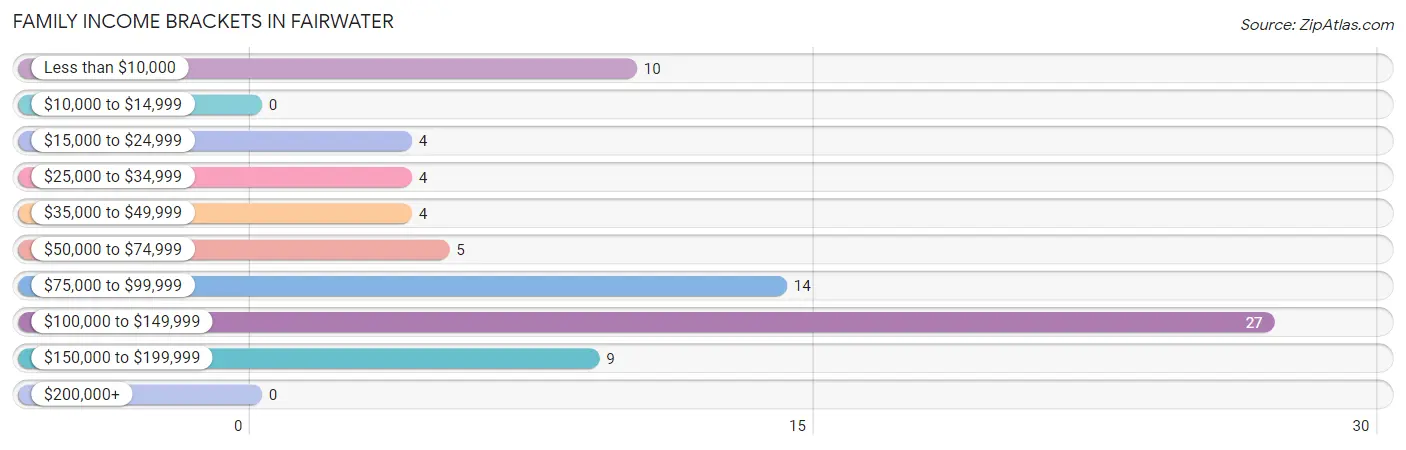
| Income Bracket | # Families | % Families |
| Less than $10,000 | 10 | 13.0% |
| $10,000 to $14,999 | 0 | 0.0% |
| $15,000 to $24,999 | 4 | 5.2% |
| $25,000 to $34,999 | 4 | 5.2% |
| $35,000 to $49,999 | 4 | 5.2% |
| $50,000 to $74,999 | 5 | 6.5% |
| $75,000 to $99,999 | 14 | 18.2% |
| $100,000 to $149,999 | 27 | 35.1% |
| $150,000 to $199,999 | 9 | 11.7% |
| $200,000+ | 0 | 0.0% |
Family Income by Famaliy Size in Fairwater
3-person families (11 | 14.3%) account for the highest median family income in Fairwater with $114,375 per family, while 2-person families (35 | 45.5%) have the highest median income of $41,875 per family member.
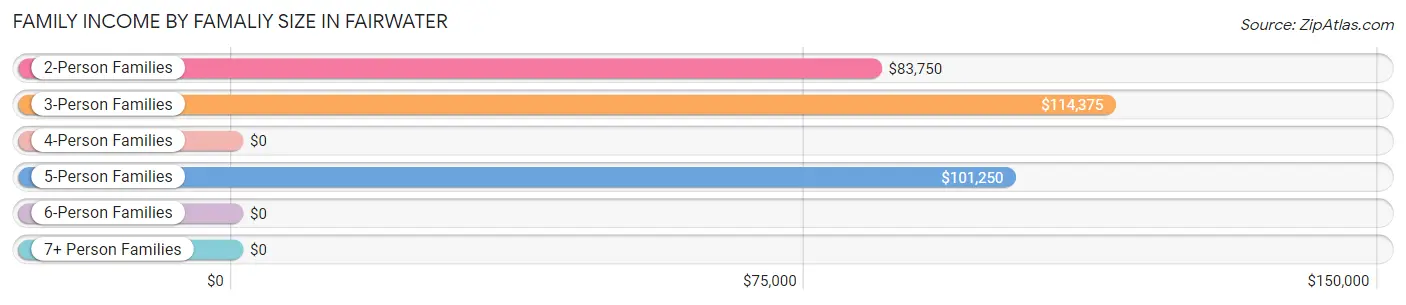
| Income Bracket | # Families | Median Income |
| 2-Person Families | 35 (45.5%) | $83,750 |
| 3-Person Families | 11 (14.3%) | $114,375 |
| 4-Person Families | 25 (32.5%) | $0 |
| 5-Person Families | 6 (7.8%) | $101,250 |
| 6-Person Families | 0 (0.0%) | $0 |
| 7+ Person Families | 0 (0.0%) | $0 |
| Total | 77 (100.0%) | $93,750 |
Family Income by Number of Earners in Fairwater
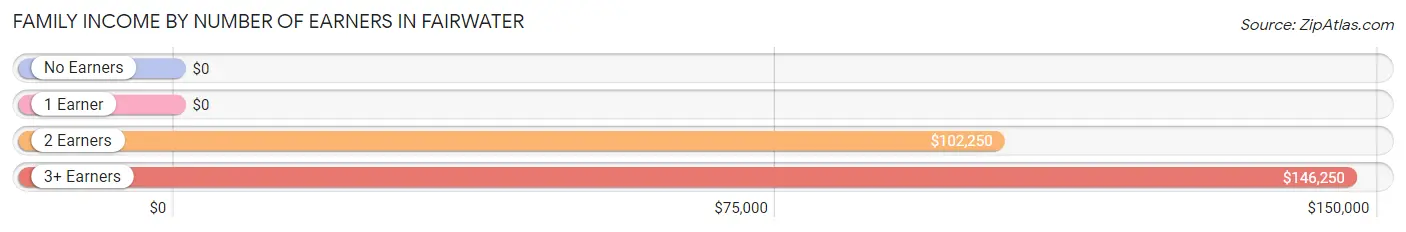
| Number of Earners | # Families | Median Income |
| No Earners | 3 (3.9%) | $0 |
| 1 Earner | 32 (41.6%) | $0 |
| 2 Earners | 33 (42.9%) | $102,250 |
| 3+ Earners | 9 (11.7%) | $146,250 |
| Total | 77 (100.0%) | $93,750 |
Household Income in Fairwater
Household Income Brackets in Fairwater
With 33 households falling in the category, the $100,000 to $149,999 income range is the most frequent in Fairwater, accounting for 25.2% of all households. In contrast, only 1 households (0.8%) fall into the $200,000+ income bracket, making it the least populous group.
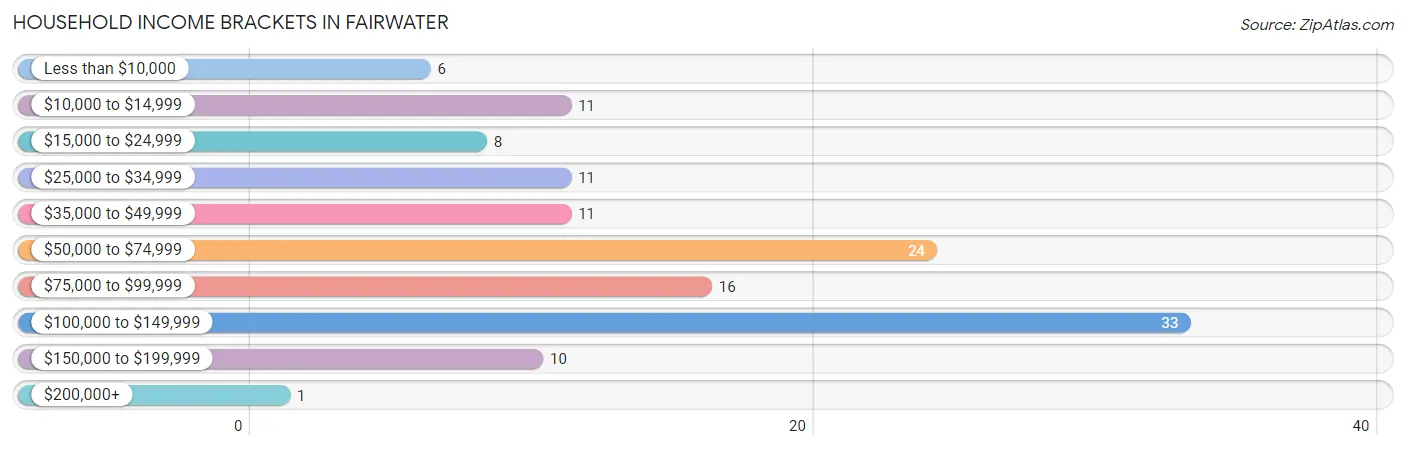
| Income Bracket | # Households | % Households |
| Less than $10,000 | 6 | 4.6% |
| $10,000 to $14,999 | 11 | 8.4% |
| $15,000 to $24,999 | 8 | 6.1% |
| $25,000 to $34,999 | 11 | 8.4% |
| $35,000 to $49,999 | 11 | 8.4% |
| $50,000 to $74,999 | 24 | 18.3% |
| $75,000 to $99,999 | 16 | 12.2% |
| $100,000 to $149,999 | 33 | 25.2% |
| $150,000 to $199,999 | 10 | 7.6% |
| $200,000+ | 1 | 0.8% |
Household Income by Householder Age in Fairwater
The median household income in Fairwater is $67,083, with the highest median household income of $108,750 found in the 45 to 64 years age bracket for the primary householder. A total of 34 households (26.0%) fall into this category. Meanwhile, the 15 to 24 years age bracket for the primary householder has the lowest median household income of $0, with 3 households (2.3%) in this group.
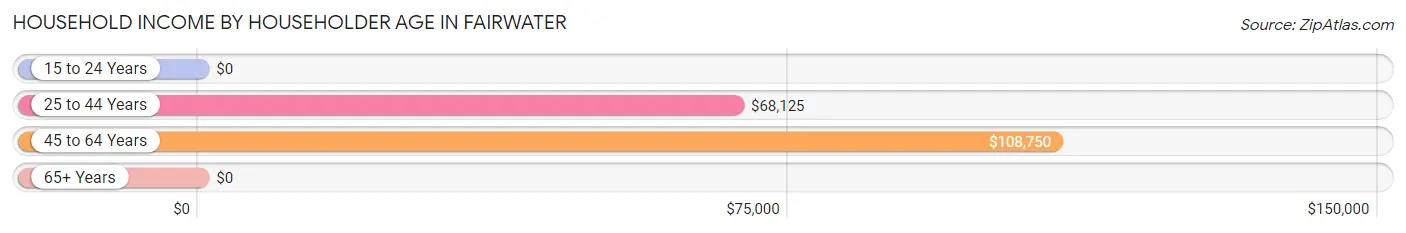
| Income Bracket | # Households | Median Income |
| 15 to 24 Years | 3 (2.3%) | $0 |
| 25 to 44 Years | 52 (39.7%) | $68,125 |
| 45 to 64 Years | 34 (26.0%) | $108,750 |
| 65+ Years | 42 (32.1%) | $0 |
| Total | 131 (100.0%) | $67,083 |
Poverty in Fairwater
Income Below Poverty by Sex and Age in Fairwater
With 28.9% poverty level for males and 20.4% for females among the residents of Fairwater, 16 and 17 year old males and 15 year old females are the most vulnerable to poverty, with 7 males (87.5%) and 4 females (100.0%) in their respective age groups living below the poverty level.
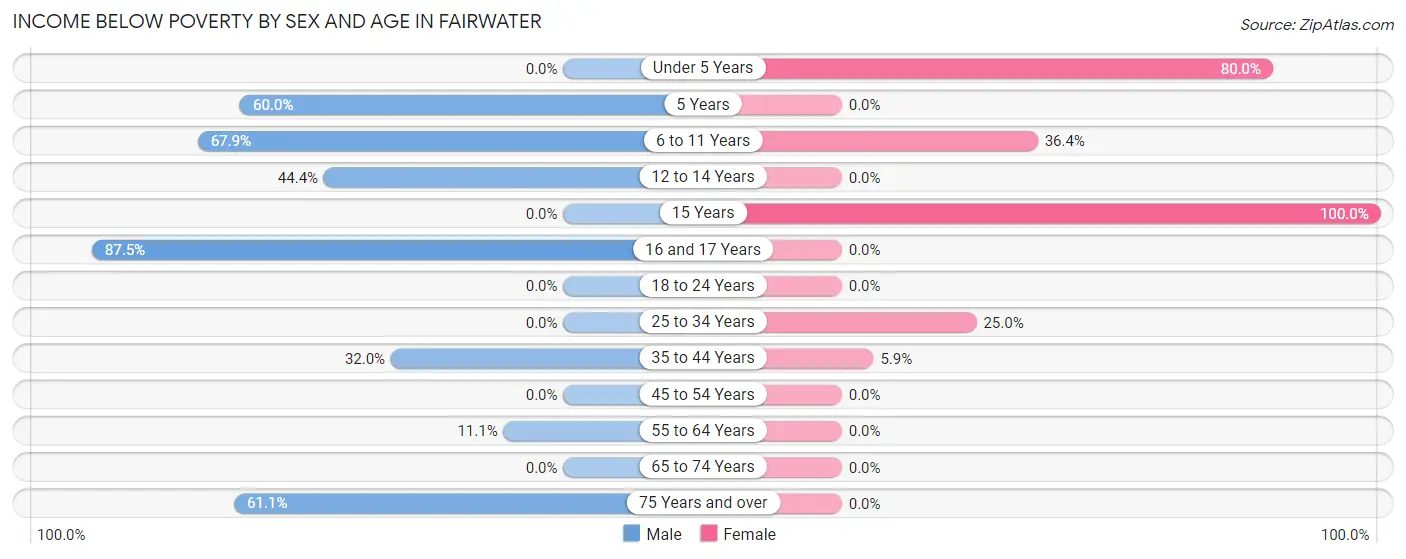
| Age Bracket | Male | Female |
| Under 5 Years | 0 (0.0%) | 12 (80.0%) |
| 5 Years | 3 (60.0%) | 0 (0.0%) |
| 6 to 11 Years | 19 (67.9%) | 8 (36.4%) |
| 12 to 14 Years | 4 (44.4%) | 0 (0.0%) |
| 15 Years | 0 (0.0%) | 4 (100.0%) |
| 16 and 17 Years | 7 (87.5%) | 0 (0.0%) |
| 18 to 24 Years | 0 (0.0%) | 0 (0.0%) |
| 25 to 34 Years | 0 (0.0%) | 6 (25.0%) |
| 35 to 44 Years | 8 (32.0%) | 1 (5.9%) |
| 45 to 54 Years | 0 (0.0%) | 0 (0.0%) |
| 55 to 64 Years | 2 (11.1%) | 0 (0.0%) |
| 65 to 74 Years | 0 (0.0%) | 0 (0.0%) |
| 75 Years and over | 11 (61.1%) | 0 (0.0%) |
| Total | 54 (28.9%) | 31 (20.4%) |
Income Above Poverty by Sex and Age in Fairwater
According to the poverty statistics in Fairwater, males aged under 5 years and females aged 5 years are the age groups that are most secure financially, with 100.0% of males and 100.0% of females in these age groups living above the poverty line.
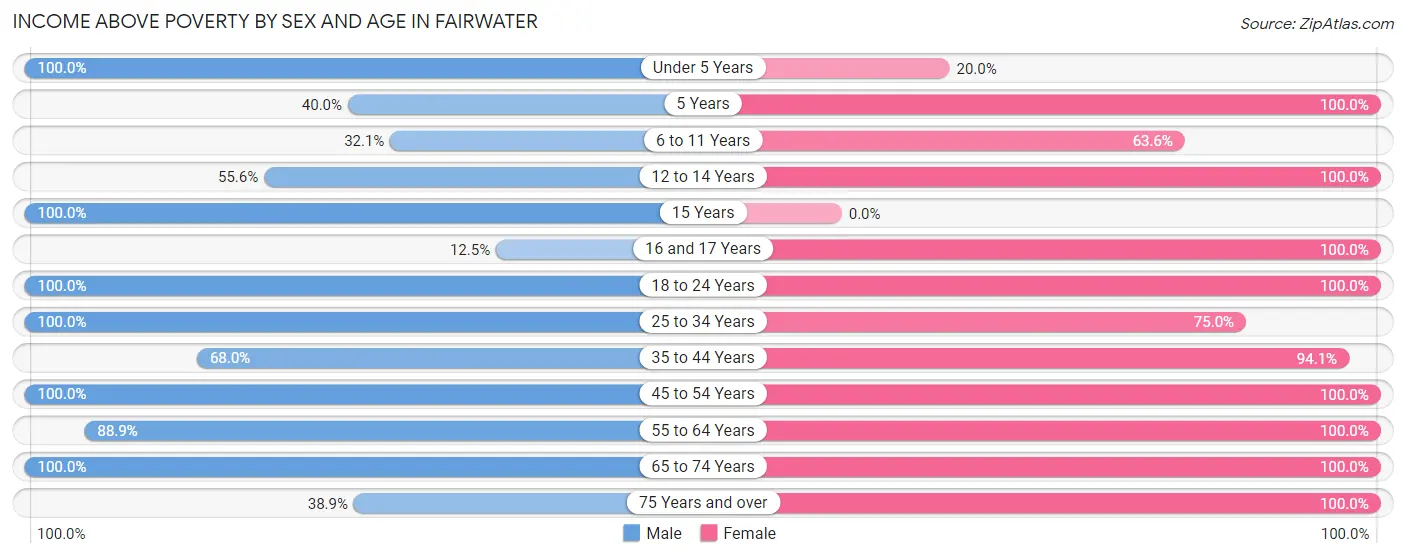
| Age Bracket | Male | Female |
| Under 5 Years | 9 (100.0%) | 3 (20.0%) |
| 5 Years | 2 (40.0%) | 1 (100.0%) |
| 6 to 11 Years | 9 (32.1%) | 14 (63.6%) |
| 12 to 14 Years | 5 (55.6%) | 6 (100.0%) |
| 15 Years | 3 (100.0%) | 0 (0.0%) |
| 16 and 17 Years | 1 (12.5%) | 4 (100.0%) |
| 18 to 24 Years | 9 (100.0%) | 6 (100.0%) |
| 25 to 34 Years | 23 (100.0%) | 18 (75.0%) |
| 35 to 44 Years | 17 (68.0%) | 16 (94.1%) |
| 45 to 54 Years | 22 (100.0%) | 13 (100.0%) |
| 55 to 64 Years | 16 (88.9%) | 16 (100.0%) |
| 65 to 74 Years | 10 (100.0%) | 9 (100.0%) |
| 75 Years and over | 7 (38.9%) | 15 (100.0%) |
| Total | 133 (71.1%) | 121 (79.6%) |
Income Below Poverty Among Married-Couple Families in Fairwater
The poverty statistics for married-couple families in Fairwater show that 1.8% or 1 of the total 57 families live below the poverty line. Families with 3 or 4 children have the highest poverty rate of 20.0%, comprising of 1 families. On the other hand, families with no children have the lowest poverty rate of 0.0%, which includes 0 families.
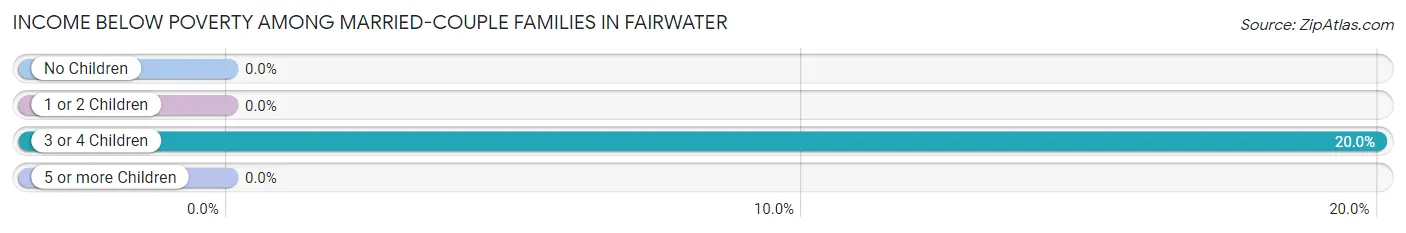
| Children | Above Poverty | Below Poverty |
| No Children | 33 (100.0%) | 0 (0.0%) |
| 1 or 2 Children | 19 (100.0%) | 0 (0.0%) |
| 3 or 4 Children | 4 (80.0%) | 1 (20.0%) |
| 5 or more Children | 0 (0.0%) | 0 (0.0%) |
| Total | 56 (98.3%) | 1 (1.8%) |
Income Below Poverty Among Single-Parent Households in Fairwater
According to the poverty data in Fairwater, 57.1% or 4 single-father households and 46.2% or 6 single-mother households are living below the poverty line. Among single-father households, those with 3 or 4 children have the highest poverty rate, with 4 households (100.0%) experiencing poverty. Likewise, among single-mother households, those with 3 or 4 children have the highest poverty rate, with 6 households (100.0%) falling below the poverty line.
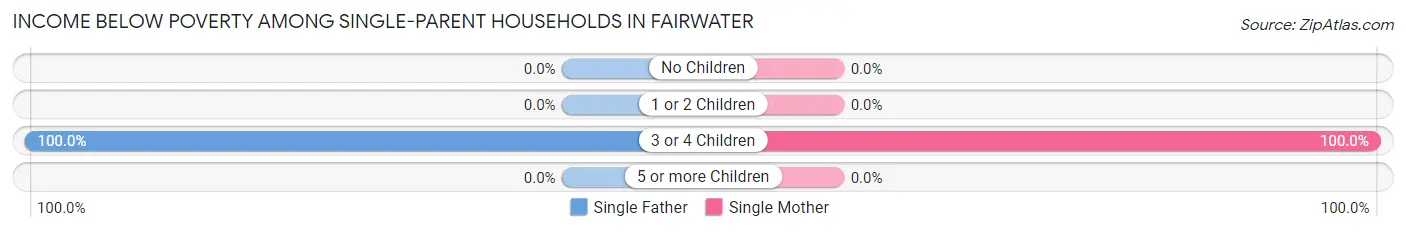
| Children | Single Father | Single Mother |
| No Children | 0 (0.0%) | 0 (0.0%) |
| 1 or 2 Children | 0 (0.0%) | 0 (0.0%) |
| 3 or 4 Children | 4 (100.0%) | 6 (100.0%) |
| 5 or more Children | 0 (0.0%) | 0 (0.0%) |
| Total | 4 (57.1%) | 6 (46.2%) |
Income Below Poverty Among Married-Couple vs Single-Parent Households in Fairwater
The poverty data for Fairwater shows that 1 of the married-couple family households (1.8%) and 10 of the single-parent households (50.0%) are living below the poverty level. Within the married-couple family households, those with 3 or 4 children have the highest poverty rate, with 1 households (20.0%) falling below the poverty line. Among the single-parent households, those with 3 or 4 children have the highest poverty rate, with 10 household (100.0%) living below poverty.
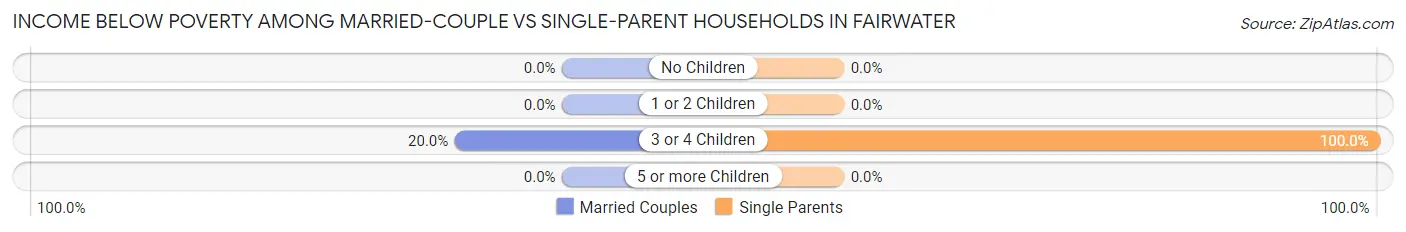
| Children | Married-Couple Families | Single-Parent Households |
| No Children | 0 (0.0%) | 0 (0.0%) |
| 1 or 2 Children | 0 (0.0%) | 0 (0.0%) |
| 3 or 4 Children | 1 (20.0%) | 10 (100.0%) |
| 5 or more Children | 0 (0.0%) | 0 (0.0%) |
| Total | 1 (1.8%) | 10 (50.0%) |
Race in Fairwater
The most populous races in Fairwater are White / Caucasian (308 | 90.9%), Two or more Races (31 | 9.1%), and Hispanic or Latino (19 | 5.6%).
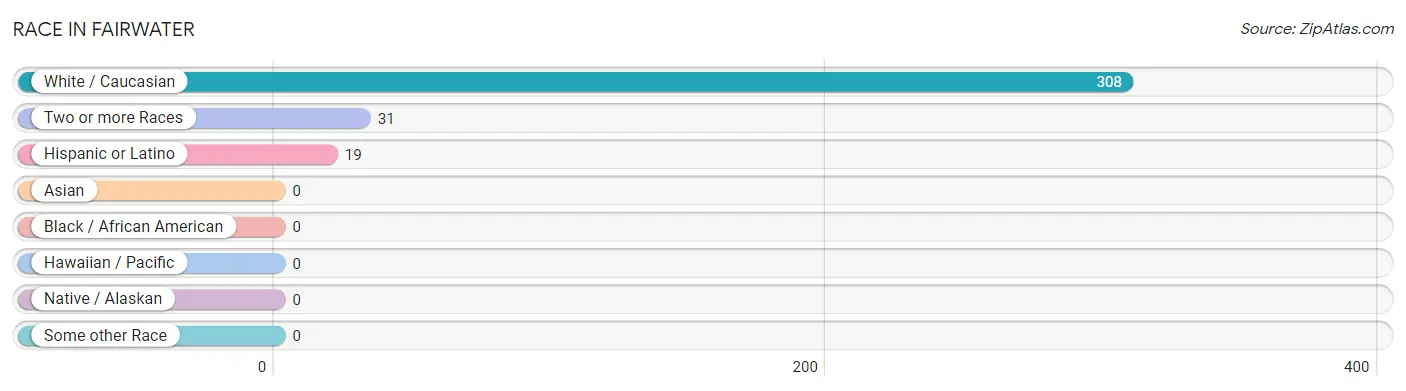
| Race | # Population | % Population |
| Asian | 0 | 0.0% |
| Black / African American | 0 | 0.0% |
| Hawaiian / Pacific | 0 | 0.0% |
| Hispanic or Latino | 19 | 5.6% |
| Native / Alaskan | 0 | 0.0% |
| White / Caucasian | 308 | 90.9% |
| Two or more Races | 31 | 9.1% |
| Some other Race | 0 | 0.0% |
| Total | 339 | 100.0% |
Ancestry in Fairwater
The most populous ancestries reported in Fairwater are German (156 | 46.0%), Czech (42 | 12.4%), Irish (37 | 10.9%), Polish (29 | 8.6%), and English (22 | 6.5%), together accounting for 84.4% of all Fairwater residents.
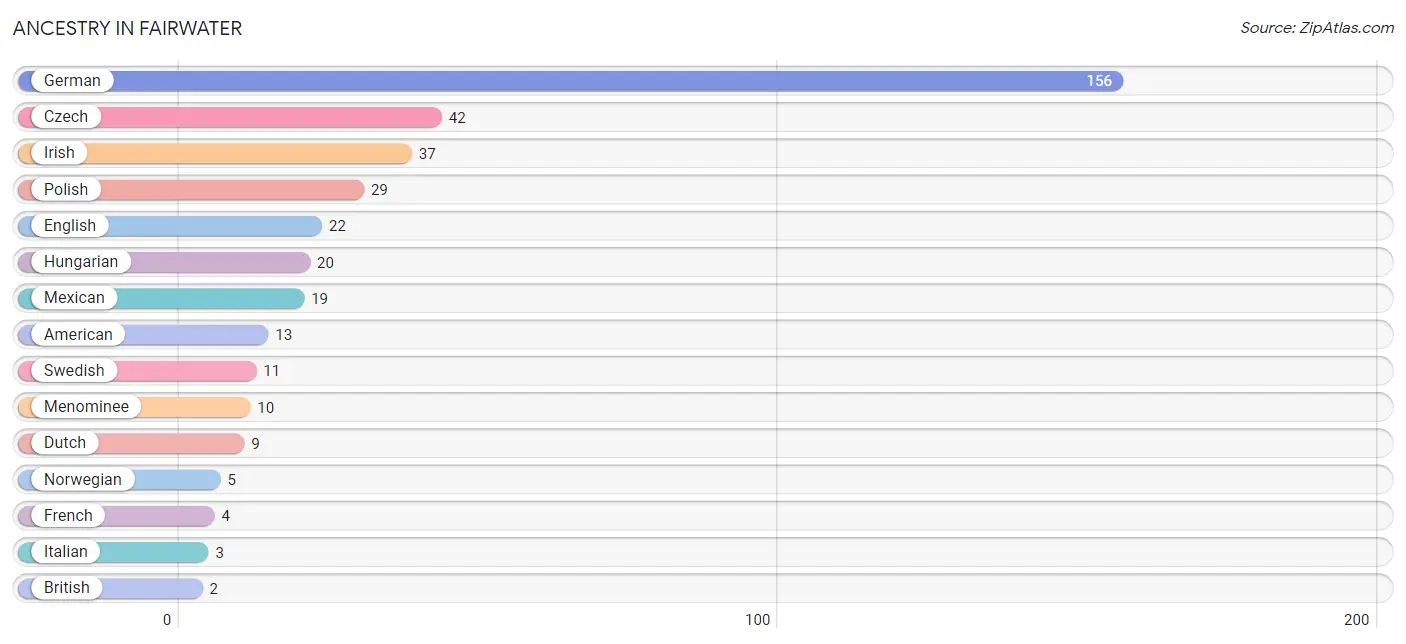
| Ancestry | # Population | % Population |
| American | 13 | 3.8% |
| British | 2 | 0.6% |
| Czech | 42 | 12.4% |
| Danish | 1 | 0.3% |
| Dutch | 9 | 2.6% |
| English | 22 | 6.5% |
| Finnish | 1 | 0.3% |
| French | 4 | 1.2% |
| German | 156 | 46.0% |
| Hungarian | 20 | 5.9% |
| Irish | 37 | 10.9% |
| Italian | 3 | 0.9% |
| Menominee | 10 | 2.9% |
| Mexican | 19 | 5.6% |
| Norwegian | 5 | 1.5% |
| Polish | 29 | 8.6% |
| Scotch-Irish | 1 | 0.3% |
| Scottish | 1 | 0.3% |
| Swedish | 11 | 3.2% |
| Swiss | 1 | 0.3% | View All 20 Rows |
Immigrants in Fairwater

| Immigration Origin | # Population | % Population | View All 0 Rows |
Sex and Age in Fairwater
Sex and Age in Fairwater
The most populous age groups in Fairwater are 5 to 9 Years (27 | 14.4%) for men and 5 to 9 Years (16 | 10.5%) for women.
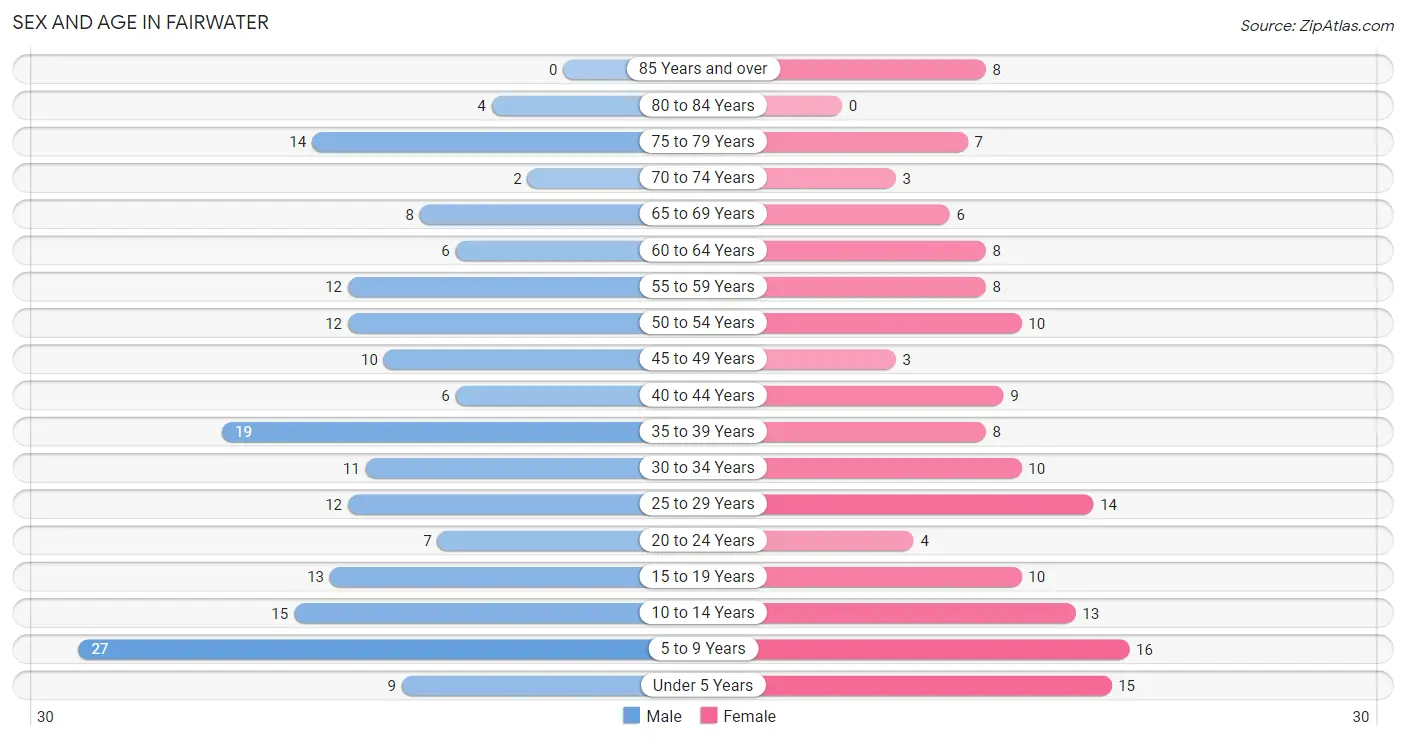
| Age Bracket | Male | Female |
| Under 5 Years | 9 (4.8%) | 15 (9.9%) |
| 5 to 9 Years | 27 (14.4%) | 16 (10.5%) |
| 10 to 14 Years | 15 (8.0%) | 13 (8.6%) |
| 15 to 19 Years | 13 (7.0%) | 10 (6.6%) |
| 20 to 24 Years | 7 (3.7%) | 4 (2.6%) |
| 25 to 29 Years | 12 (6.4%) | 14 (9.2%) |
| 30 to 34 Years | 11 (5.9%) | 10 (6.6%) |
| 35 to 39 Years | 19 (10.2%) | 8 (5.3%) |
| 40 to 44 Years | 6 (3.2%) | 9 (5.9%) |
| 45 to 49 Years | 10 (5.3%) | 3 (2.0%) |
| 50 to 54 Years | 12 (6.4%) | 10 (6.6%) |
| 55 to 59 Years | 12 (6.4%) | 8 (5.3%) |
| 60 to 64 Years | 6 (3.2%) | 8 (5.3%) |
| 65 to 69 Years | 8 (4.3%) | 6 (4.0%) |
| 70 to 74 Years | 2 (1.1%) | 3 (2.0%) |
| 75 to 79 Years | 14 (7.5%) | 7 (4.6%) |
| 80 to 84 Years | 4 (2.1%) | 0 (0.0%) |
| 85 Years and over | 0 (0.0%) | 8 (5.3%) |
| Total | 187 (100.0%) | 152 (100.0%) |
Families and Households in Fairwater
Median Family Size in Fairwater
The median family size in Fairwater is 3.47 persons per family, with single female/mother families (13 | 16.9%) accounting for the largest median family size of 4.54 persons per family. On the other hand, single male/father families (7 | 9.1%) represent the smallest median family size with 3.14 persons per family.
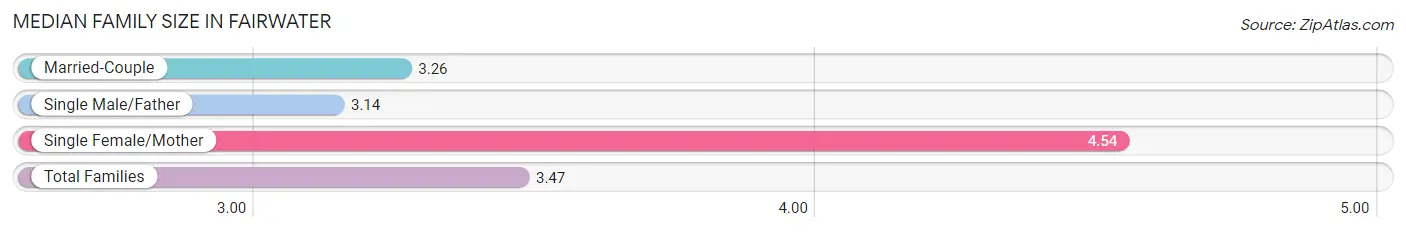
| Family Type | # Families | Family Size |
| Married-Couple | 57 (74.0%) | 3.26 |
| Single Male/Father | 7 (9.1%) | 3.14 |
| Single Female/Mother | 13 (16.9%) | 4.54 |
| Total Families | 77 (100.0%) | 3.47 |
Median Household Size in Fairwater
The median household size in Fairwater is 2.59 persons per household, with single female/mother households (13 | 9.9%) accounting for the largest median household size of 5.15 persons per household. non-family households (54 | 41.2%) represent the smallest median household size with 1.11 persons per household.
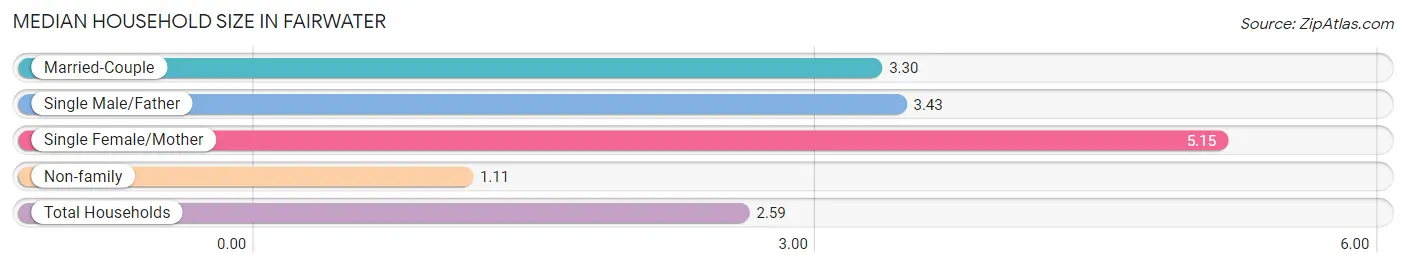
| Household Type | # Households | Household Size |
| Married-Couple | 57 (43.5%) | 3.30 |
| Single Male/Father | 7 (5.3%) | 3.43 |
| Single Female/Mother | 13 (9.9%) | 5.15 |
| Non-family | 54 (41.2%) | 1.11 |
| Total Households | 131 (100.0%) | 2.59 |
Household Size by Marriage Status in Fairwater
Out of a total of 131 households in Fairwater, 77 (58.8%) are family households, while 54 (41.2%) are nonfamily households. The most numerous type of family households are 2-person households, comprising 30, and the most common type of nonfamily households are 1-person households, comprising 47.
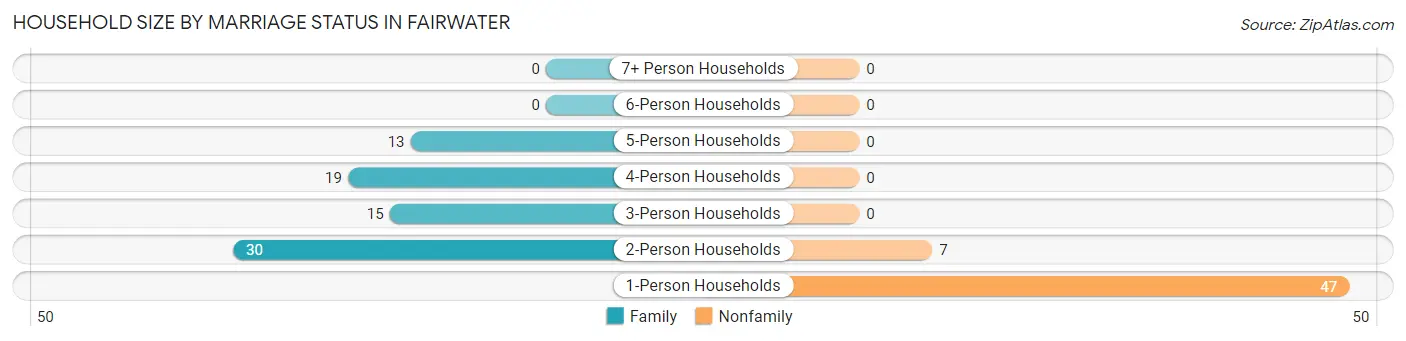
| Household Size | Family Households | Nonfamily Households |
| 1-Person Households | - | 47 (35.9%) |
| 2-Person Households | 30 (22.9%) | 7 (5.3%) |
| 3-Person Households | 15 (11.5%) | 0 (0.0%) |
| 4-Person Households | 19 (14.5%) | 0 (0.0%) |
| 5-Person Households | 13 (9.9%) | 0 (0.0%) |
| 6-Person Households | 0 (0.0%) | 0 (0.0%) |
| 7+ Person Households | 0 (0.0%) | 0 (0.0%) |
| Total | 77 (58.8%) | 54 (41.2%) |
Female Fertility in Fairwater
Fertility by Age in Fairwater
Average fertility rate in Fairwater is 67.0 births per 1,000 women. Women in the age bracket of 20 to 34 years have the highest fertility rate with 107.0 births per 1,000 women. Women in the age bracket of 20 to 34 years acount for 75.0% of all women with births.
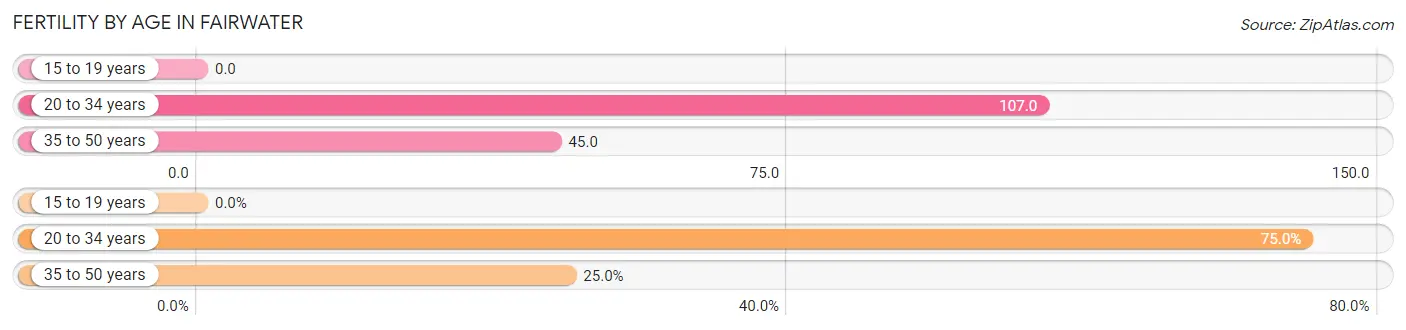
| Age Bracket | Women with Births | Births / 1,000 Women |
| 15 to 19 years | 0 (0.0%) | 0.0 |
| 20 to 34 years | 3 (75.0%) | 107.0 |
| 35 to 50 years | 1 (25.0%) | 45.0 |
| Total | 4 (100.0%) | 67.0 |
Fertility by Age by Marriage Status in Fairwater
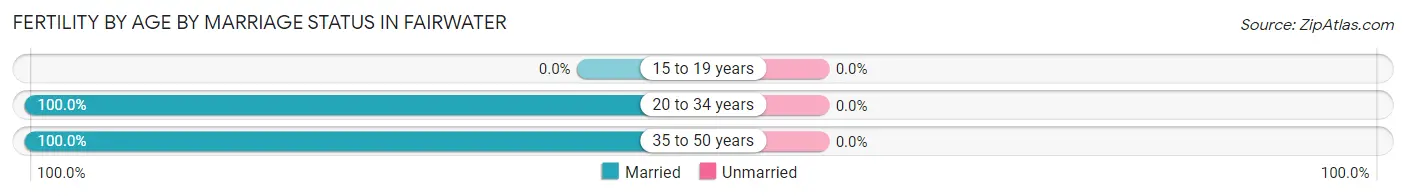
| Age Bracket | Married | Unmarried |
| 15 to 19 years | 0 (0.0%) | 0 (0.0%) |
| 20 to 34 years | 3 (100.0%) | 0 (0.0%) |
| 35 to 50 years | 1 (100.0%) | 0 (0.0%) |
| Total | 4 (100.0%) | 0 (0.0%) |
Fertility by Education in Fairwater
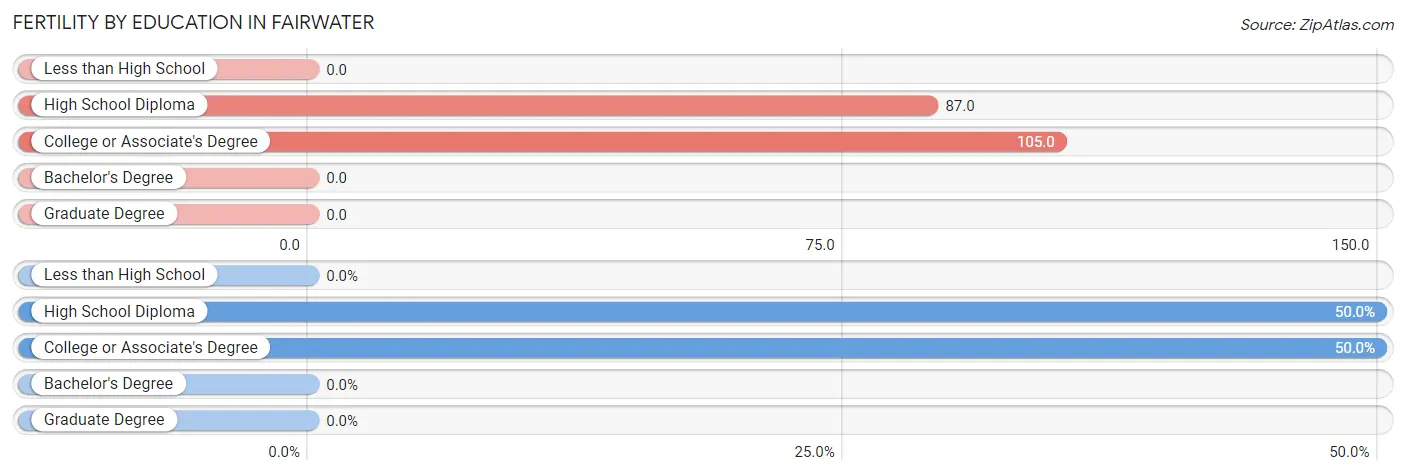
| Educational Attainment | Women with Births | Births / 1,000 Women |
| Less than High School | 0 (0.0%) | 0.0 |
| High School Diploma | 2 (50.0%) | 87.0 |
| College or Associate's Degree | 2 (50.0%) | 105.0 |
| Bachelor's Degree | 0 (0.0%) | 0.0 |
| Graduate Degree | 0 (0.0%) | 0.0 |
| Total | 4 (100.0%) | 67.0 |
Fertility by Education by Marriage Status in Fairwater
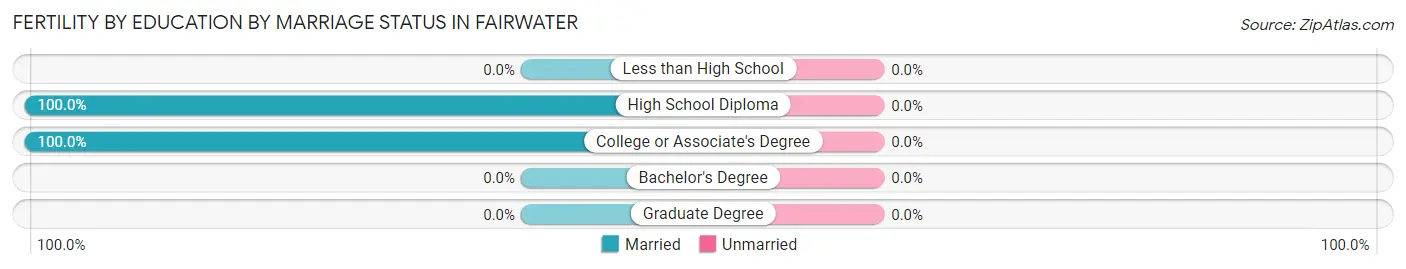
| Educational Attainment | Married | Unmarried |
| Less than High School | 0 (0.0%) | 0 (0.0%) |
| High School Diploma | 2 (100.0%) | 0 (0.0%) |
| College or Associate's Degree | 2 (100.0%) | 0 (0.0%) |
| Bachelor's Degree | 0 (0.0%) | 0 (0.0%) |
| Graduate Degree | 0 (0.0%) | 0 (0.0%) |
| Total | 4 (100.0%) | 0 (0.0%) |
Employment Characteristics in Fairwater
Employment by Class of Employer in Fairwater
Among the 173 employed individuals in Fairwater, private company employees (130 | 75.1%), local government employees (21 | 12.1%), and self-employed (incorporated) (6 | 3.5%) make up the most common classes of employment.
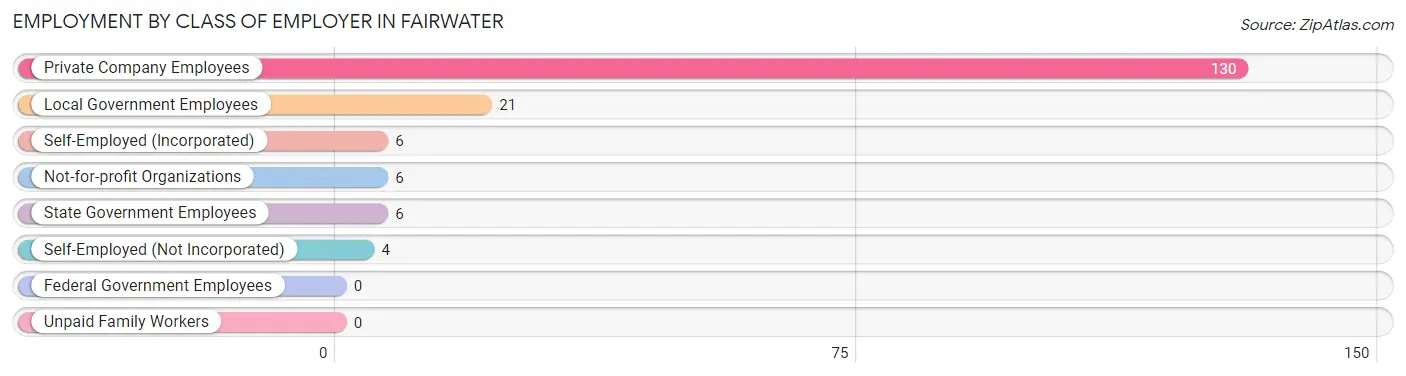
| Employer Class | # Employees | % Employees |
| Private Company Employees | 130 | 75.1% |
| Self-Employed (Incorporated) | 6 | 3.5% |
| Self-Employed (Not Incorporated) | 4 | 2.3% |
| Not-for-profit Organizations | 6 | 3.5% |
| Local Government Employees | 21 | 12.1% |
| State Government Employees | 6 | 3.5% |
| Federal Government Employees | 0 | 0.0% |
| Unpaid Family Workers | 0 | 0.0% |
| Total | 173 | 100.0% |
Employment Status by Age in Fairwater
According to the labor force statistics for Fairwater, out of the total population over 16 years of age (237), 74.7% or 177 individuals are in the labor force, with 2.3% or 4 of them unemployed. The age group with the highest labor force participation rate is 20 to 24 years, with 100.0% or 11 individuals in the labor force. Within the labor force, the 16 to 19 years age range has the highest percentage of unemployed individuals, with 44.4% or 4 of them being unemployed.
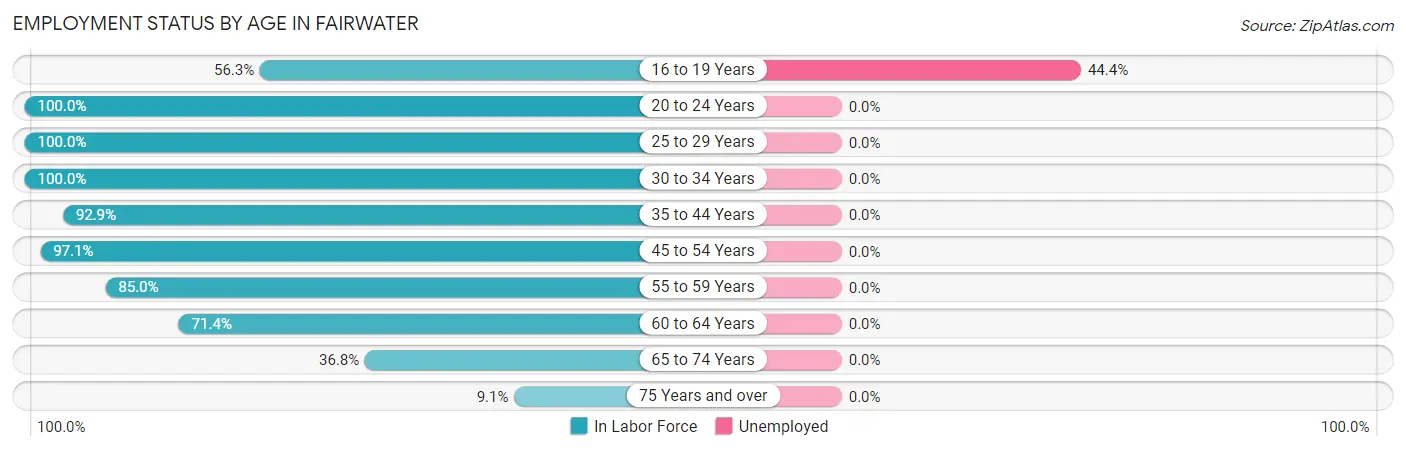
| Age Bracket | In Labor Force | Unemployed |
| 16 to 19 Years | 9 (56.3%) | 4 (44.4%) |
| 20 to 24 Years | 11 (100.0%) | 0 (0.0%) |
| 25 to 29 Years | 26 (100.0%) | 0 (0.0%) |
| 30 to 34 Years | 21 (100.0%) | 0 (0.0%) |
| 35 to 44 Years | 39 (92.9%) | 0 (0.0%) |
| 45 to 54 Years | 34 (97.1%) | 0 (0.0%) |
| 55 to 59 Years | 17 (85.0%) | 0 (0.0%) |
| 60 to 64 Years | 10 (71.4%) | 0 (0.0%) |
| 65 to 74 Years | 7 (36.8%) | 0 (0.0%) |
| 75 Years and over | 3 (9.1%) | 0 (0.0%) |
| Total | 177 (74.7%) | 4 (2.3%) |
Employment Status by Educational Attainment in Fairwater
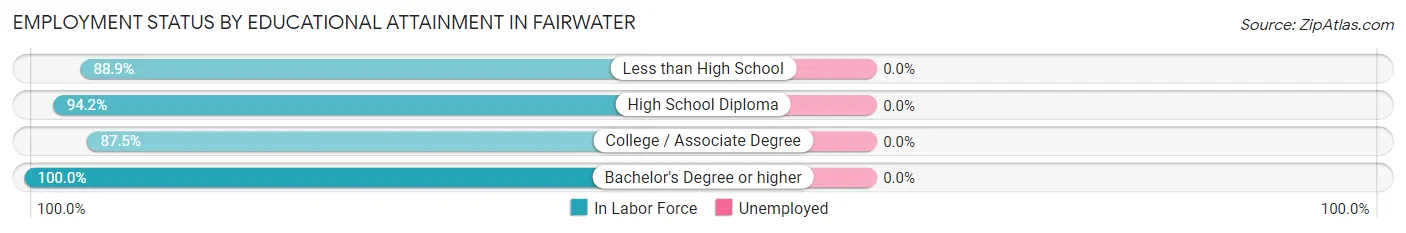
| Educational Attainment | In Labor Force | Unemployed |
| Less than High School | 8 (88.9%) | 0 (0.0%) |
| High School Diploma | 65 (94.2%) | 0 (0.0%) |
| College / Associate Degree | 42 (87.5%) | 0 (0.0%) |
| Bachelor's Degree or higher | 32 (100.0%) | 0 (0.0%) |
| Total | 147 (93.0%) | 0 (0.0%) |
Employment Occupations by Sex in Fairwater
Management, Business, Science and Arts Occupations
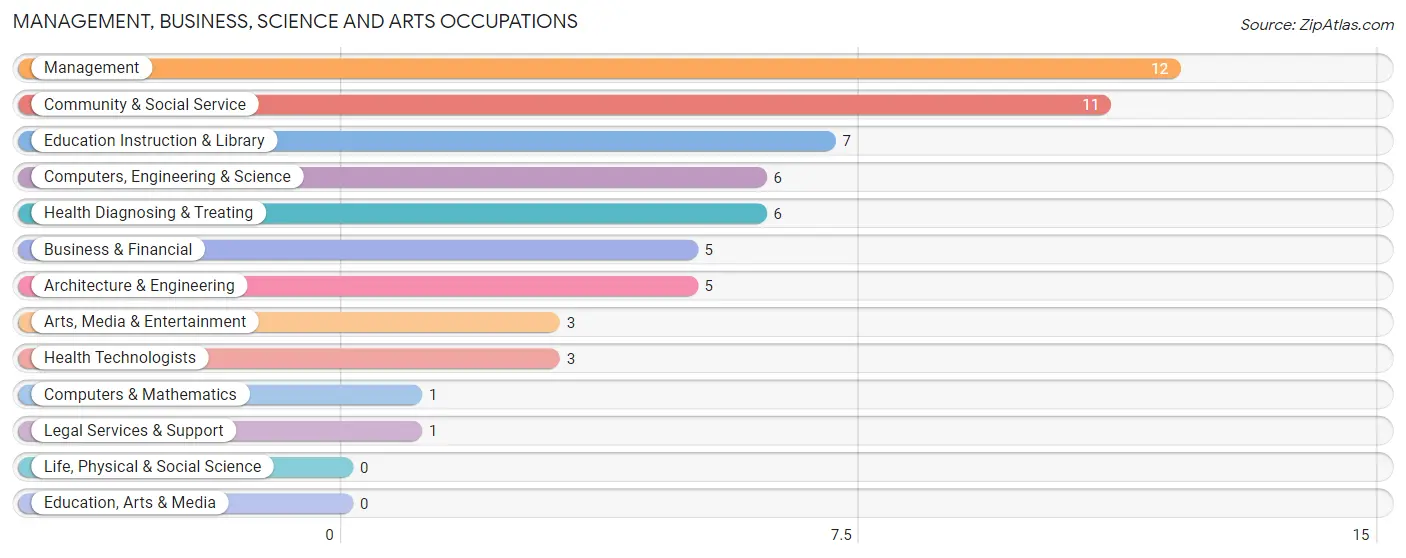
The most common Management, Business, Science and Arts occupations in Fairwater are Management (12 | 6.9%), Community & Social Service (11 | 6.4%), Education Instruction & Library (7 | 4.1%), Computers, Engineering & Science (6 | 3.5%), and Health Diagnosing & Treating (6 | 3.5%).
Management, Business, Science and Arts Occupations by Sex
Within the Management, Business, Science and Arts occupations in Fairwater, the most male-oriented occupations are Architecture & Engineering (100.0%), Computers, Engineering & Science (83.3%), and Management (75.0%), while the most female-oriented occupations are Computers & Mathematics (100.0%), Legal Services & Support (100.0%), and Arts, Media & Entertainment (100.0%).
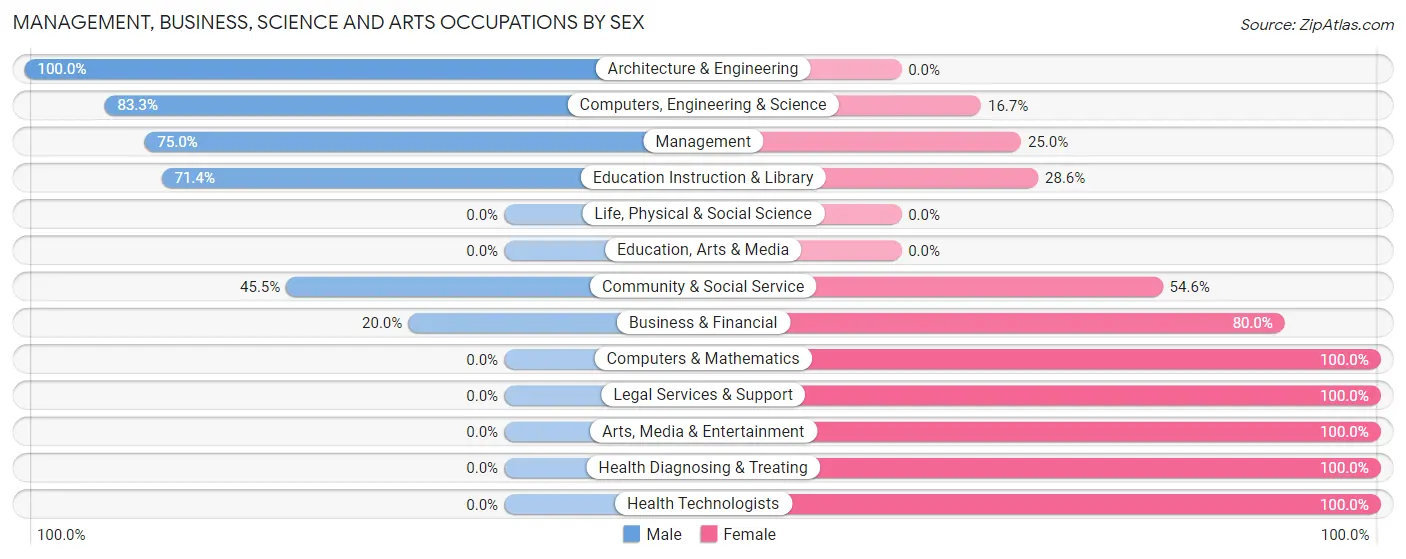
| Occupation | Male | Female |
| Management | 9 (75.0%) | 3 (25.0%) |
| Business & Financial | 1 (20.0%) | 4 (80.0%) |
| Computers, Engineering & Science | 5 (83.3%) | 1 (16.7%) |
| Computers & Mathematics | 0 (0.0%) | 1 (100.0%) |
| Architecture & Engineering | 5 (100.0%) | 0 (0.0%) |
| Life, Physical & Social Science | 0 (0.0%) | 0 (0.0%) |
| Community & Social Service | 5 (45.5%) | 6 (54.5%) |
| Education, Arts & Media | 0 (0.0%) | 0 (0.0%) |
| Legal Services & Support | 0 (0.0%) | 1 (100.0%) |
| Education Instruction & Library | 5 (71.4%) | 2 (28.6%) |
| Arts, Media & Entertainment | 0 (0.0%) | 3 (100.0%) |
| Health Diagnosing & Treating | 0 (0.0%) | 6 (100.0%) |
| Health Technologists | 0 (0.0%) | 3 (100.0%) |
| Total (Category) | 20 (50.0%) | 20 (50.0%) |
| Total (Overall) | 104 (60.1%) | 69 (39.9%) |
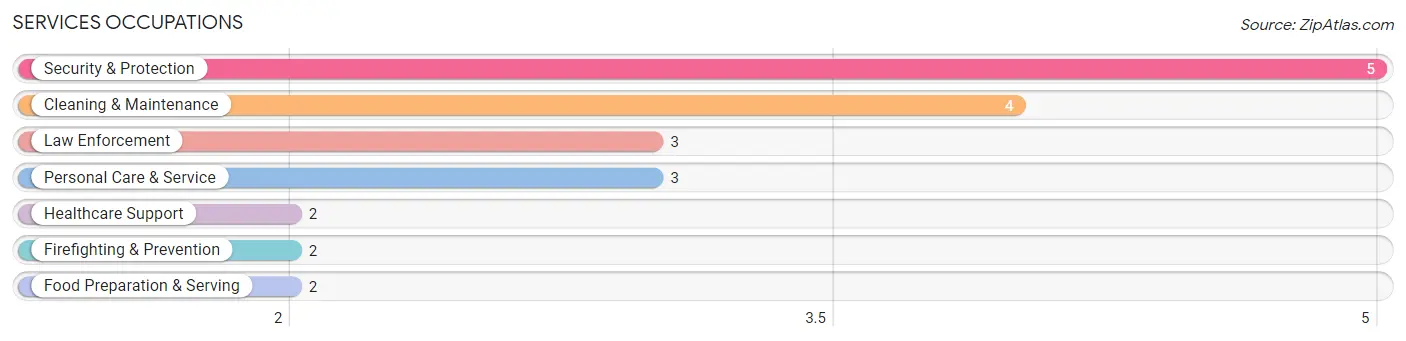
Services Occupations
The most common Services occupations in Fairwater are Security & Protection (5 | 2.9%), Cleaning & Maintenance (4 | 2.3%), Law Enforcement (3 | 1.7%), Personal Care & Service (3 | 1.7%), and Healthcare Support (2 | 1.2%).
Services Occupations by Sex
Within the Services occupations in Fairwater, the most male-oriented occupations are Food Preparation & Serving (100.0%), Law Enforcement (66.7%), and Cleaning & Maintenance (50.0%), while the most female-oriented occupations are Healthcare Support (100.0%), Firefighting & Prevention (100.0%), and Personal Care & Service (100.0%).
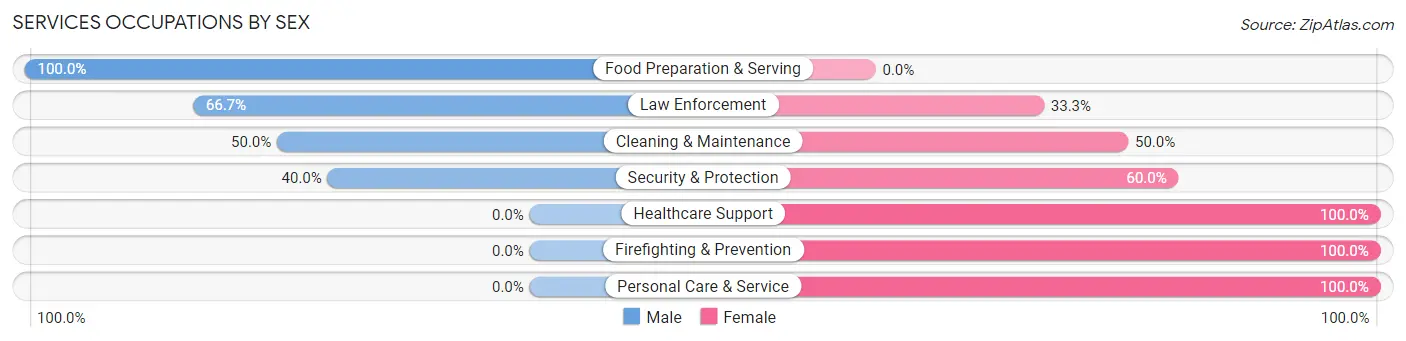
| Occupation | Male | Female |
| Healthcare Support | 0 (0.0%) | 2 (100.0%) |
| Security & Protection | 2 (40.0%) | 3 (60.0%) |
| Firefighting & Prevention | 0 (0.0%) | 2 (100.0%) |
| Law Enforcement | 2 (66.7%) | 1 (33.3%) |
| Food Preparation & Serving | 2 (100.0%) | 0 (0.0%) |
| Cleaning & Maintenance | 2 (50.0%) | 2 (50.0%) |
| Personal Care & Service | 0 (0.0%) | 3 (100.0%) |
| Total (Category) | 6 (37.5%) | 10 (62.5%) |
| Total (Overall) | 104 (60.1%) | 69 (39.9%) |
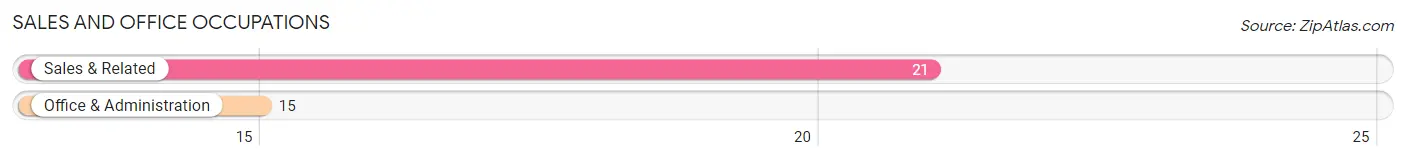
Sales and Office Occupations
The most common Sales and Office occupations in Fairwater are Sales & Related (21 | 12.1%), and Office & Administration (15 | 8.7%).
Sales and Office Occupations by Sex
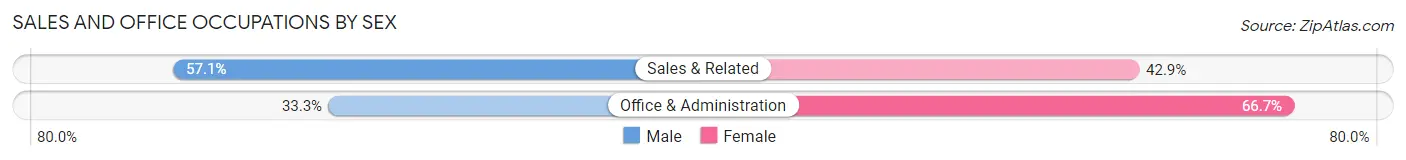
| Occupation | Male | Female |
| Sales & Related | 12 (57.1%) | 9 (42.9%) |
| Office & Administration | 5 (33.3%) | 10 (66.7%) |
| Total (Category) | 17 (47.2%) | 19 (52.8%) |
| Total (Overall) | 104 (60.1%) | 69 (39.9%) |
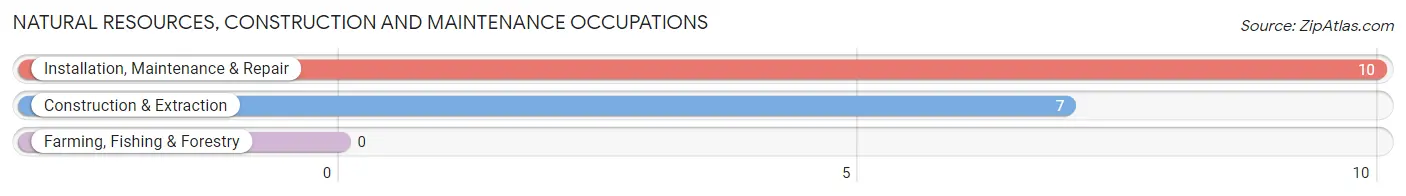
Natural Resources, Construction and Maintenance Occupations
The most common Natural Resources, Construction and Maintenance occupations in Fairwater are Installation, Maintenance & Repair (10 | 5.8%), and Construction & Extraction (7 | 4.1%).
Natural Resources, Construction and Maintenance Occupations by Sex
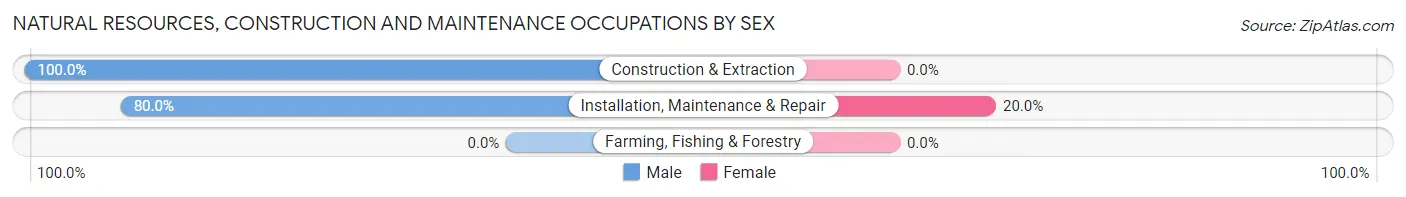
| Occupation | Male | Female |
| Farming, Fishing & Forestry | 0 (0.0%) | 0 (0.0%) |
| Construction & Extraction | 7 (100.0%) | 0 (0.0%) |
| Installation, Maintenance & Repair | 8 (80.0%) | 2 (20.0%) |
| Total (Category) | 15 (88.2%) | 2 (11.8%) |
| Total (Overall) | 104 (60.1%) | 69 (39.9%) |
Production, Transportation and Moving Occupations
The most common Production, Transportation and Moving occupations in Fairwater are Production (34 | 19.7%), Transportation (16 | 9.2%), and Material Moving (14 | 8.1%).
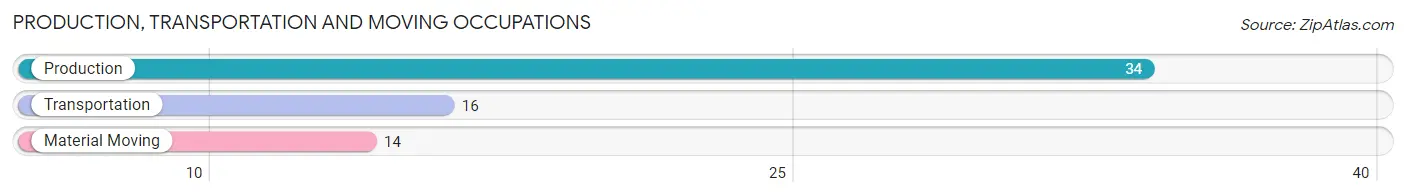
Production, Transportation and Moving Occupations by Sex
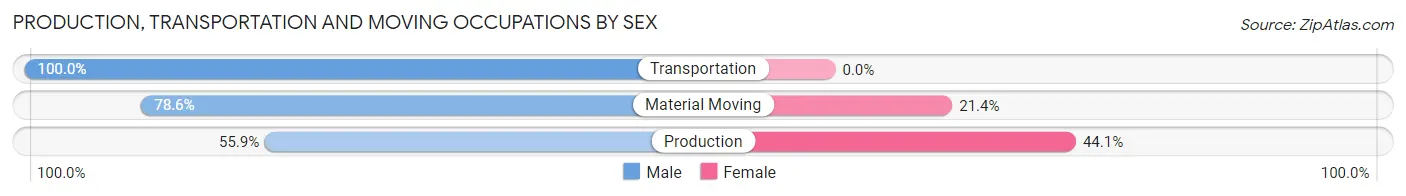
| Occupation | Male | Female |
| Production | 19 (55.9%) | 15 (44.1%) |
| Transportation | 16 (100.0%) | 0 (0.0%) |
| Material Moving | 11 (78.6%) | 3 (21.4%) |
| Total (Category) | 46 (71.9%) | 18 (28.1%) |
| Total (Overall) | 104 (60.1%) | 69 (39.9%) |
Employment Industries by Sex in Fairwater
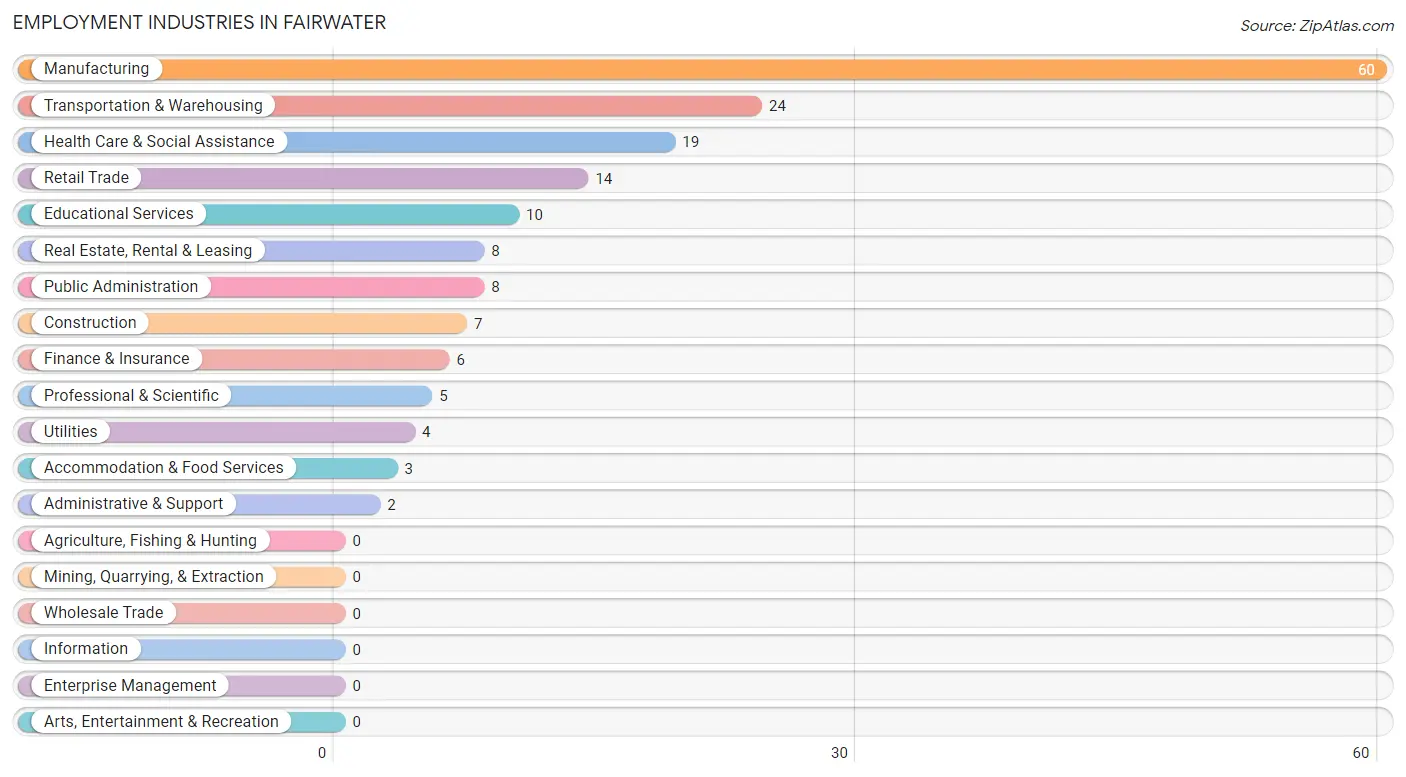
Employment Industries in Fairwater
The major employment industries in Fairwater include Manufacturing (60 | 34.7%), Transportation & Warehousing (24 | 13.9%), Health Care & Social Assistance (19 | 11.0%), Retail Trade (14 | 8.1%), and Educational Services (10 | 5.8%).
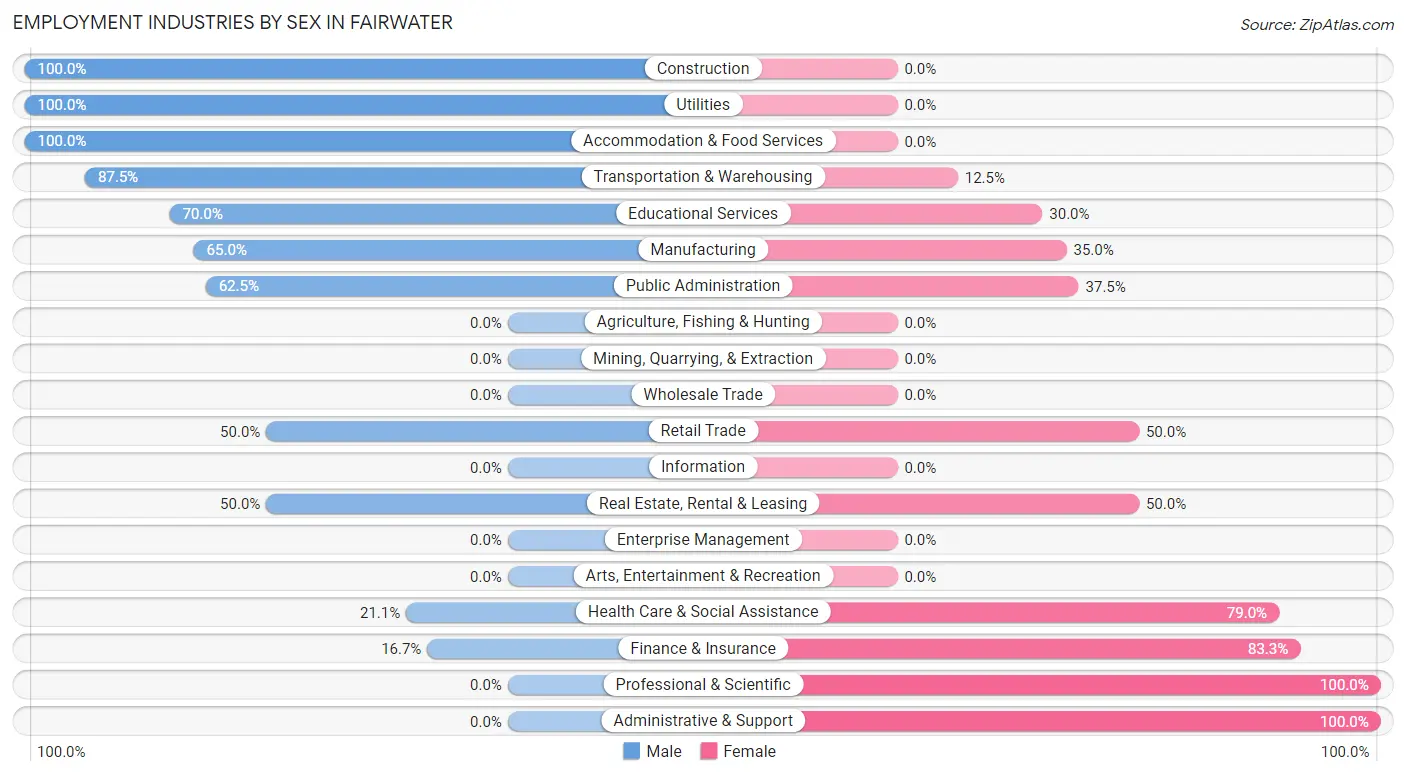
Employment Industries by Sex in Fairwater
The Fairwater industries that see more men than women are Construction (100.0%), Utilities (100.0%), and Accommodation & Food Services (100.0%), whereas the industries that tend to have a higher number of women are Professional & Scientific (100.0%), Administrative & Support (100.0%), and Finance & Insurance (83.3%).
| Industry | Male | Female |
| Agriculture, Fishing & Hunting | 0 (0.0%) | 0 (0.0%) |
| Mining, Quarrying, & Extraction | 0 (0.0%) | 0 (0.0%) |
| Construction | 7 (100.0%) | 0 (0.0%) |
| Manufacturing | 39 (65.0%) | 21 (35.0%) |
| Wholesale Trade | 0 (0.0%) | 0 (0.0%) |
| Retail Trade | 7 (50.0%) | 7 (50.0%) |
| Transportation & Warehousing | 21 (87.5%) | 3 (12.5%) |
| Utilities | 4 (100.0%) | 0 (0.0%) |
| Information | 0 (0.0%) | 0 (0.0%) |
| Finance & Insurance | 1 (16.7%) | 5 (83.3%) |
| Real Estate, Rental & Leasing | 4 (50.0%) | 4 (50.0%) |
| Professional & Scientific | 0 (0.0%) | 5 (100.0%) |
| Enterprise Management | 0 (0.0%) | 0 (0.0%) |
| Administrative & Support | 0 (0.0%) | 2 (100.0%) |
| Educational Services | 7 (70.0%) | 3 (30.0%) |
| Health Care & Social Assistance | 4 (21.0%) | 15 (78.9%) |
| Arts, Entertainment & Recreation | 0 (0.0%) | 0 (0.0%) |
| Accommodation & Food Services | 3 (100.0%) | 0 (0.0%) |
| Public Administration | 5 (62.5%) | 3 (37.5%) |
| Total | 104 (60.1%) | 69 (39.9%) |
Education in Fairwater
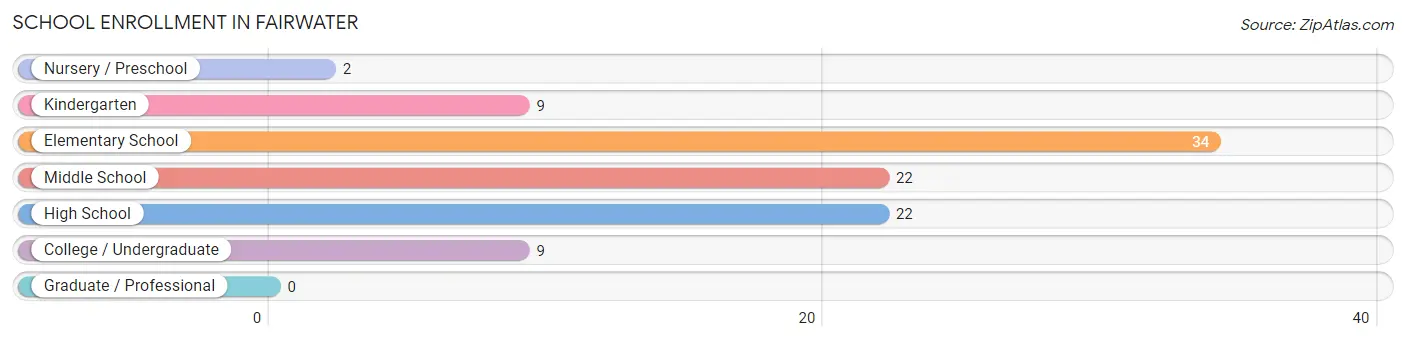
School Enrollment in Fairwater
The most common levels of schooling among the 98 students in Fairwater are elementary school (34 | 34.7%), middle school (22 | 22.5%), and high school (22 | 22.5%).
| School Level | # Students | % Students |
| Nursery / Preschool | 2 | 2.0% |
| Kindergarten | 9 | 9.2% |
| Elementary School | 34 | 34.7% |
| Middle School | 22 | 22.5% |
| High School | 22 | 22.5% |
| College / Undergraduate | 9 | 9.2% |
| Graduate / Professional | 0 | 0.0% |
| Total | 98 | 100.0% |
School Enrollment by Age by Funding Source in Fairwater
Out of a total of 98 students who are enrolled in schools in Fairwater, 14 (14.3%) attend a private institution, while the remaining 84 (85.7%) are enrolled in public schools. The age group of 10 to 14 year olds has the highest likelihood of being enrolled in private schools, with 7 (25.9% in the age bracket) enrolled. Conversely, the age group of 15 to 17 year olds has the lowest likelihood of being enrolled in a private school, with 19 (100.0% in the age bracket) attending a public institution.
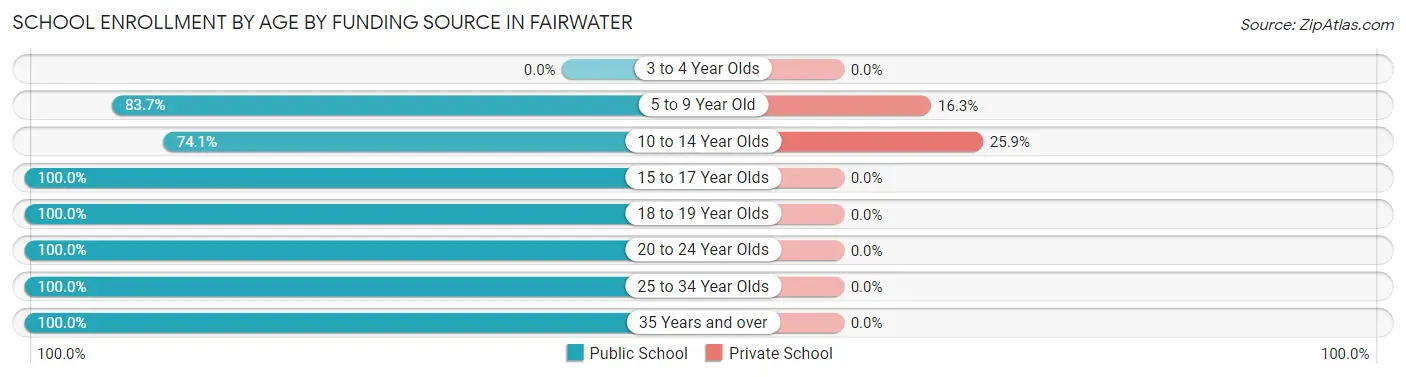
| Age Bracket | Public School | Private School |
| 3 to 4 Year Olds | 0 (0.0%) | 0 (0.0%) |
| 5 to 9 Year Old | 36 (83.7%) | 7 (16.3%) |
| 10 to 14 Year Olds | 20 (74.1%) | 7 (25.9%) |
| 15 to 17 Year Olds | 19 (100.0%) | 0 (0.0%) |
| 18 to 19 Year Olds | 3 (100.0%) | 0 (0.0%) |
| 20 to 24 Year Olds | 2 (100.0%) | 0 (0.0%) |
| 25 to 34 Year Olds | 1 (100.0%) | 0 (0.0%) |
| 35 Years and over | 3 (100.0%) | 0 (0.0%) |
| Total | 84 (85.7%) | 14 (14.3%) |
Educational Attainment by Field of Study in Fairwater
Business (15 | 37.5%), science & technology (6 | 15.0%), education (6 | 15.0%), bio, nature & agricultural (5 | 12.5%), and psychology (4 | 10.0%) are the most common fields of study among 40 individuals in Fairwater who have obtained a bachelor's degree or higher.
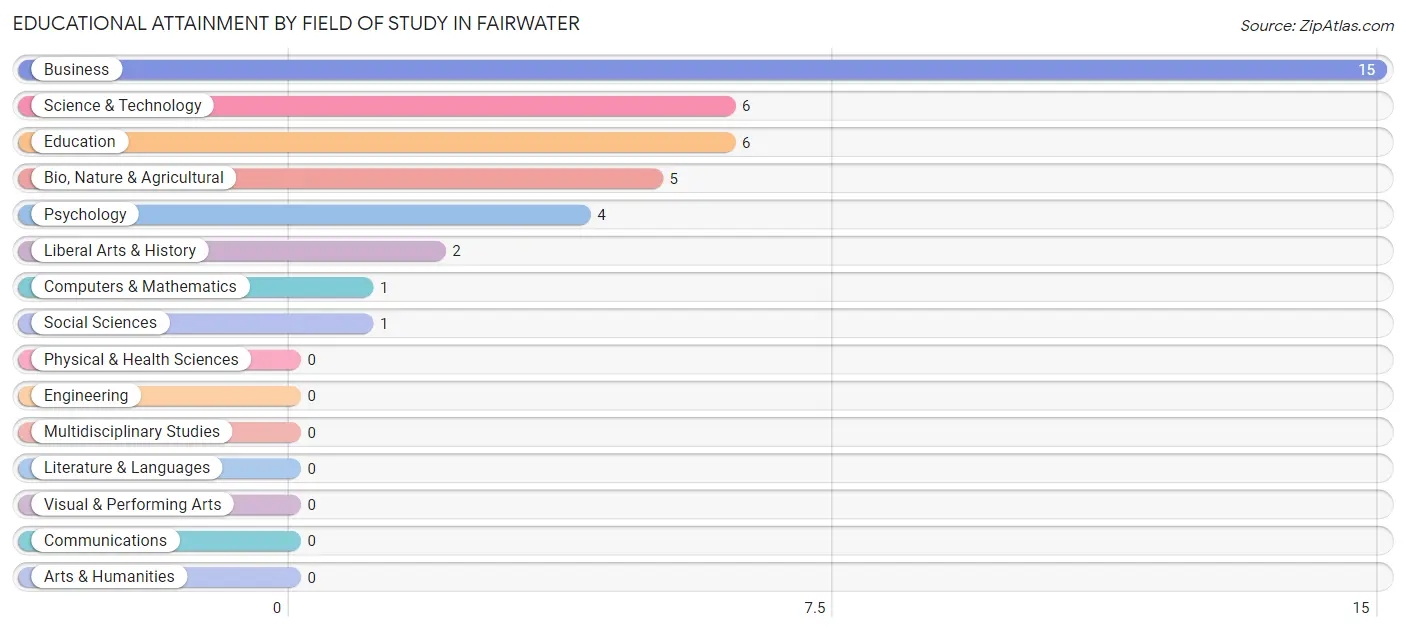
| Field of Study | # Graduates | % Graduates |
| Computers & Mathematics | 1 | 2.5% |
| Bio, Nature & Agricultural | 5 | 12.5% |
| Physical & Health Sciences | 0 | 0.0% |
| Psychology | 4 | 10.0% |
| Social Sciences | 1 | 2.5% |
| Engineering | 0 | 0.0% |
| Multidisciplinary Studies | 0 | 0.0% |
| Science & Technology | 6 | 15.0% |
| Business | 15 | 37.5% |
| Education | 6 | 15.0% |
| Literature & Languages | 0 | 0.0% |
| Liberal Arts & History | 2 | 5.0% |
| Visual & Performing Arts | 0 | 0.0% |
| Communications | 0 | 0.0% |
| Arts & Humanities | 0 | 0.0% |
| Total | 40 | 100.0% |
Transportation & Commute in Fairwater
Vehicle Availability by Sex in Fairwater
The most prevalent vehicle ownership categories in Fairwater are males with 2 vehicles (36, accounting for 34.6%) and females with 2 vehicles (27, making up 52.2%).
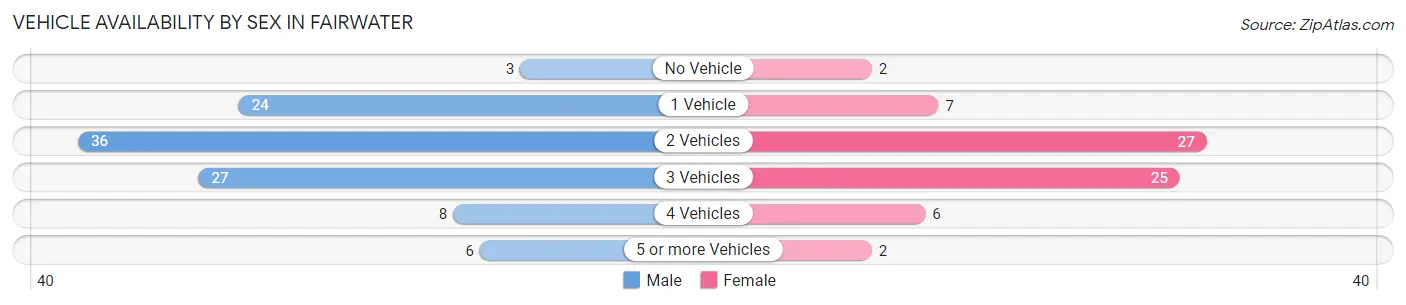
| Vehicles Available | Male | Female |
| No Vehicle | 3 (2.9%) | 2 (2.9%) |
| 1 Vehicle | 24 (23.1%) | 7 (10.1%) |
| 2 Vehicles | 36 (34.6%) | 27 (39.1%) |
| 3 Vehicles | 27 (26.0%) | 25 (36.2%) |
| 4 Vehicles | 8 (7.7%) | 6 (8.7%) |
| 5 or more Vehicles | 6 (5.8%) | 2 (2.9%) |
| Total | 104 (100.0%) | 69 (100.0%) |
Commute Time in Fairwater
The most frequently occuring commute durations in Fairwater are 15 to 19 minutes (31 commuters, 19.0%), 10 to 14 minutes (26 commuters, 16.0%), and 30 to 34 minutes (24 commuters, 14.7%).
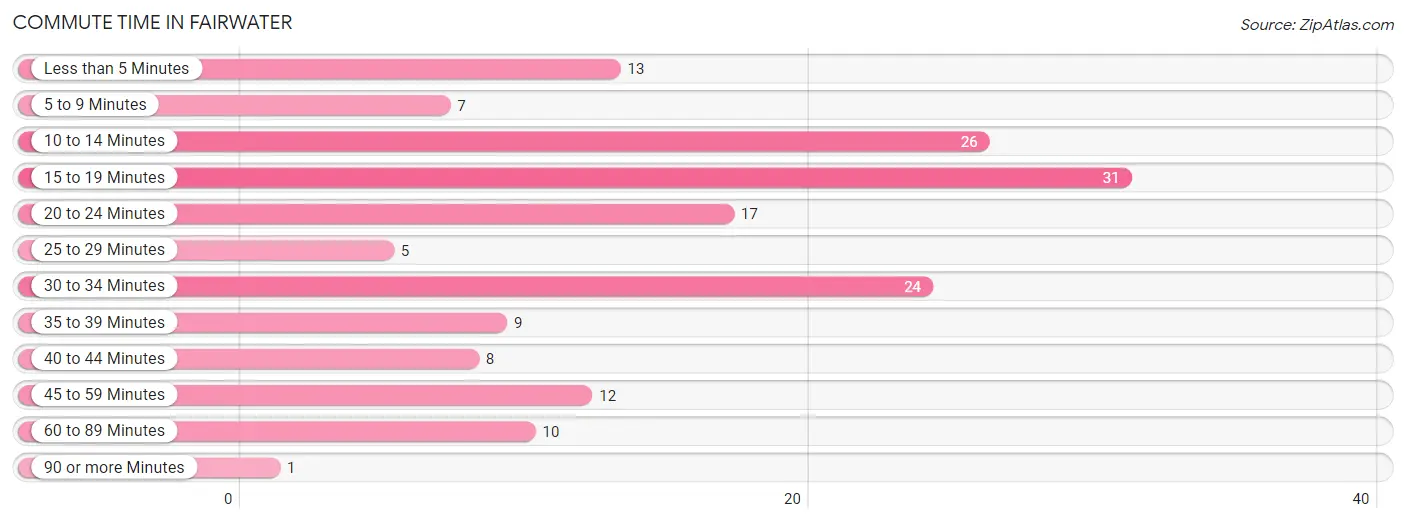
| Commute Time | # Commuters | % Commuters |
| Less than 5 Minutes | 13 | 8.0% |
| 5 to 9 Minutes | 7 | 4.3% |
| 10 to 14 Minutes | 26 | 16.0% |
| 15 to 19 Minutes | 31 | 19.0% |
| 20 to 24 Minutes | 17 | 10.4% |
| 25 to 29 Minutes | 5 | 3.1% |
| 30 to 34 Minutes | 24 | 14.7% |
| 35 to 39 Minutes | 9 | 5.5% |
| 40 to 44 Minutes | 8 | 4.9% |
| 45 to 59 Minutes | 12 | 7.4% |
| 60 to 89 Minutes | 10 | 6.1% |
| 90 or more Minutes | 1 | 0.6% |
Commute Time by Sex in Fairwater
The most common commute times in Fairwater are 10 to 14 minutes (18 commuters, 18.4%) for males and 15 to 19 minutes (13 commuters, 20.0%) for females.
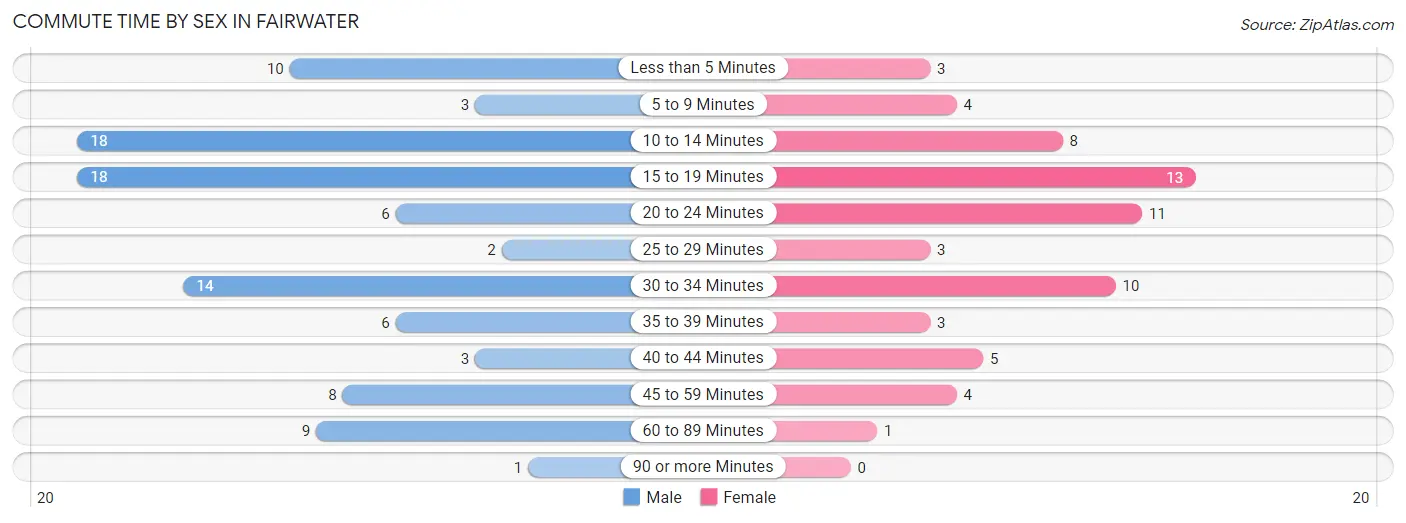
| Commute Time | Male | Female |
| Less than 5 Minutes | 10 (10.2%) | 3 (4.6%) |
| 5 to 9 Minutes | 3 (3.1%) | 4 (6.1%) |
| 10 to 14 Minutes | 18 (18.4%) | 8 (12.3%) |
| 15 to 19 Minutes | 18 (18.4%) | 13 (20.0%) |
| 20 to 24 Minutes | 6 (6.1%) | 11 (16.9%) |
| 25 to 29 Minutes | 2 (2.0%) | 3 (4.6%) |
| 30 to 34 Minutes | 14 (14.3%) | 10 (15.4%) |
| 35 to 39 Minutes | 6 (6.1%) | 3 (4.6%) |
| 40 to 44 Minutes | 3 (3.1%) | 5 (7.7%) |
| 45 to 59 Minutes | 8 (8.2%) | 4 (6.1%) |
| 60 to 89 Minutes | 9 (9.2%) | 1 (1.5%) |
| 90 or more Minutes | 1 (1.0%) | 0 (0.0%) |
Time of Departure to Work by Sex in Fairwater
The most frequent times of departure to work in Fairwater are 12:00 AM to 4:59 AM (20, 20.4%) for males and 8:00 AM to 8:29 AM (19, 29.2%) for females.
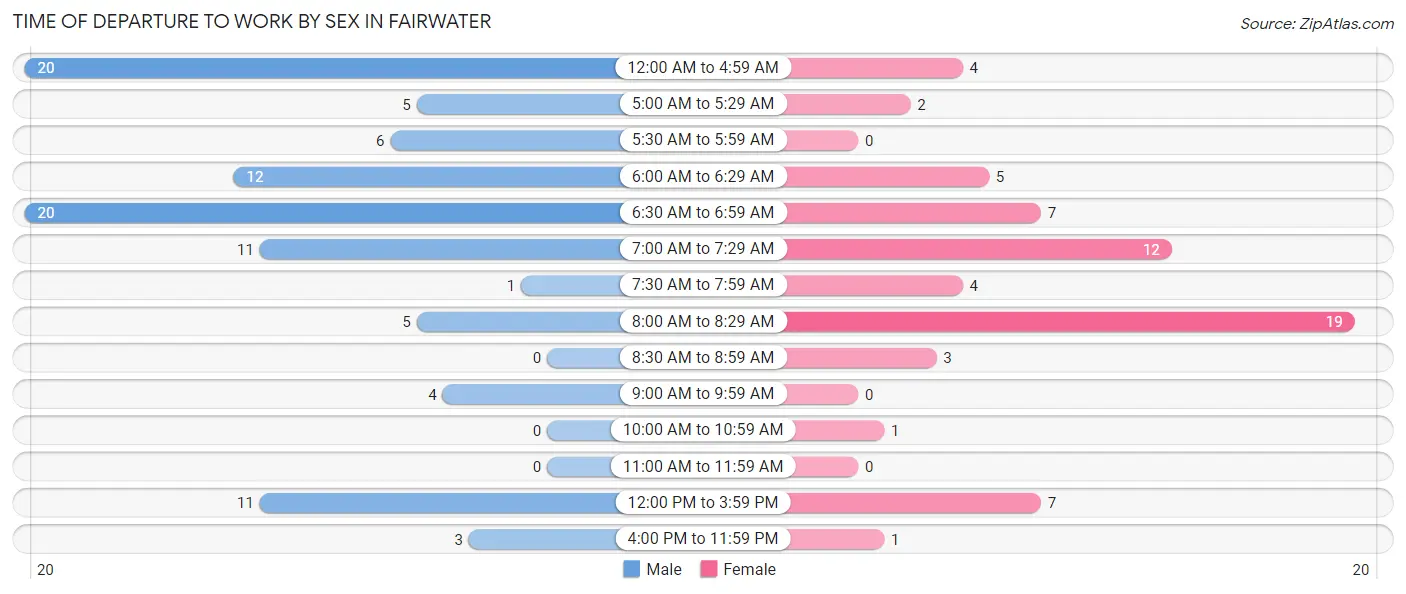
| Time of Departure | Male | Female |
| 12:00 AM to 4:59 AM | 20 (20.4%) | 4 (6.1%) |
| 5:00 AM to 5:29 AM | 5 (5.1%) | 2 (3.1%) |
| 5:30 AM to 5:59 AM | 6 (6.1%) | 0 (0.0%) |
| 6:00 AM to 6:29 AM | 12 (12.2%) | 5 (7.7%) |
| 6:30 AM to 6:59 AM | 20 (20.4%) | 7 (10.8%) |
| 7:00 AM to 7:29 AM | 11 (11.2%) | 12 (18.5%) |
| 7:30 AM to 7:59 AM | 1 (1.0%) | 4 (6.1%) |
| 8:00 AM to 8:29 AM | 5 (5.1%) | 19 (29.2%) |
| 8:30 AM to 8:59 AM | 0 (0.0%) | 3 (4.6%) |
| 9:00 AM to 9:59 AM | 4 (4.1%) | 0 (0.0%) |
| 10:00 AM to 10:59 AM | 0 (0.0%) | 1 (1.5%) |
| 11:00 AM to 11:59 AM | 0 (0.0%) | 0 (0.0%) |
| 12:00 PM to 3:59 PM | 11 (11.2%) | 7 (10.8%) |
| 4:00 PM to 11:59 PM | 3 (3.1%) | 1 (1.5%) |
| Total | 98 (100.0%) | 65 (100.0%) |
Housing Occupancy in Fairwater
Occupancy by Ownership in Fairwater
Of the total 131 dwellings in Fairwater, owner-occupied units account for 101 (77.1%), while renter-occupied units make up 30 (22.9%).
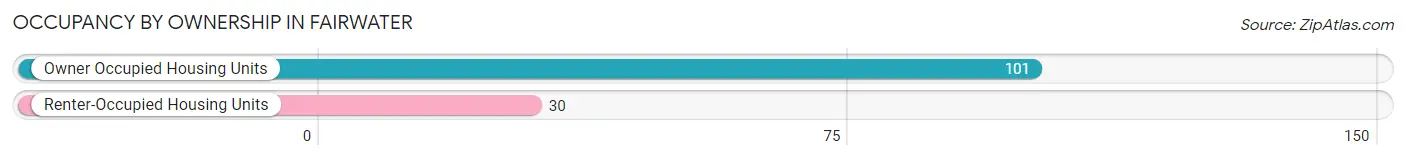
| Occupancy | # Housing Units | % Housing Units |
| Owner Occupied Housing Units | 101 | 77.1% |
| Renter-Occupied Housing Units | 30 | 22.9% |
| Total Occupied Housing Units | 131 | 100.0% |
Occupancy by Household Size in Fairwater
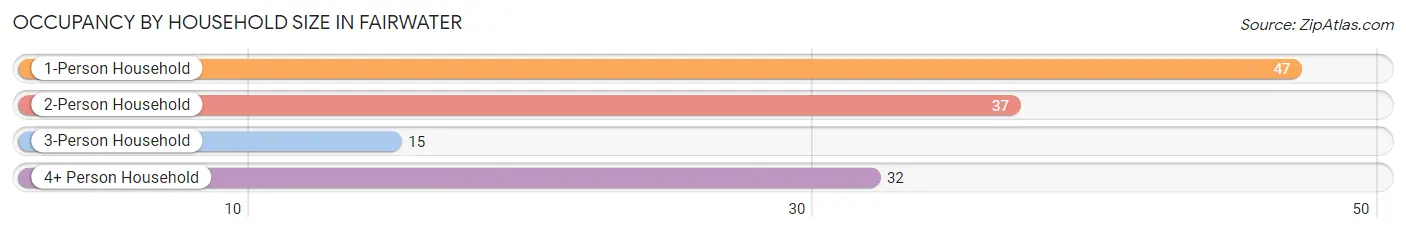
| Household Size | # Housing Units | % Housing Units |
| 1-Person Household | 47 | 35.9% |
| 2-Person Household | 37 | 28.2% |
| 3-Person Household | 15 | 11.5% |
| 4+ Person Household | 32 | 24.4% |
| Total Housing Units | 131 | 100.0% |
Occupancy by Ownership by Household Size in Fairwater
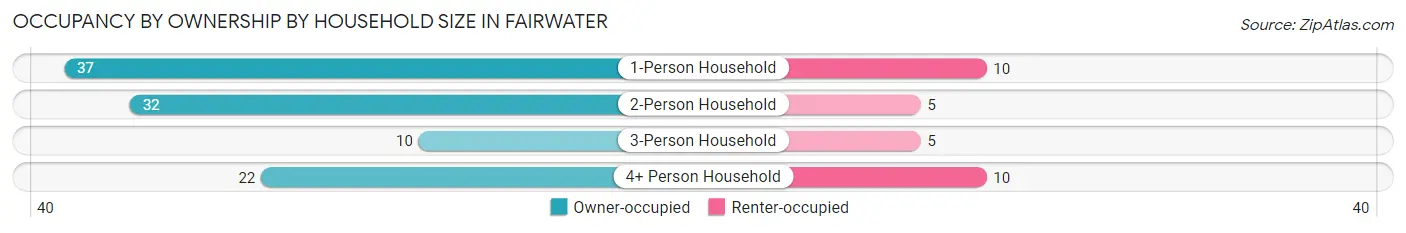
| Household Size | Owner-occupied | Renter-occupied |
| 1-Person Household | 37 (78.7%) | 10 (21.3%) |
| 2-Person Household | 32 (86.5%) | 5 (13.5%) |
| 3-Person Household | 10 (66.7%) | 5 (33.3%) |
| 4+ Person Household | 22 (68.8%) | 10 (31.2%) |
| Total Housing Units | 101 (77.1%) | 30 (22.9%) |
Occupancy by Educational Attainment in Fairwater
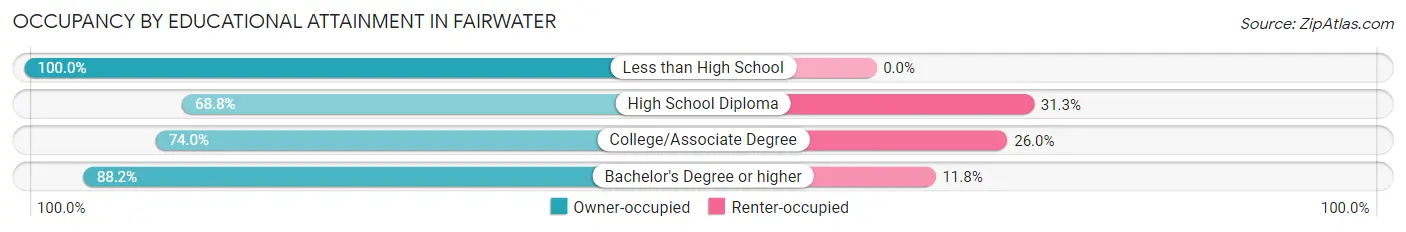
| Household Size | Owner-occupied | Renter-occupied |
| Less than High School | 16 (100.0%) | 0 (0.0%) |
| High School Diploma | 33 (68.8%) | 15 (31.2%) |
| College/Associate Degree | 37 (74.0%) | 13 (26.0%) |
| Bachelor's Degree or higher | 15 (88.2%) | 2 (11.8%) |
Occupancy by Age of Householder in Fairwater
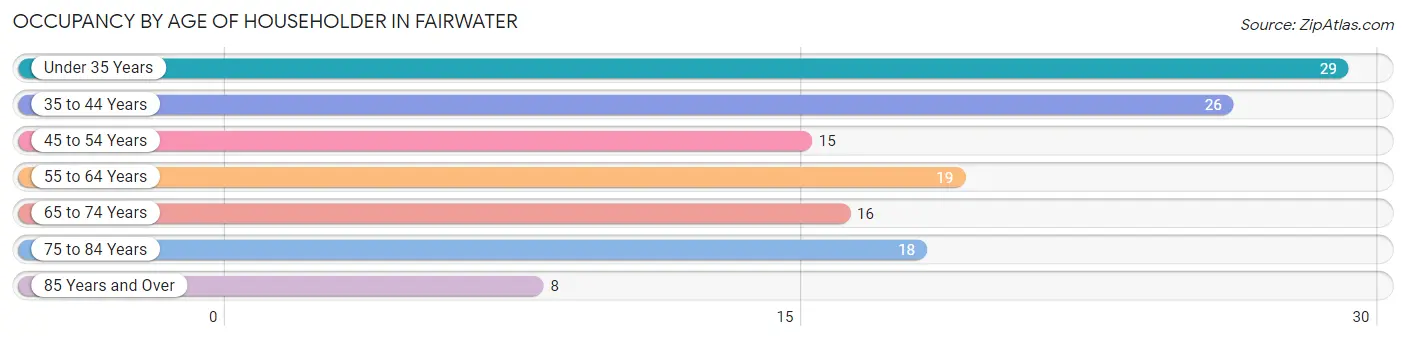
| Age Bracket | # Households | % Households |
| Under 35 Years | 29 | 22.1% |
| 35 to 44 Years | 26 | 19.9% |
| 45 to 54 Years | 15 | 11.5% |
| 55 to 64 Years | 19 | 14.5% |
| 65 to 74 Years | 16 | 12.2% |
| 75 to 84 Years | 18 | 13.7% |
| 85 Years and Over | 8 | 6.1% |
| Total | 131 | 100.0% |
Housing Finances in Fairwater
Median Income by Occupancy in Fairwater
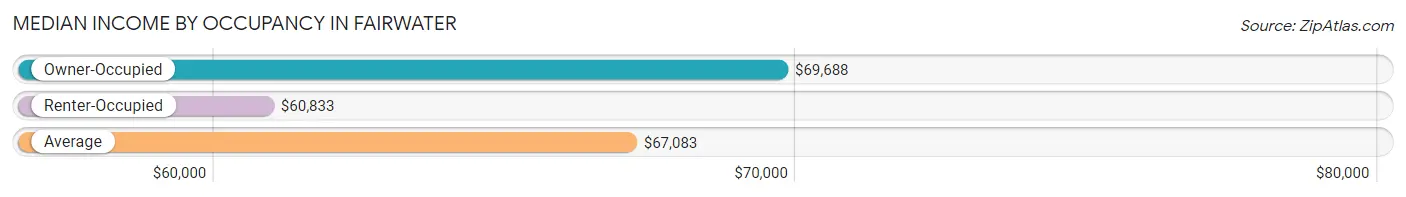
| Occupancy Type | # Households | Median Income |
| Owner-Occupied | 101 (77.1%) | $69,688 |
| Renter-Occupied | 30 (22.9%) | $60,833 |
| Average | 131 (100.0%) | $67,083 |
Occupancy by Householder Income Bracket in Fairwater
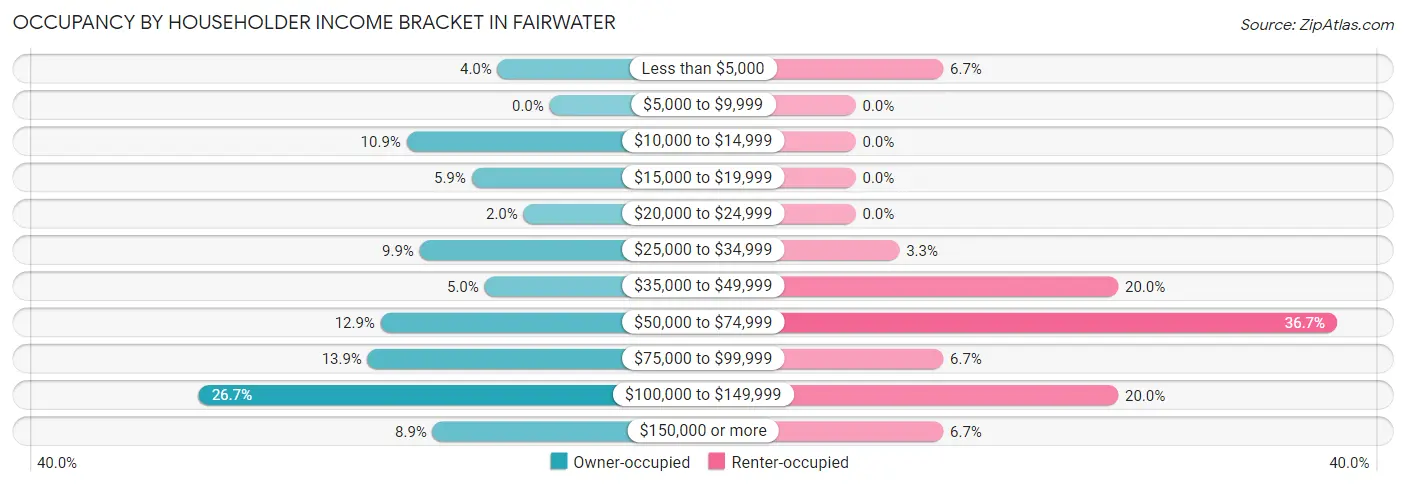
| Income Bracket | Owner-occupied | Renter-occupied |
| Less than $5,000 | 4 (4.0%) | 2 (6.7%) |
| $5,000 to $9,999 | 0 (0.0%) | 0 (0.0%) |
| $10,000 to $14,999 | 11 (10.9%) | 0 (0.0%) |
| $15,000 to $19,999 | 6 (5.9%) | 0 (0.0%) |
| $20,000 to $24,999 | 2 (2.0%) | 0 (0.0%) |
| $25,000 to $34,999 | 10 (9.9%) | 1 (3.3%) |
| $35,000 to $49,999 | 5 (5.0%) | 6 (20.0%) |
| $50,000 to $74,999 | 13 (12.9%) | 11 (36.7%) |
| $75,000 to $99,999 | 14 (13.9%) | 2 (6.7%) |
| $100,000 to $149,999 | 27 (26.7%) | 6 (20.0%) |
| $150,000 or more | 9 (8.9%) | 2 (6.7%) |
| Total | 101 (100.0%) | 30 (100.0%) |
Monthly Housing Cost Tiers in Fairwater
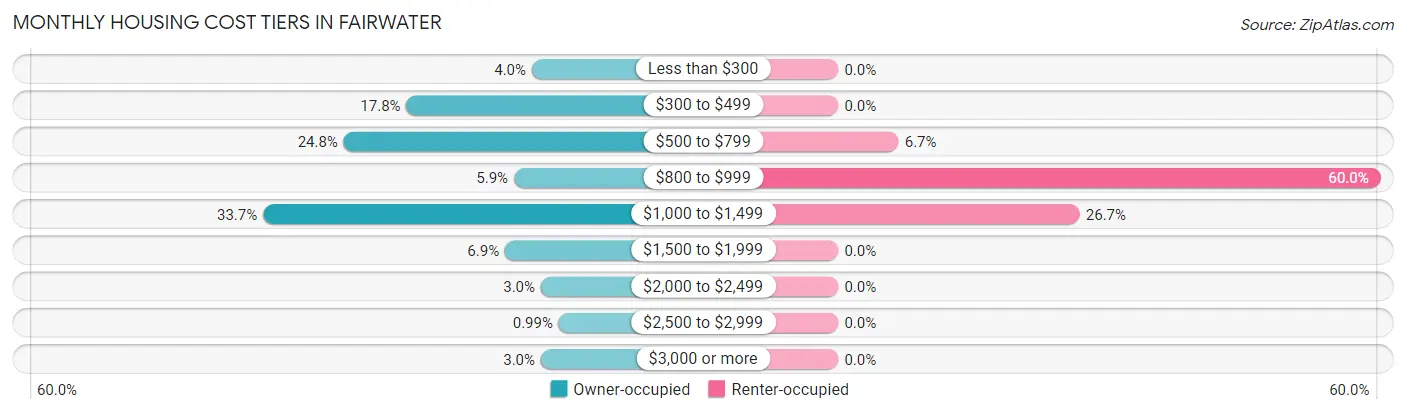
| Monthly Cost | Owner-occupied | Renter-occupied |
| Less than $300 | 4 (4.0%) | 0 (0.0%) |
| $300 to $499 | 18 (17.8%) | 0 (0.0%) |
| $500 to $799 | 25 (24.7%) | 2 (6.7%) |
| $800 to $999 | 6 (5.9%) | 18 (60.0%) |
| $1,000 to $1,499 | 34 (33.7%) | 8 (26.7%) |
| $1,500 to $1,999 | 7 (6.9%) | 0 (0.0%) |
| $2,000 to $2,499 | 3 (3.0%) | 0 (0.0%) |
| $2,500 to $2,999 | 1 (1.0%) | 0 (0.0%) |
| $3,000 or more | 3 (3.0%) | 0 (0.0%) |
| Total | 101 (100.0%) | 30 (100.0%) |
Physical Housing Characteristics in Fairwater
Housing Structures in Fairwater
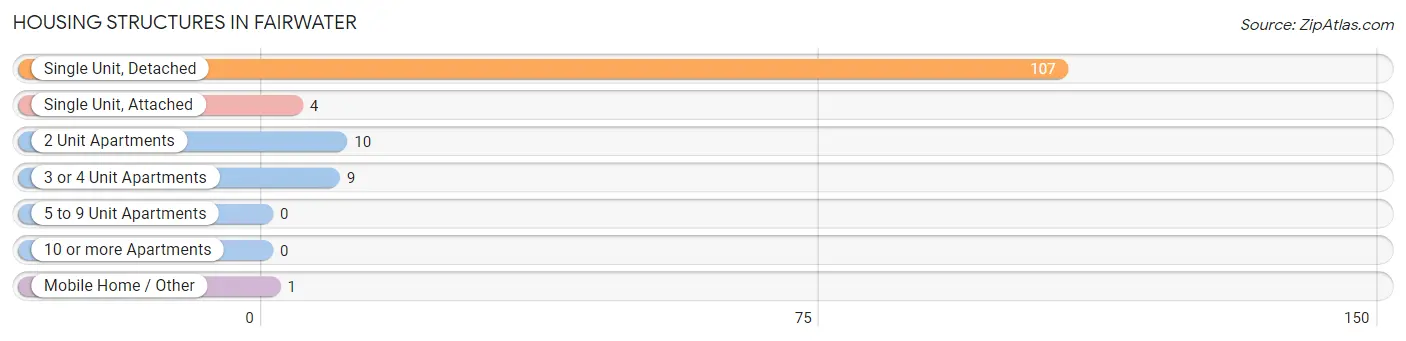
| Structure Type | # Housing Units | % Housing Units |
| Single Unit, Detached | 107 | 81.7% |
| Single Unit, Attached | 4 | 3.0% |
| 2 Unit Apartments | 10 | 7.6% |
| 3 or 4 Unit Apartments | 9 | 6.9% |
| 5 to 9 Unit Apartments | 0 | 0.0% |
| 10 or more Apartments | 0 | 0.0% |
| Mobile Home / Other | 1 | 0.8% |
| Total | 131 | 100.0% |
Housing Structures by Occupancy in Fairwater
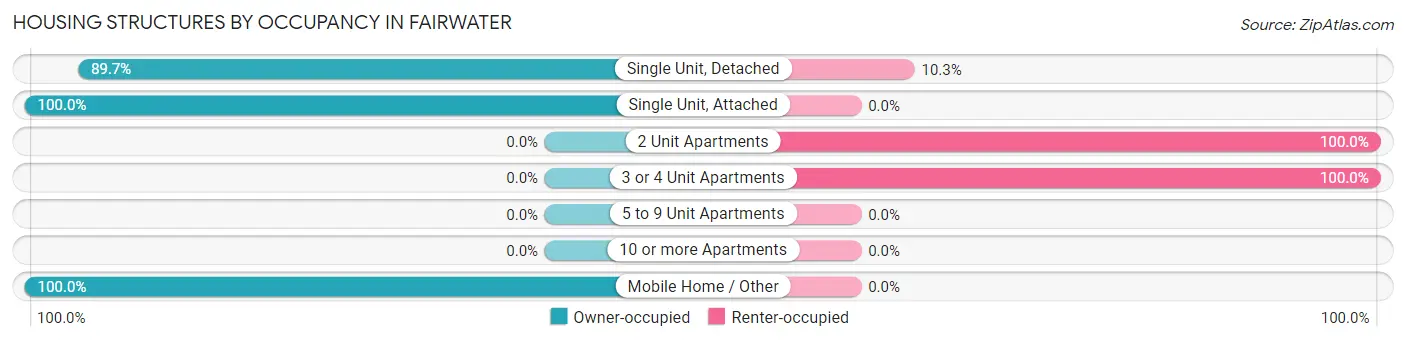
| Structure Type | Owner-occupied | Renter-occupied |
| Single Unit, Detached | 96 (89.7%) | 11 (10.3%) |
| Single Unit, Attached | 4 (100.0%) | 0 (0.0%) |
| 2 Unit Apartments | 0 (0.0%) | 10 (100.0%) |
| 3 or 4 Unit Apartments | 0 (0.0%) | 9 (100.0%) |
| 5 to 9 Unit Apartments | 0 (0.0%) | 0 (0.0%) |
| 10 or more Apartments | 0 (0.0%) | 0 (0.0%) |
| Mobile Home / Other | 1 (100.0%) | 0 (0.0%) |
| Total | 101 (77.1%) | 30 (22.9%) |
Housing Structures by Number of Rooms in Fairwater
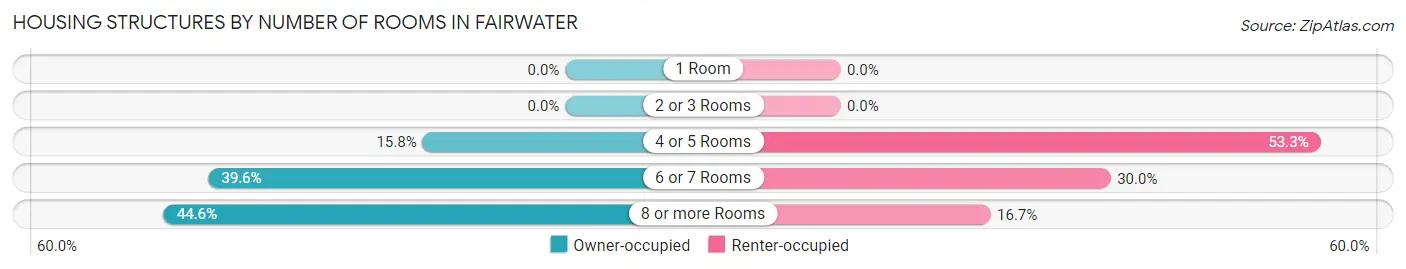
| Number of Rooms | Owner-occupied | Renter-occupied |
| 1 Room | 0 (0.0%) | 0 (0.0%) |
| 2 or 3 Rooms | 0 (0.0%) | 0 (0.0%) |
| 4 or 5 Rooms | 16 (15.8%) | 16 (53.3%) |
| 6 or 7 Rooms | 40 (39.6%) | 9 (30.0%) |
| 8 or more Rooms | 45 (44.6%) | 5 (16.7%) |
| Total | 101 (100.0%) | 30 (100.0%) |
Housing Structure by Heating Type in Fairwater
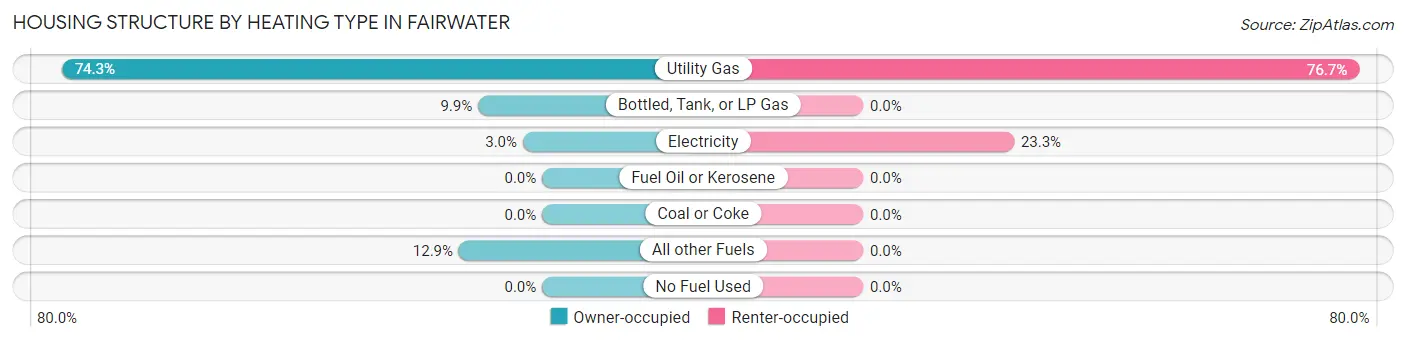
| Heating Type | Owner-occupied | Renter-occupied |
| Utility Gas | 75 (74.3%) | 23 (76.7%) |
| Bottled, Tank, or LP Gas | 10 (9.9%) | 0 (0.0%) |
| Electricity | 3 (3.0%) | 7 (23.3%) |
| Fuel Oil or Kerosene | 0 (0.0%) | 0 (0.0%) |
| Coal or Coke | 0 (0.0%) | 0 (0.0%) |
| All other Fuels | 13 (12.9%) | 0 (0.0%) |
| No Fuel Used | 0 (0.0%) | 0 (0.0%) |
| Total | 101 (100.0%) | 30 (100.0%) |
Household Vehicle Usage in Fairwater
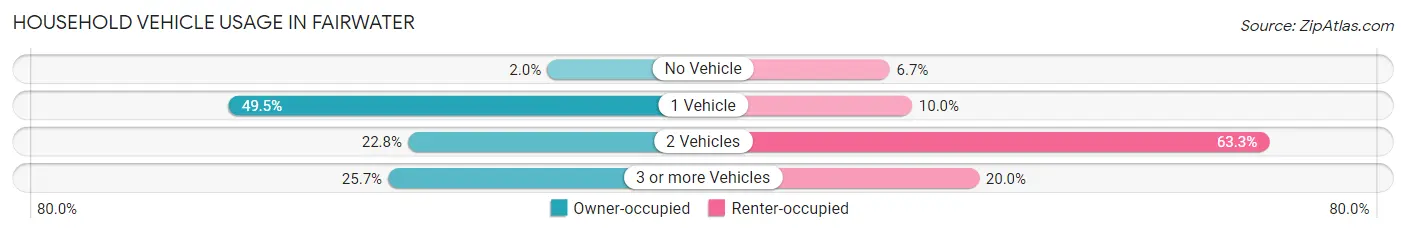
| Vehicles per Household | Owner-occupied | Renter-occupied |
| No Vehicle | 2 (2.0%) | 2 (6.7%) |
| 1 Vehicle | 50 (49.5%) | 3 (10.0%) |
| 2 Vehicles | 23 (22.8%) | 19 (63.3%) |
| 3 or more Vehicles | 26 (25.7%) | 6 (20.0%) |
| Total | 101 (100.0%) | 30 (100.0%) |
Real Estate & Mortgages in Fairwater
Real Estate and Mortgage Overview in Fairwater
| Characteristic | Without Mortgage | With Mortgage |
| Housing Units | 36 | 65 |
| Median Property Value | $118,200 | $119,500 |
| Median Household Income | $58,750 | $3 |
| Monthly Housing Costs | $464 | $3 |
| Real Estate Taxes | $2,235 | $2 |
Property Value by Mortgage Status in Fairwater
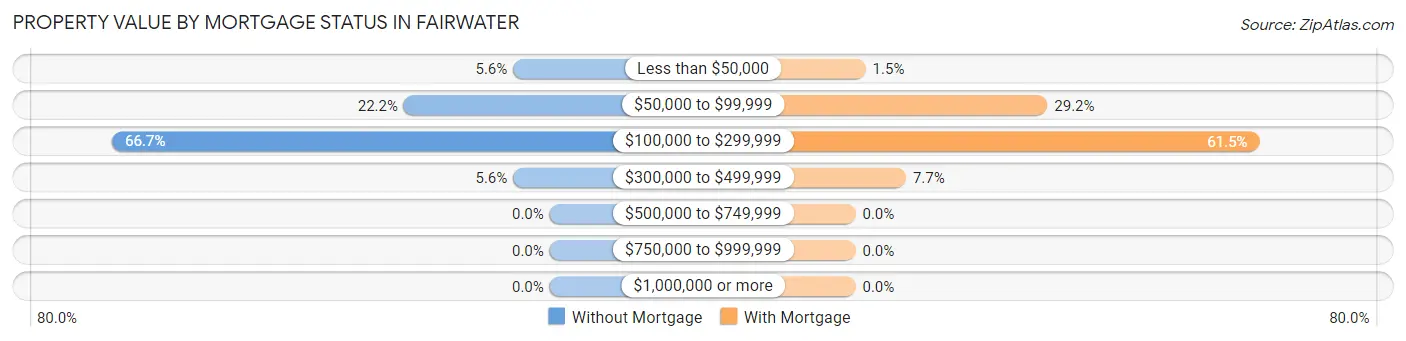
| Property Value | Without Mortgage | With Mortgage |
| Less than $50,000 | 2 (5.6%) | 1 (1.5%) |
| $50,000 to $99,999 | 8 (22.2%) | 19 (29.2%) |
| $100,000 to $299,999 | 24 (66.7%) | 40 (61.5%) |
| $300,000 to $499,999 | 2 (5.6%) | 5 (7.7%) |
| $500,000 to $749,999 | 0 (0.0%) | 0 (0.0%) |
| $750,000 to $999,999 | 0 (0.0%) | 0 (0.0%) |
| $1,000,000 or more | 0 (0.0%) | 0 (0.0%) |
| Total | 36 (100.0%) | 65 (100.0%) |
Household Income by Mortgage Status in Fairwater
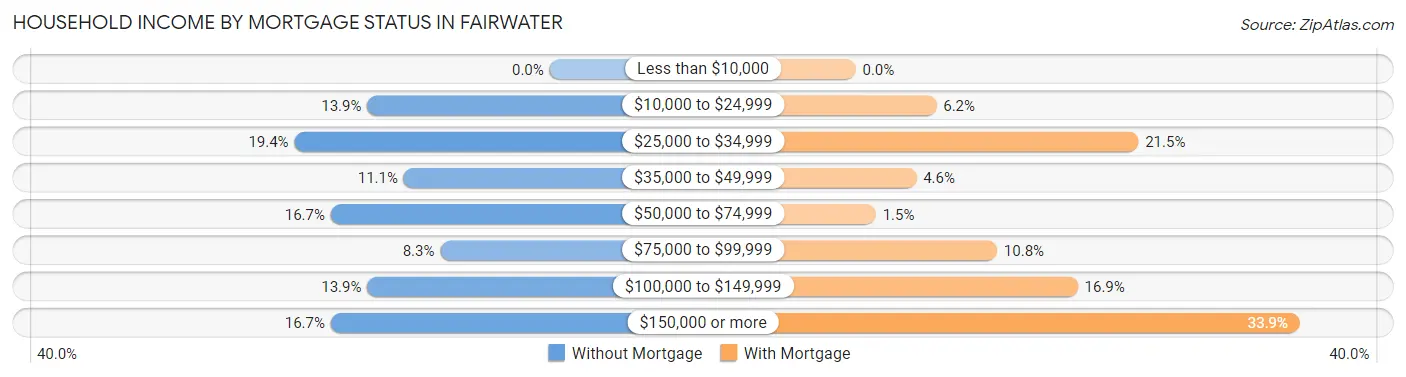
| Household Income | Without Mortgage | With Mortgage |
| Less than $10,000 | 0 (0.0%) | 0 (0.0%) |
| $10,000 to $24,999 | 5 (13.9%) | 4 (6.1%) |
| $25,000 to $34,999 | 7 (19.4%) | 14 (21.5%) |
| $35,000 to $49,999 | 4 (11.1%) | 3 (4.6%) |
| $50,000 to $74,999 | 6 (16.7%) | 1 (1.5%) |
| $75,000 to $99,999 | 3 (8.3%) | 7 (10.8%) |
| $100,000 to $149,999 | 5 (13.9%) | 11 (16.9%) |
| $150,000 or more | 6 (16.7%) | 22 (33.9%) |
| Total | 36 (100.0%) | 65 (100.0%) |
Property Value to Household Income Ratio in Fairwater
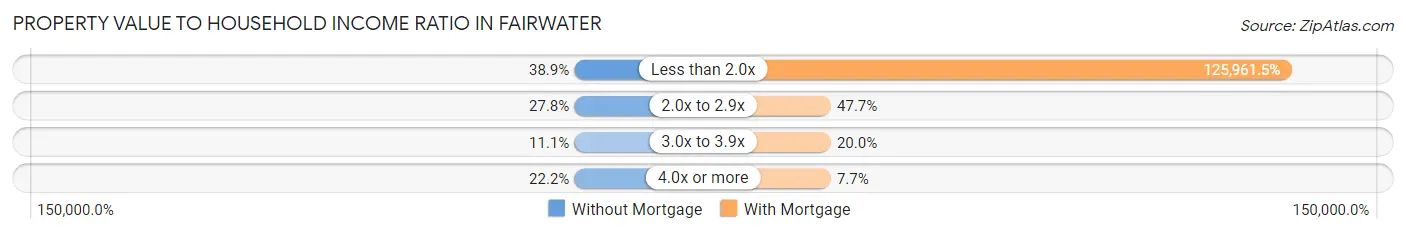
| Value-to-Income Ratio | Without Mortgage | With Mortgage |
| Less than 2.0x | 14 (38.9%) | 81,875 (125,961.5%) |
| 2.0x to 2.9x | 10 (27.8%) | 31 (47.7%) |
| 3.0x to 3.9x | 4 (11.1%) | 13 (20.0%) |
| 4.0x or more | 8 (22.2%) | 5 (7.7%) |
| Total | 36 (100.0%) | 65 (100.0%) |
Real Estate Taxes by Mortgage Status in Fairwater
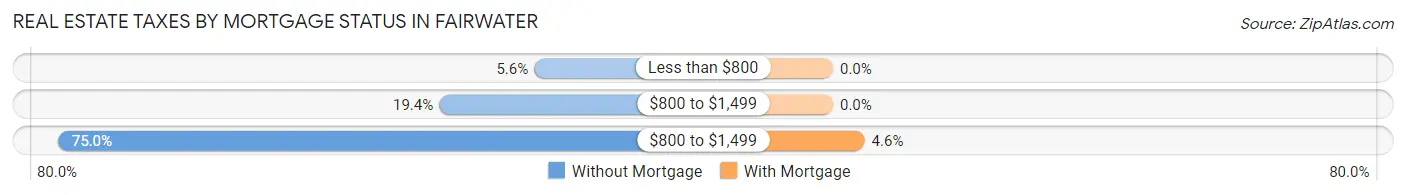
| Property Taxes | Without Mortgage | With Mortgage |
| Less than $800 | 2 (5.6%) | 0 (0.0%) |
| $800 to $1,499 | 7 (19.4%) | 0 (0.0%) |
| $800 to $1,499 | 27 (75.0%) | 3 (4.6%) |
| Total | 36 (100.0%) | 65 (100.0%) |
Health & Disability in Fairwater
Health Insurance Coverage by Age in Fairwater
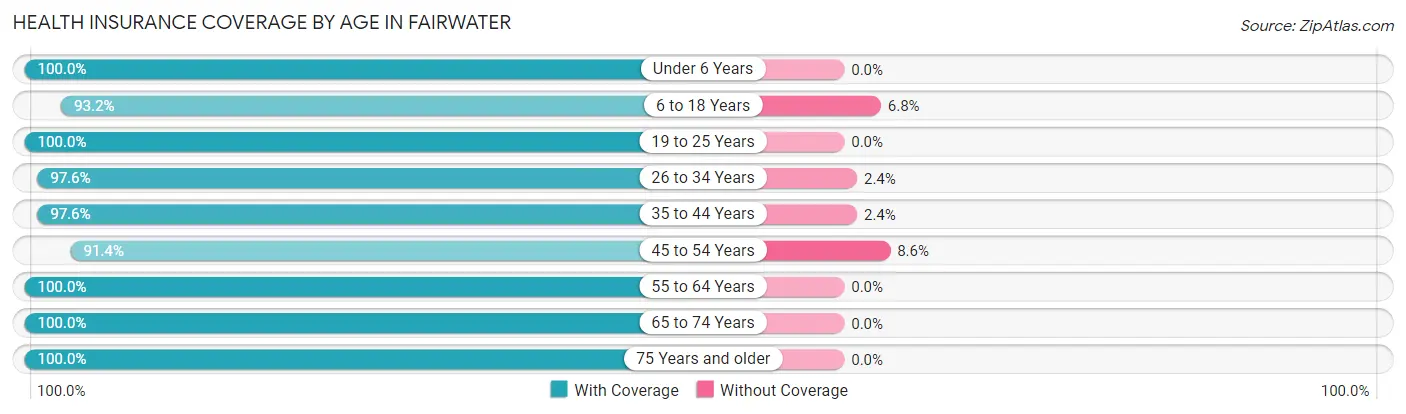
| Age Bracket | With Coverage | Without Coverage |
| Under 6 Years | 30 (100.0%) | 0 (0.0%) |
| 6 to 18 Years | 82 (93.2%) | 6 (6.8%) |
| 19 to 25 Years | 16 (100.0%) | 0 (0.0%) |
| 26 to 34 Years | 41 (97.6%) | 1 (2.4%) |
| 35 to 44 Years | 41 (97.6%) | 1 (2.4%) |
| 45 to 54 Years | 32 (91.4%) | 3 (8.6%) |
| 55 to 64 Years | 34 (100.0%) | 0 (0.0%) |
| 65 to 74 Years | 19 (100.0%) | 0 (0.0%) |
| 75 Years and older | 33 (100.0%) | 0 (0.0%) |
| Total | 328 (96.8%) | 11 (3.2%) |
Health Insurance Coverage by Citizenship Status in Fairwater
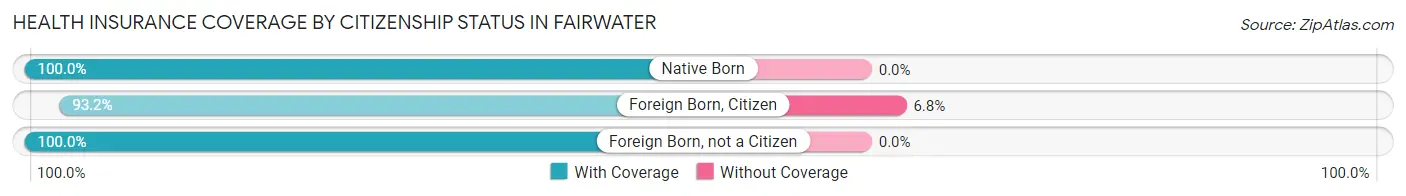
| Citizenship Status | With Coverage | Without Coverage |
| Native Born | 30 (100.0%) | 0 (0.0%) |
| Foreign Born, Citizen | 82 (93.2%) | 6 (6.8%) |
| Foreign Born, not a Citizen | 16 (100.0%) | 0 (0.0%) |
Health Insurance Coverage by Household Income in Fairwater
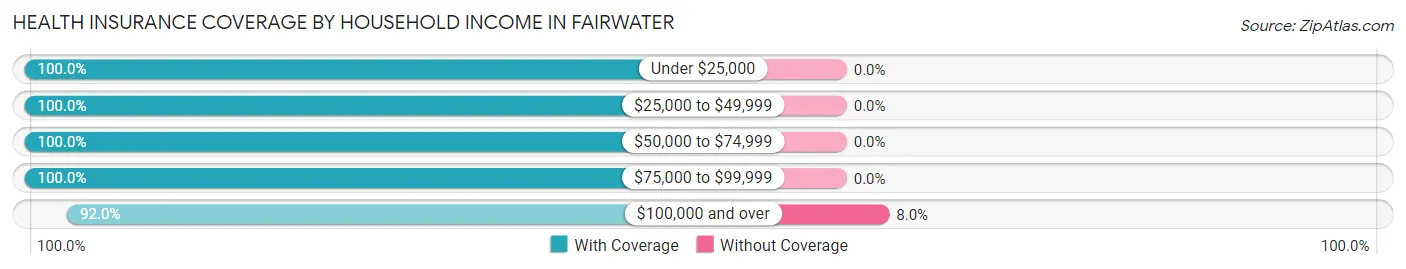
| Household Income | With Coverage | Without Coverage |
| Under $25,000 | 37 (100.0%) | 0 (0.0%) |
| $25,000 to $49,999 | 81 (100.0%) | 0 (0.0%) |
| $50,000 to $74,999 | 40 (100.0%) | 0 (0.0%) |
| $75,000 to $99,999 | 43 (100.0%) | 0 (0.0%) |
| $100,000 and over | 127 (92.0%) | 11 (8.0%) |
Public vs Private Health Insurance Coverage by Age in Fairwater
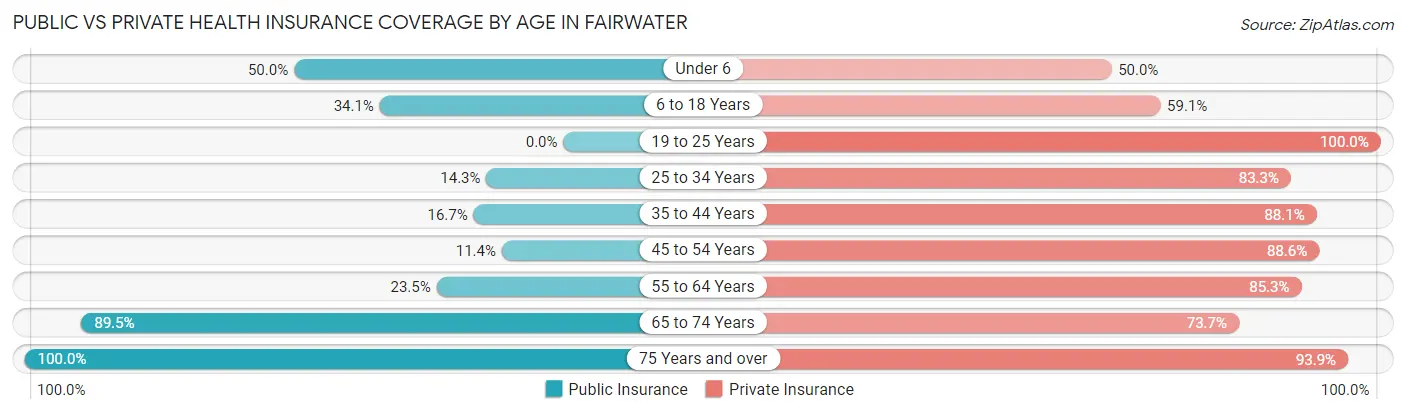
| Age Bracket | Public Insurance | Private Insurance |
| Under 6 | 15 (50.0%) | 15 (50.0%) |
| 6 to 18 Years | 30 (34.1%) | 52 (59.1%) |
| 19 to 25 Years | 0 (0.0%) | 16 (100.0%) |
| 25 to 34 Years | 6 (14.3%) | 35 (83.3%) |
| 35 to 44 Years | 7 (16.7%) | 37 (88.1%) |
| 45 to 54 Years | 4 (11.4%) | 31 (88.6%) |
| 55 to 64 Years | 8 (23.5%) | 29 (85.3%) |
| 65 to 74 Years | 17 (89.5%) | 14 (73.7%) |
| 75 Years and over | 33 (100.0%) | 31 (93.9%) |
| Total | 120 (35.4%) | 260 (76.7%) |
Disability Status by Sex by Age in Fairwater
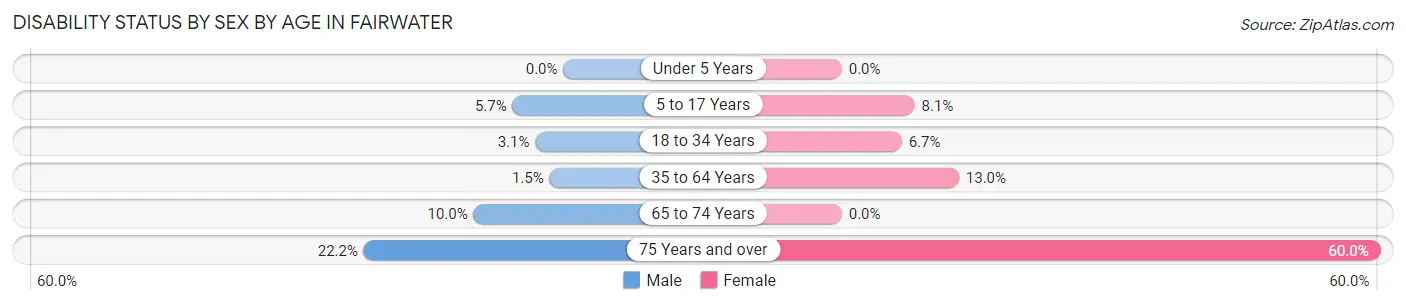
| Age Bracket | Male | Female |
| Under 5 Years | 0 (0.0%) | 0 (0.0%) |
| 5 to 17 Years | 3 (5.7%) | 3 (8.1%) |
| 18 to 34 Years | 1 (3.1%) | 2 (6.7%) |
| 35 to 64 Years | 1 (1.5%) | 6 (13.0%) |
| 65 to 74 Years | 1 (10.0%) | 0 (0.0%) |
| 75 Years and over | 4 (22.2%) | 9 (60.0%) |
Disability Class by Sex by Age in Fairwater
Disability Class: Hearing Difficulty
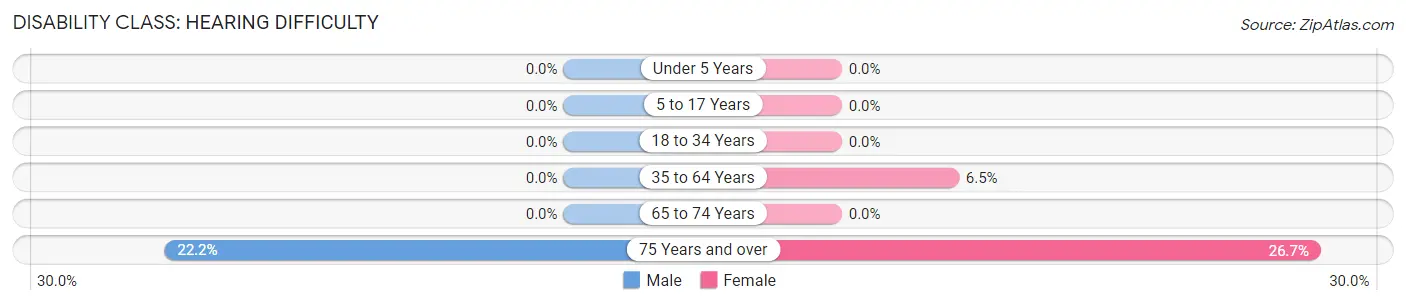
| Age Bracket | Male | Female |
| Under 5 Years | 0 (0.0%) | 0 (0.0%) |
| 5 to 17 Years | 0 (0.0%) | 0 (0.0%) |
| 18 to 34 Years | 0 (0.0%) | 0 (0.0%) |
| 35 to 64 Years | 0 (0.0%) | 3 (6.5%) |
| 65 to 74 Years | 0 (0.0%) | 0 (0.0%) |
| 75 Years and over | 4 (22.2%) | 4 (26.7%) |
Disability Class: Vision Difficulty
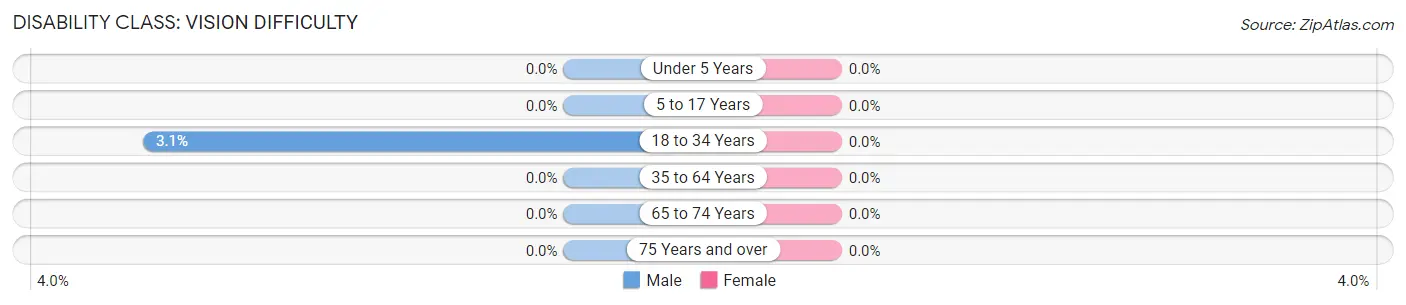
| Age Bracket | Male | Female |
| Under 5 Years | 0 (0.0%) | 0 (0.0%) |
| 5 to 17 Years | 0 (0.0%) | 0 (0.0%) |
| 18 to 34 Years | 1 (3.1%) | 0 (0.0%) |
| 35 to 64 Years | 0 (0.0%) | 0 (0.0%) |
| 65 to 74 Years | 0 (0.0%) | 0 (0.0%) |
| 75 Years and over | 0 (0.0%) | 0 (0.0%) |
Disability Class: Cognitive Difficulty
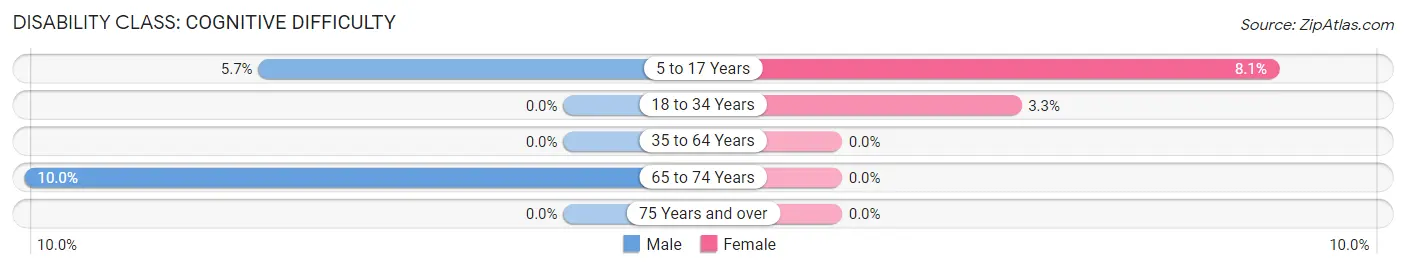
| Age Bracket | Male | Female |
| 5 to 17 Years | 3 (5.7%) | 3 (8.1%) |
| 18 to 34 Years | 0 (0.0%) | 1 (3.3%) |
| 35 to 64 Years | 0 (0.0%) | 0 (0.0%) |
| 65 to 74 Years | 1 (10.0%) | 0 (0.0%) |
| 75 Years and over | 0 (0.0%) | 0 (0.0%) |
Disability Class: Ambulatory Difficulty
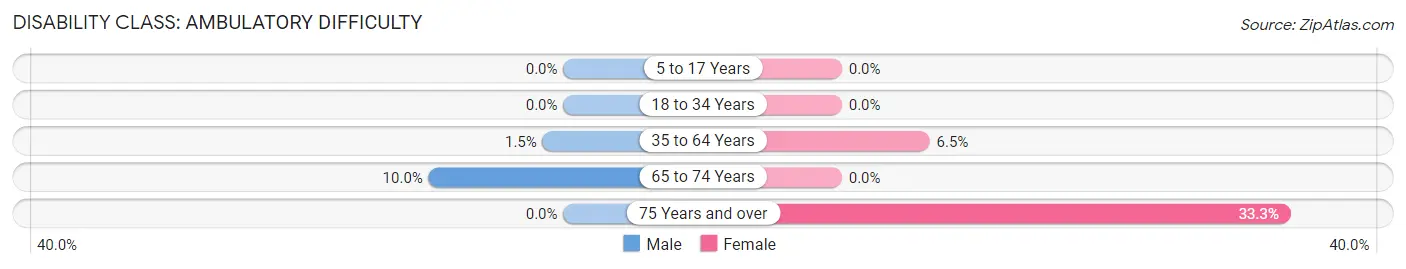
| Age Bracket | Male | Female |
| 5 to 17 Years | 0 (0.0%) | 0 (0.0%) |
| 18 to 34 Years | 0 (0.0%) | 0 (0.0%) |
| 35 to 64 Years | 1 (1.5%) | 3 (6.5%) |
| 65 to 74 Years | 1 (10.0%) | 0 (0.0%) |
| 75 Years and over | 0 (0.0%) | 5 (33.3%) |
Disability Class: Self-Care Difficulty
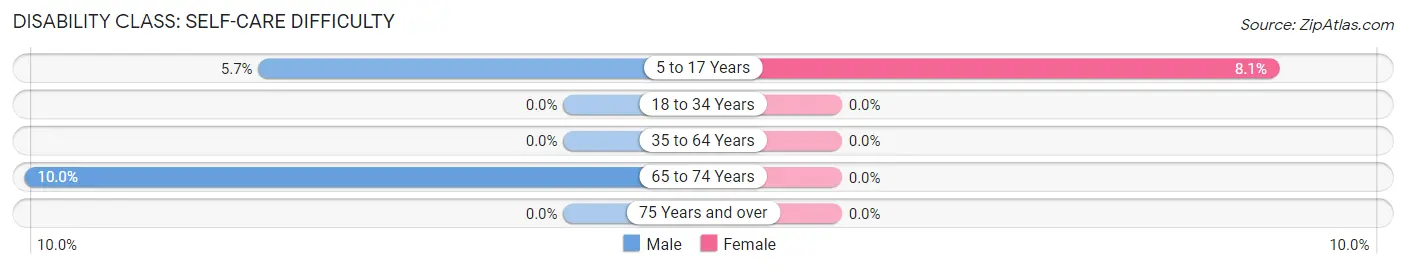
| Age Bracket | Male | Female |
| 5 to 17 Years | 3 (5.7%) | 3 (8.1%) |
| 18 to 34 Years | 0 (0.0%) | 0 (0.0%) |
| 35 to 64 Years | 0 (0.0%) | 0 (0.0%) |
| 65 to 74 Years | 1 (10.0%) | 0 (0.0%) |
| 75 Years and over | 0 (0.0%) | 0 (0.0%) |
Technology Access in Fairwater
Computing Device Access in Fairwater
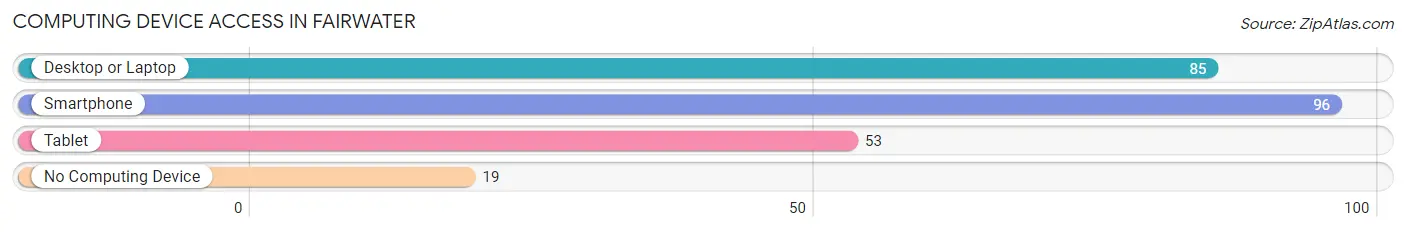
| Device Type | # Households | % Households |
| Desktop or Laptop | 85 | 64.9% |
| Smartphone | 96 | 73.3% |
| Tablet | 53 | 40.5% |
| No Computing Device | 19 | 14.5% |
| Total | 131 | 100.0% |
Internet Access in Fairwater
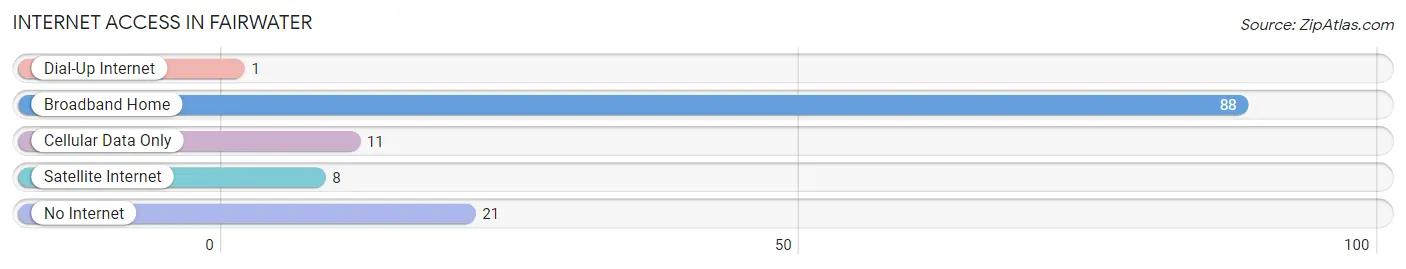
| Internet Type | # Households | % Households |
| Dial-Up Internet | 1 | 0.8% |
| Broadband Home | 88 | 67.2% |
| Cellular Data Only | 11 | 8.4% |
| Satellite Internet | 8 | 6.1% |
| No Internet | 21 | 16.0% |
| Total | 131 | 100.0% |
Fairwater Summary
History
Fairwater, Wisconsin is a small village located in Fond du Lac County, Wisconsin. It is situated on the banks of the Fond du Lac River, and is part of the Town of Ashford. The village was first settled in 1845 by a group of German immigrants, and was originally known as “New Berlin”. The name was changed to Fairwater in 1856, after the nearby Fairwater Creek.
The village was a popular destination for German immigrants, who were attracted to the area by its fertile soil and abundant natural resources. The village grew quickly, and by the late 19th century, it had become a thriving agricultural community. The village was also home to several small businesses, including a sawmill, a grist mill, a blacksmith shop, and a general store.
In the early 20th century, Fairwater began to experience a decline in population as many of its residents moved away in search of better economic opportunities. The village was also affected by the Great Depression, and many of its businesses closed. However, the village was able to survive, and by the 1950s, it had become a popular tourist destination.
Geography
Fairwater is located in Fond du Lac County, Wisconsin, on the banks of the Fond du Lac River. The village is situated in the Town of Ashford, and is bordered by the towns of Oakfield, Byron, and Brandon. The village is located approximately 25 miles north of the city of Fond du Lac, and is approximately 40 miles east of the city of Madison.
The village is situated on a flat plain, and is surrounded by rolling hills and wooded areas. The Fond du Lac River runs through the village, and is a popular destination for fishing and boating. The village is also home to several small lakes, including Lake Winnebago, which is the largest lake in Wisconsin.
Economy
The economy of Fairwater is largely based on agriculture and tourism. The village is home to several small farms, which produce a variety of crops, including corn, soybeans, and hay. The village is also home to several small businesses, including a sawmill, a grist mill, a blacksmith shop, and a general store.
The village is also a popular tourist destination, and is home to several attractions, including the Fairwater Historical Museum, the Fairwater Nature Center, and the Fairwater County Park. The village is also home to several restaurants, bars, and shops, which attract visitors from all over the region.
Demographics
As of the 2010 census, the population of Fairwater was 1,093. The village is predominantly white, with 95.3% of the population identifying as white. The median household income in the village is $50,938, and the median age is 43.7 years. The village is also home to a large number of families, with 44.3% of households having children under the age of 18.
Common Questions
What is Per Capita Income in Fairwater?
Per Capita income in Fairwater is $30,132.
What is the Median Family Income in Fairwater?
Median Family Income in Fairwater is $93,750.
What is the Median Household income in Fairwater?
Median Household Income in Fairwater is $67,083.
What is Income or Wage Gap in Fairwater?
Income or Wage Gap in Fairwater is 47.0%.
Women in Fairwater earn 53.0 cents for every dollar earned by a man.
What is Inequality or Gini Index in Fairwater?
Inequality or Gini Index in Fairwater is 0.39.
What is the Total Population of Fairwater?
Total Population of Fairwater is 339.
What is the Total Male Population of Fairwater?
Total Male Population of Fairwater is 187.
What is the Total Female Population of Fairwater?
Total Female Population of Fairwater is 152.
What is the Ratio of Males per 100 Females in Fairwater?
There are 123.03 Males per 100 Females in Fairwater.
What is the Ratio of Females per 100 Males in Fairwater?
There are 81.28 Females per 100 Males in Fairwater.
What is the Median Population Age in Fairwater?
Median Population Age in Fairwater is 31.5 Years.
What is the Average Family Size in Fairwater
Average Family Size in Fairwater is 3.5 People.
What is the Average Household Size in Fairwater
Average Household Size in Fairwater is 2.6 People.
How Large is the Labor Force in Fairwater?
There are 177 People in the Labor Forcein in Fairwater.
What is the Percentage of People in the Labor Force in Fairwater?
74.7% of People are in the Labor Force in Fairwater.
What is the Unemployment Rate in Fairwater?
Unemployment Rate in Fairwater is 2.3%.