Northport, WI Map & Demographics
Northport Map
Northport Overview
$35,361
PER CAPITA INCOME
$99,583
AVG FAMILY INCOME
$84,219
AVG HOUSEHOLD INCOME
54.9%
WAGE / INCOME GAP [ % ]
45.1¢/ $1
WAGE / INCOME GAP [ $ ]
0.31
INEQUALITY / GINI INDEX
426
TOTAL POPULATION
198
MALE POPULATION
228
FEMALE POPULATION
86.84
MALES / 100 FEMALES
115.15
FEMALES / 100 MALES
48.4
MEDIAN AGE
3.0
AVG FAMILY SIZE
2.6
AVG HOUSEHOLD SIZE
241
LABOR FORCE [ PEOPLE ]
69.7%
PERCENT IN LABOR FORCE
5.0%
UNEMPLOYMENT RATE
Income in Northport
Income Overview in Northport
Per Capita Income in Northport is $35,361, while median incomes of families and households are $99,583 and $84,219 respectively.
| Characteristic | Number | Measure |
| Per Capita Income | 426 | $35,361 |
| Median Family Income | 127 | $99,583 |
| Mean Family Income | 127 | $100,472 |
| Median Household Income | 161 | $84,219 |
| Mean Household Income | 161 | $87,234 |
| Income Deficit | 127 | $0 |
| Wage / Income Gap (%) | 426 | 54.86% |
| Wage / Income Gap ($) | 426 | 45.14¢ per $1 |
| Gini / Inequality Index | 426 | 0.31 |
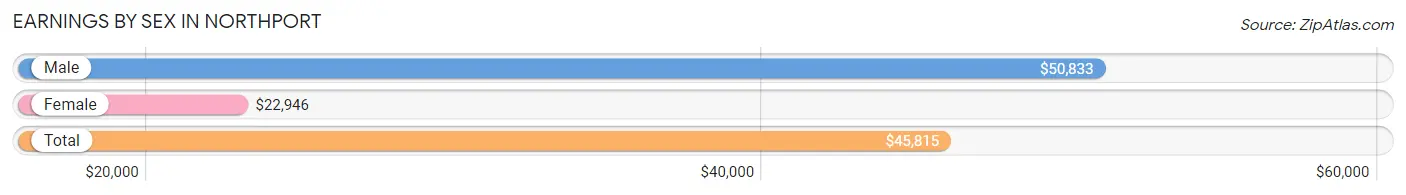
Earnings by Sex in Northport
Average Earnings in Northport are $45,815, $50,833 for men and $22,946 for women, a difference of 54.9%.
| Sex | Number | Average Earnings |
| Male | 132 (53.9%) | $50,833 |
| Female | 113 (46.1%) | $22,946 |
| Total | 245 (100.0%) | $45,815 |
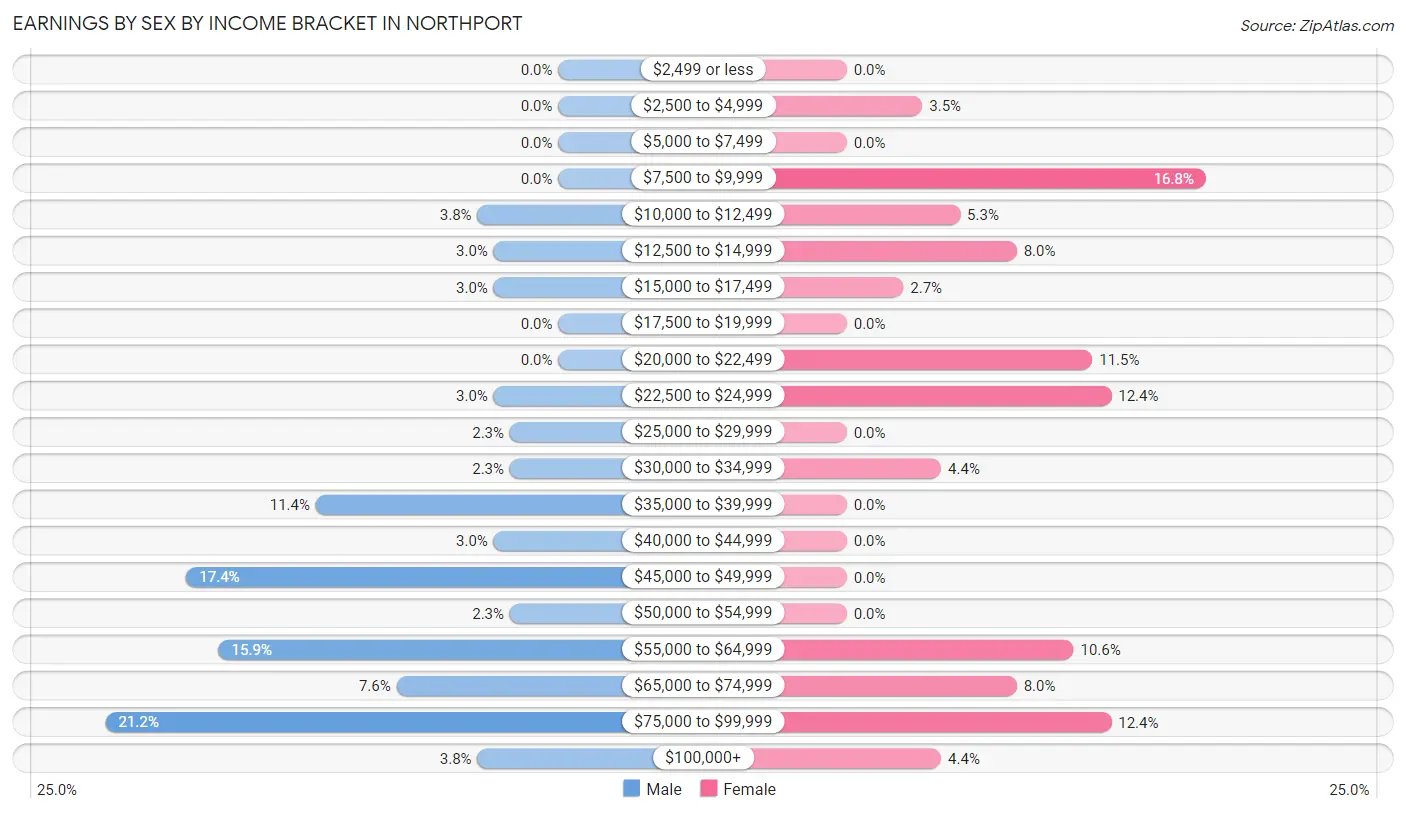
Earnings by Sex by Income Bracket in Northport
The most common earnings brackets in Northport are $75,000 to $99,999 for men (28 | 21.2%) and $7,500 to $9,999 for women (19 | 16.8%).
| Income | Male | Female |
| $2,499 or less | 0 (0.0%) | 0 (0.0%) |
| $2,500 to $4,999 | 0 (0.0%) | 4 (3.5%) |
| $5,000 to $7,499 | 0 (0.0%) | 0 (0.0%) |
| $7,500 to $9,999 | 0 (0.0%) | 19 (16.8%) |
| $10,000 to $12,499 | 5 (3.8%) | 6 (5.3%) |
| $12,500 to $14,999 | 4 (3.0%) | 9 (8.0%) |
| $15,000 to $17,499 | 4 (3.0%) | 3 (2.6%) |
| $17,500 to $19,999 | 0 (0.0%) | 0 (0.0%) |
| $20,000 to $22,499 | 0 (0.0%) | 13 (11.5%) |
| $22,500 to $24,999 | 4 (3.0%) | 14 (12.4%) |
| $25,000 to $29,999 | 3 (2.3%) | 0 (0.0%) |
| $30,000 to $34,999 | 3 (2.3%) | 5 (4.4%) |
| $35,000 to $39,999 | 15 (11.4%) | 0 (0.0%) |
| $40,000 to $44,999 | 4 (3.0%) | 0 (0.0%) |
| $45,000 to $49,999 | 23 (17.4%) | 0 (0.0%) |
| $50,000 to $54,999 | 3 (2.3%) | 0 (0.0%) |
| $55,000 to $64,999 | 21 (15.9%) | 12 (10.6%) |
| $65,000 to $74,999 | 10 (7.6%) | 9 (8.0%) |
| $75,000 to $99,999 | 28 (21.2%) | 14 (12.4%) |
| $100,000+ | 5 (3.8%) | 5 (4.4%) |
| Total | 132 (100.0%) | 113 (100.0%) |
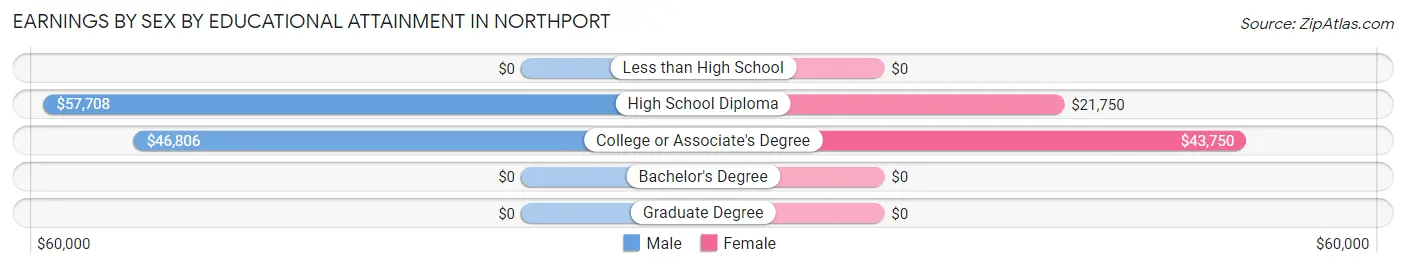
Earnings by Sex by Educational Attainment in Northport
| Educational Attainment | Male Income | Female Income |
| Less than High School | - | - |
| High School Diploma | $57,708 | $21,750 |
| College or Associate's Degree | $46,806 | $43,750 |
| Bachelor's Degree | - | - |
| Graduate Degree | - | - |
| Total | $55,625 | $0 |
Family Income in Northport
Family Income Brackets in Northport
According to the Northport family income data, there are 44 families falling into the $100,000 to $149,999 income range, which is the most common income bracket and makes up 34.6% of all families.
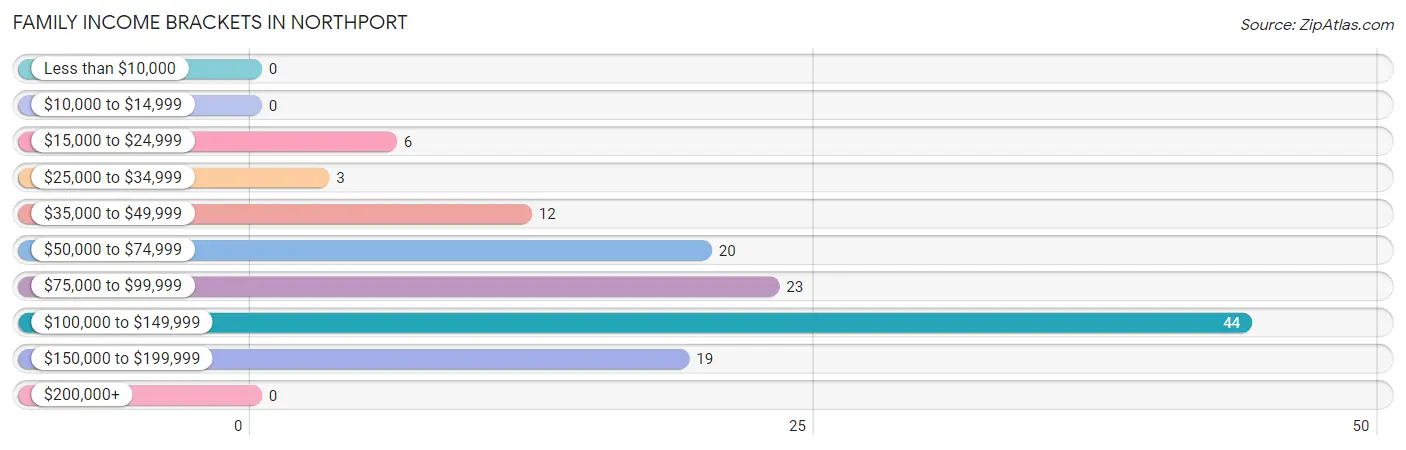
| Income Bracket | # Families | % Families |
| Less than $10,000 | 0 | 0.0% |
| $10,000 to $14,999 | 0 | 0.0% |
| $15,000 to $24,999 | 6 | 4.7% |
| $25,000 to $34,999 | 3 | 2.4% |
| $35,000 to $49,999 | 12 | 9.4% |
| $50,000 to $74,999 | 20 | 15.7% |
| $75,000 to $99,999 | 23 | 18.1% |
| $100,000 to $149,999 | 44 | 34.6% |
| $150,000 to $199,999 | 19 | 15.0% |
| $200,000+ | 0 | 0.0% |
Family Income by Famaliy Size in Northport
4-person families (20 | 15.8%) account for the highest median family income in Northport with $135,357 per family, while 2-person families (64 | 50.4%) have the highest median income of $51,334 per family member.
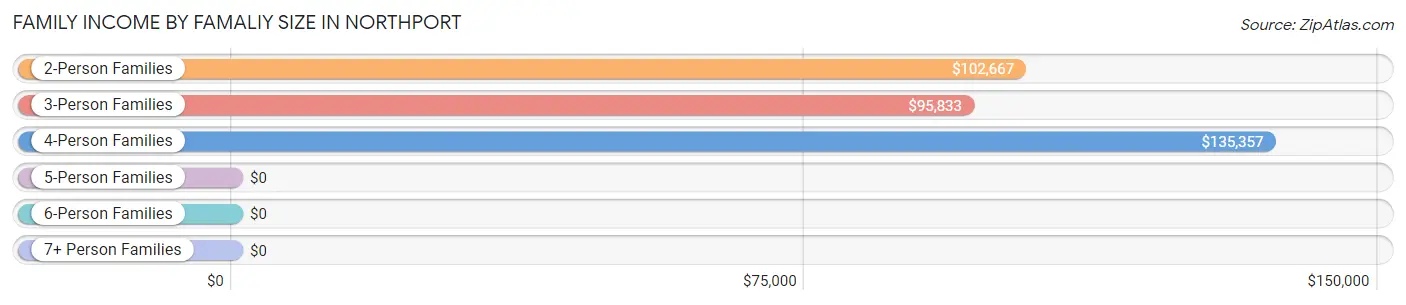
| Income Bracket | # Families | Median Income |
| 2-Person Families | 64 (50.4%) | $102,667 |
| 3-Person Families | 34 (26.8%) | $95,833 |
| 4-Person Families | 20 (15.8%) | $135,357 |
| 5-Person Families | 9 (7.1%) | $0 |
| 6-Person Families | 0 (0.0%) | $0 |
| 7+ Person Families | 0 (0.0%) | $0 |
| Total | 127 (100.0%) | $99,583 |
Family Income by Number of Earners in Northport
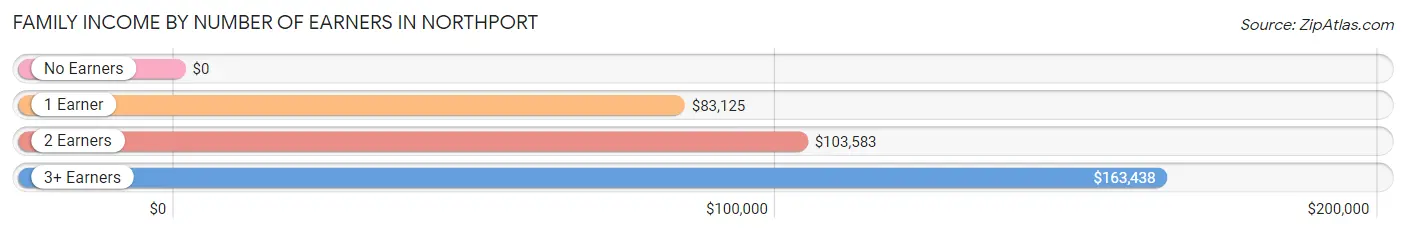
| Number of Earners | # Families | Median Income |
| No Earners | 7 (5.5%) | $0 |
| 1 Earner | 34 (26.8%) | $83,125 |
| 2 Earners | 69 (54.3%) | $103,583 |
| 3+ Earners | 17 (13.4%) | $163,438 |
| Total | 127 (100.0%) | $99,583 |
Household Income in Northport
Household Income Brackets in Northport
With 44 households falling in the category, the $100,000 to $149,999 income range is the most frequent in Northport, accounting for 27.3% of all households.
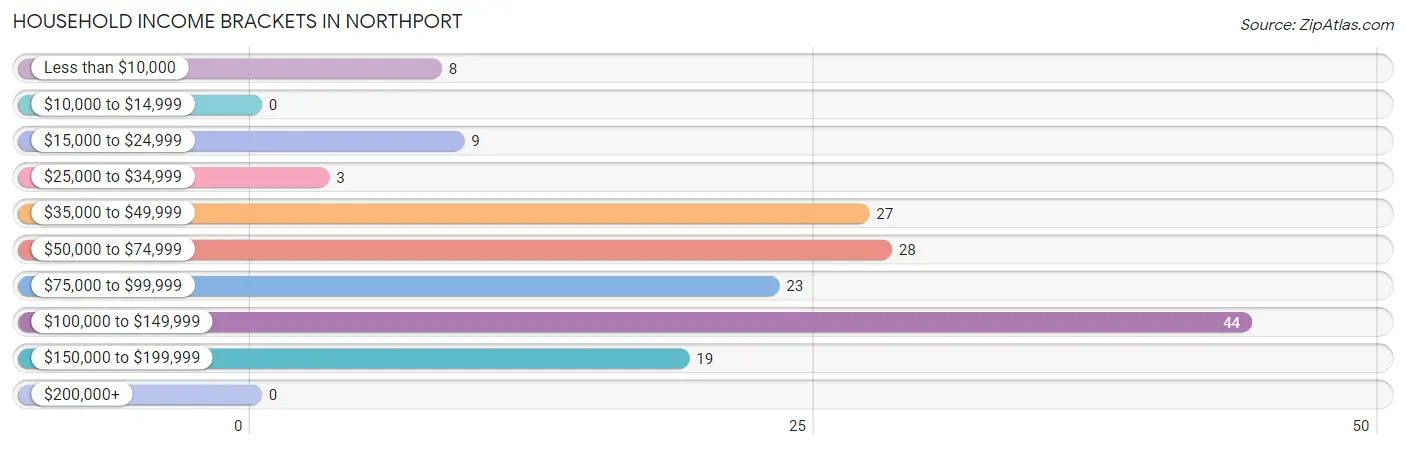
| Income Bracket | # Households | % Households |
| Less than $10,000 | 8 | 5.0% |
| $10,000 to $14,999 | 0 | 0.0% |
| $15,000 to $24,999 | 9 | 5.6% |
| $25,000 to $34,999 | 3 | 1.9% |
| $35,000 to $49,999 | 27 | 16.8% |
| $50,000 to $74,999 | 28 | 17.4% |
| $75,000 to $99,999 | 23 | 14.3% |
| $100,000 to $149,999 | 44 | 27.3% |
| $150,000 to $199,999 | 19 | 11.8% |
| $200,000+ | 0 | 0.0% |
Household Income by Householder Age in Northport
The median household income in Northport is $84,219, with the highest median household income of $102,667 found in the 45 to 64 years age bracket for the primary householder. A total of 92 households (57.1%) fall into this category.
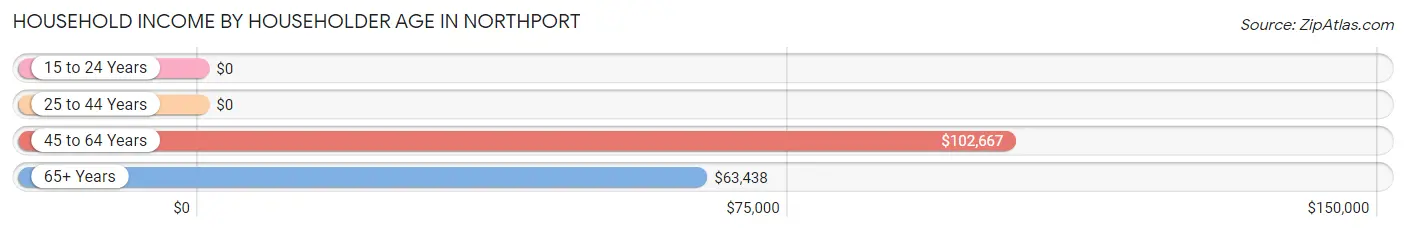
| Income Bracket | # Households | Median Income |
| 15 to 24 Years | 0 (0.0%) | $0 |
| 25 to 44 Years | 28 (17.4%) | $0 |
| 45 to 64 Years | 92 (57.1%) | $102,667 |
| 65+ Years | 41 (25.5%) | $63,438 |
| Total | 161 (100.0%) | $84,219 |
Poverty in Northport
Income Below Poverty by Sex and Age in Northport
With 1.5% poverty level for males and 5.3% for females among the residents of Northport, 25 to 34 year old males and 35 to 44 year old females are the most vulnerable to poverty, with 3 males (15.0%) and 8 females (32.0%) in their respective age groups living below the poverty level.
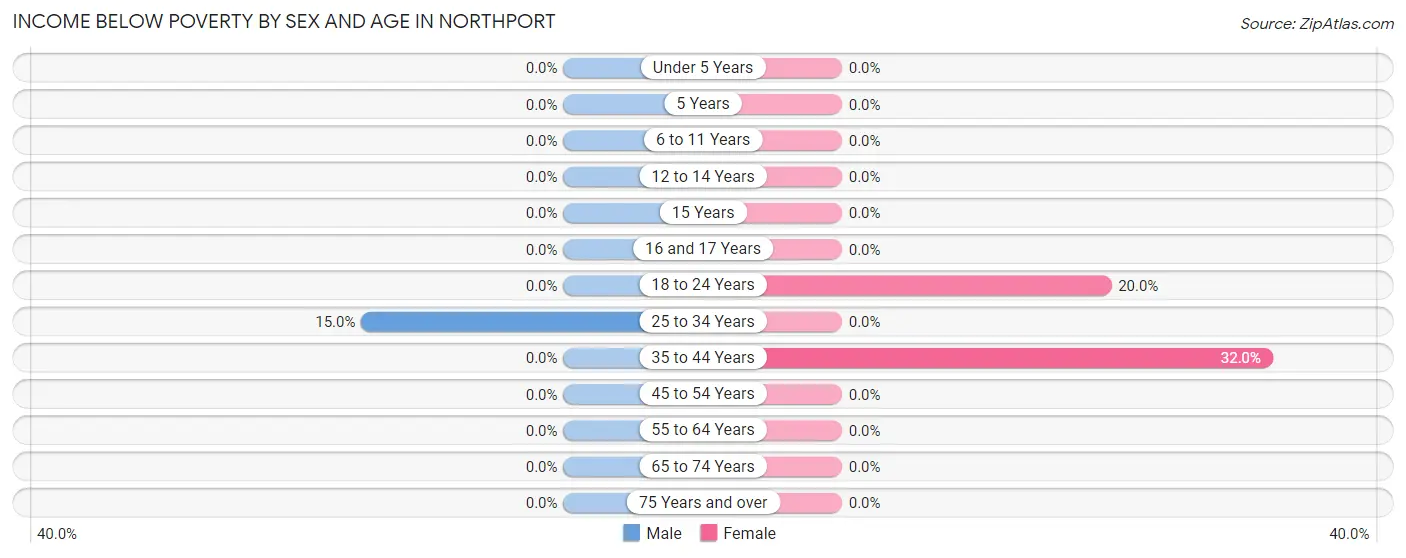
| Age Bracket | Male | Female |
| Under 5 Years | 0 (0.0%) | 0 (0.0%) |
| 5 Years | 0 (0.0%) | 0 (0.0%) |
| 6 to 11 Years | 0 (0.0%) | 0 (0.0%) |
| 12 to 14 Years | 0 (0.0%) | 0 (0.0%) |
| 15 Years | 0 (0.0%) | 0 (0.0%) |
| 16 and 17 Years | 0 (0.0%) | 0 (0.0%) |
| 18 to 24 Years | 0 (0.0%) | 4 (20.0%) |
| 25 to 34 Years | 3 (15.0%) | 0 (0.0%) |
| 35 to 44 Years | 0 (0.0%) | 8 (32.0%) |
| 45 to 54 Years | 0 (0.0%) | 0 (0.0%) |
| 55 to 64 Years | 0 (0.0%) | 0 (0.0%) |
| 65 to 74 Years | 0 (0.0%) | 0 (0.0%) |
| 75 Years and over | 0 (0.0%) | 0 (0.0%) |
| Total | 3 (1.5%) | 12 (5.3%) |
Income Above Poverty by Sex and Age in Northport
According to the poverty statistics in Northport, males aged under 5 years and females aged under 5 years are the age groups that are most secure financially, with 100.0% of males and 100.0% of females in these age groups living above the poverty line.
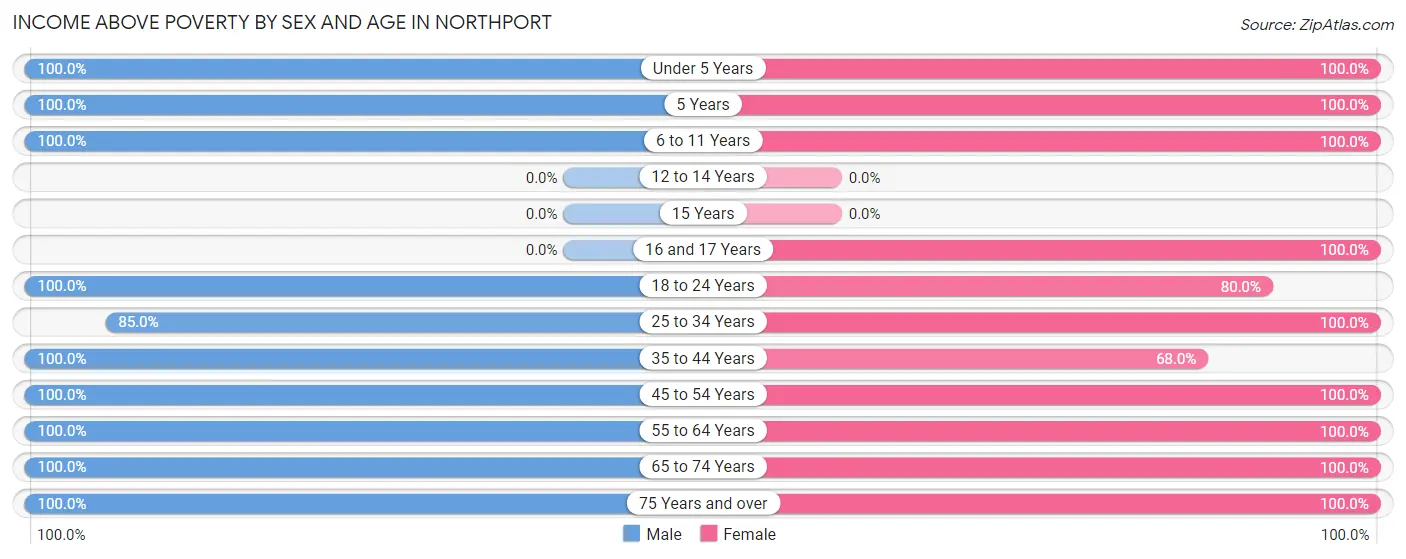
| Age Bracket | Male | Female |
| Under 5 Years | 21 (100.0%) | 17 (100.0%) |
| 5 Years | 6 (100.0%) | 11 (100.0%) |
| 6 to 11 Years | 6 (100.0%) | 19 (100.0%) |
| 12 to 14 Years | 0 (0.0%) | 0 (0.0%) |
| 15 Years | 0 (0.0%) | 0 (0.0%) |
| 16 and 17 Years | 0 (0.0%) | 7 (100.0%) |
| 18 to 24 Years | 12 (100.0%) | 16 (80.0%) |
| 25 to 34 Years | 17 (85.0%) | 18 (100.0%) |
| 35 to 44 Years | 13 (100.0%) | 17 (68.0%) |
| 45 to 54 Years | 40 (100.0%) | 36 (100.0%) |
| 55 to 64 Years | 46 (100.0%) | 24 (100.0%) |
| 65 to 74 Years | 17 (100.0%) | 35 (100.0%) |
| 75 Years and over | 17 (100.0%) | 16 (100.0%) |
| Total | 195 (98.5%) | 216 (94.7%) |
Income Below Poverty Among Married-Couple Families in Northport
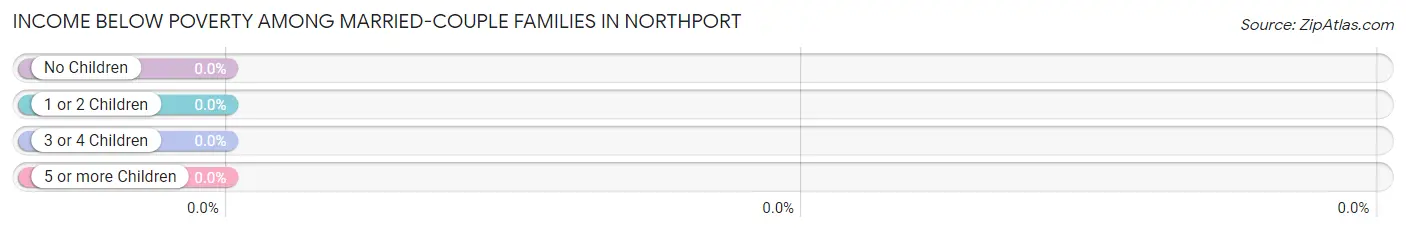
| Children | Above Poverty | Below Poverty |
| No Children | 74 (100.0%) | 0 (0.0%) |
| 1 or 2 Children | 28 (100.0%) | 0 (0.0%) |
| 3 or 4 Children | 5 (100.0%) | 0 (0.0%) |
| 5 or more Children | 0 (0.0%) | 0 (0.0%) |
| Total | 107 (100.0%) | 0 (0.0%) |
Income Below Poverty Among Single-Parent Households in Northport
| Children | Single Father | Single Mother |
| No Children | 0 (0.0%) | 0 (0.0%) |
| 1 or 2 Children | 0 (0.0%) | 0 (0.0%) |
| 3 or 4 Children | 0 (0.0%) | 0 (0.0%) |
| 5 or more Children | 0 (0.0%) | 0 (0.0%) |
| Total | 0 (0.0%) | 0 (0.0%) |
Income Below Poverty Among Married-Couple vs Single-Parent Households in Northport
| Children | Married-Couple Families | Single-Parent Households |
| No Children | 0 (0.0%) | 0 (0.0%) |
| 1 or 2 Children | 0 (0.0%) | 0 (0.0%) |
| 3 or 4 Children | 0 (0.0%) | 0 (0.0%) |
| 5 or more Children | 0 (0.0%) | 0 (0.0%) |
| Total | 0 (0.0%) | 0 (0.0%) |
Race in Northport
The most populous races in Northport are White / Caucasian (419 | 98.4%), Hispanic or Latino (10 | 2.4%), and Two or more Races (7 | 1.6%).
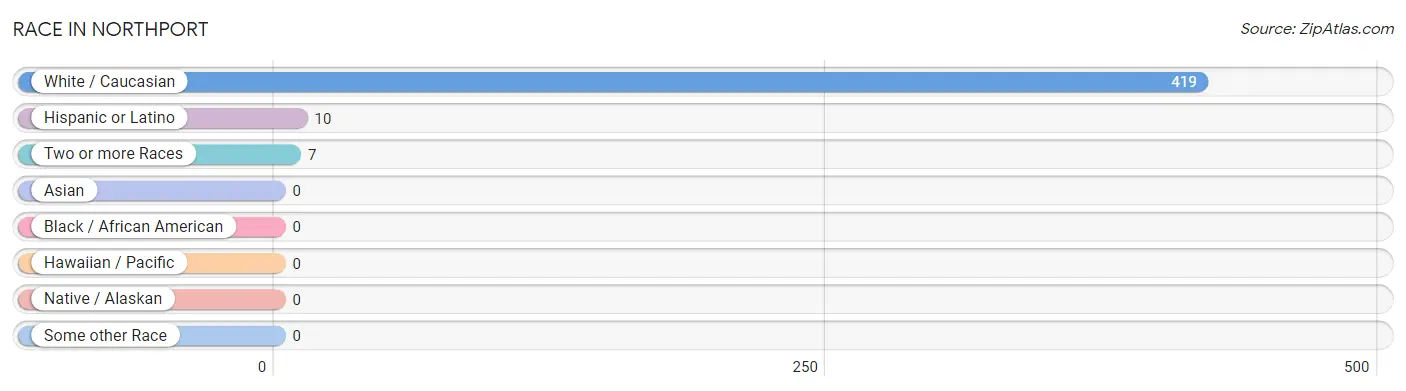
| Race | # Population | % Population |
| Asian | 0 | 0.0% |
| Black / African American | 0 | 0.0% |
| Hawaiian / Pacific | 0 | 0.0% |
| Hispanic or Latino | 10 | 2.4% |
| Native / Alaskan | 0 | 0.0% |
| White / Caucasian | 419 | 98.4% |
| Two or more Races | 7 | 1.6% |
| Some other Race | 0 | 0.0% |
| Total | 426 | 100.0% |
Ancestry in Northport
The most populous ancestries reported in Northport are German (248 | 58.2%), French (57 | 13.4%), French Canadian (32 | 7.5%), Polish (28 | 6.6%), and Slovak (20 | 4.7%), together accounting for 90.4% of all Northport residents.
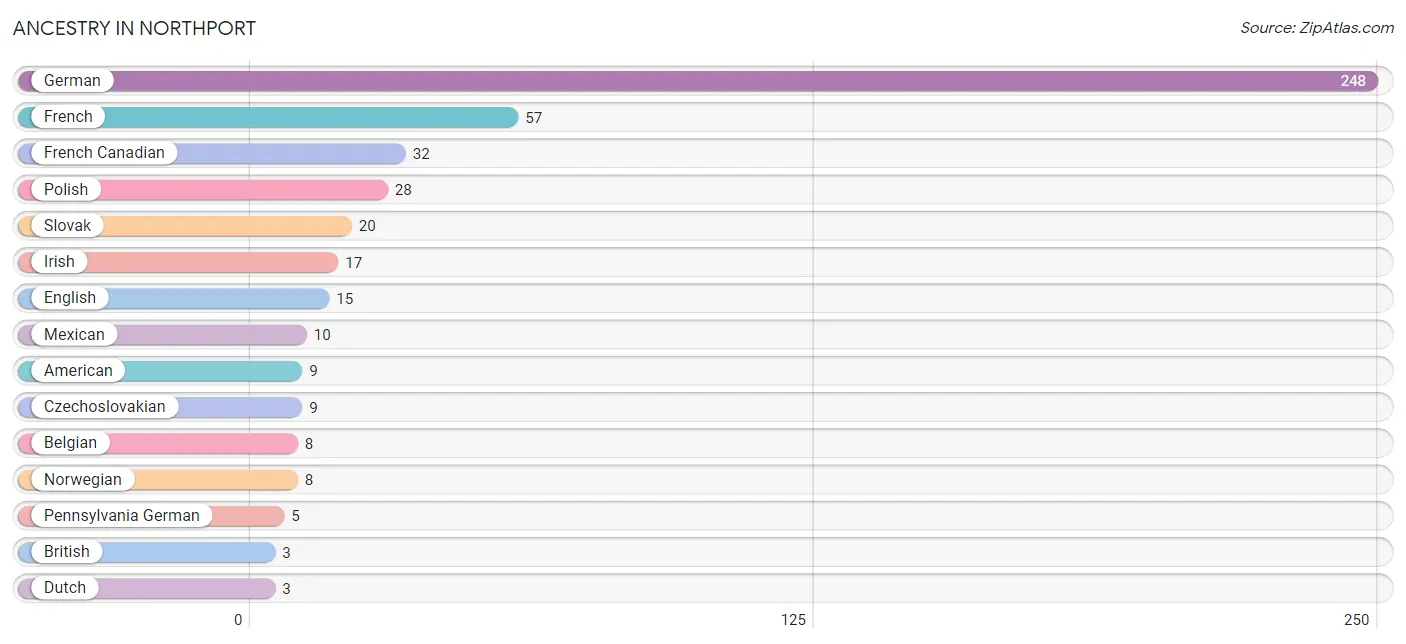
| Ancestry | # Population | % Population |
| American | 9 | 2.1% |
| Belgian | 8 | 1.9% |
| British | 3 | 0.7% |
| Czechoslovakian | 9 | 2.1% |
| Dutch | 3 | 0.7% |
| English | 15 | 3.5% |
| French | 57 | 13.4% |
| French Canadian | 32 | 7.5% |
| German | 248 | 58.2% |
| Irish | 17 | 4.0% |
| Italian | 3 | 0.7% |
| Mexican | 10 | 2.4% |
| Norwegian | 8 | 1.9% |
| Pennsylvania German | 5 | 1.2% |
| Polish | 28 | 6.6% |
| Slovak | 20 | 4.7% | View All 16 Rows |
Immigrants in Northport
The most numerous immigrant groups reported in Northport came from Czechoslovakia (9 | 2.1%), Eastern Europe (9 | 2.1%), and Europe (9 | 2.1%), together accounting for 6.3% of all Northport residents.
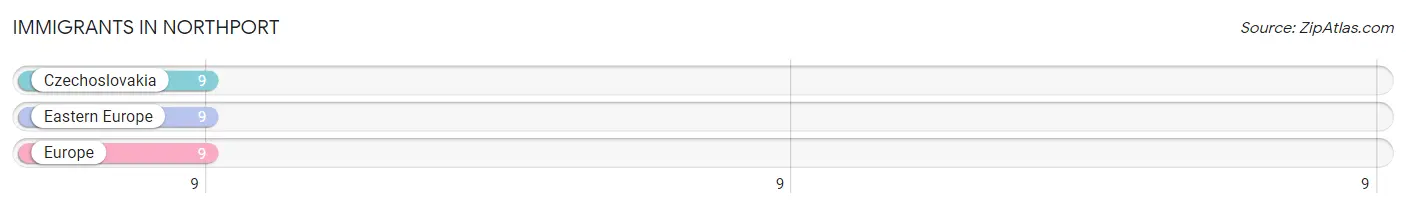
| Immigration Origin | # Population | % Population |
| Czechoslovakia | 9 | 2.1% |
| Eastern Europe | 9 | 2.1% |
| Europe | 9 | 2.1% | View All 3 Rows |
Sex and Age in Northport
Sex and Age in Northport
The most populous age groups in Northport are 55 to 59 Years (33 | 16.7%) for men and 50 to 54 Years (27 | 11.8%) for women.
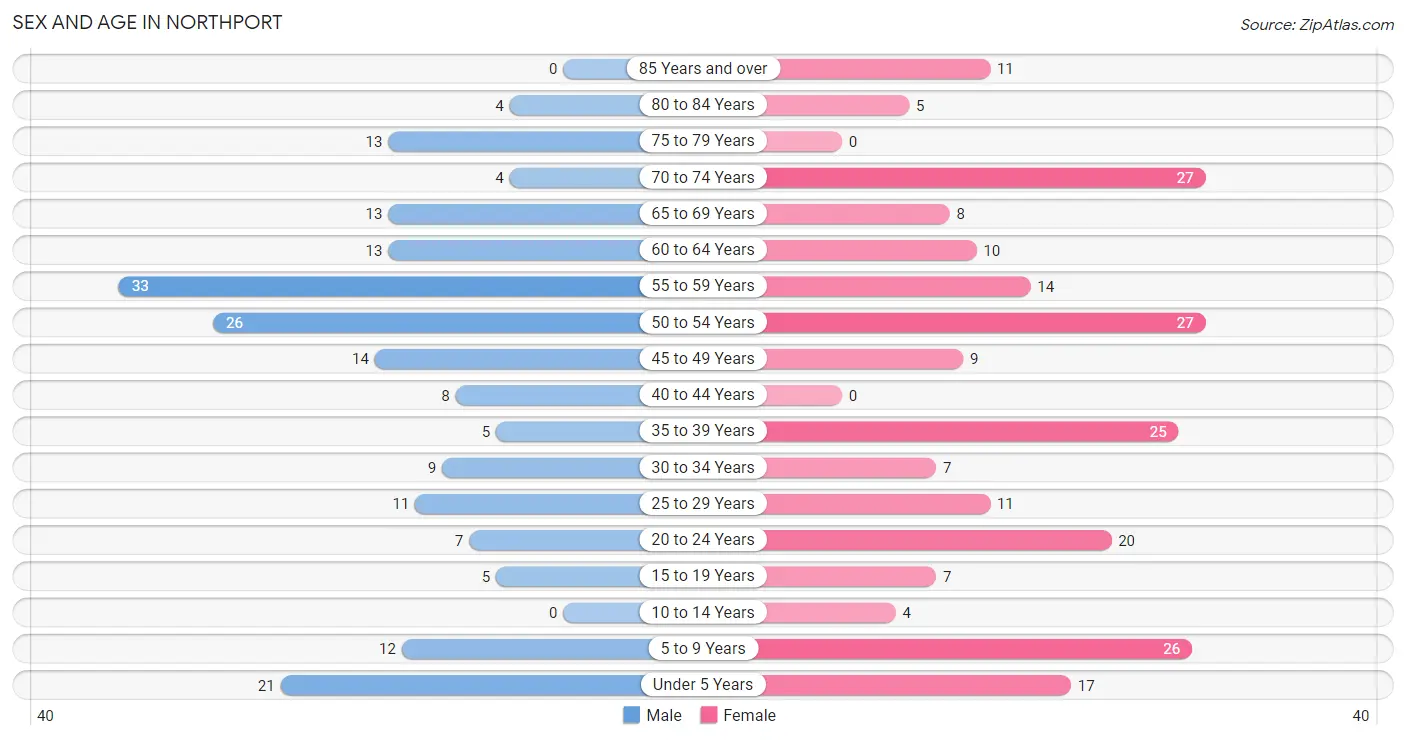
| Age Bracket | Male | Female |
| Under 5 Years | 21 (10.6%) | 17 (7.5%) |
| 5 to 9 Years | 12 (6.1%) | 26 (11.4%) |
| 10 to 14 Years | 0 (0.0%) | 4 (1.8%) |
| 15 to 19 Years | 5 (2.5%) | 7 (3.1%) |
| 20 to 24 Years | 7 (3.5%) | 20 (8.8%) |
| 25 to 29 Years | 11 (5.6%) | 11 (4.8%) |
| 30 to 34 Years | 9 (4.5%) | 7 (3.1%) |
| 35 to 39 Years | 5 (2.5%) | 25 (11.0%) |
| 40 to 44 Years | 8 (4.0%) | 0 (0.0%) |
| 45 to 49 Years | 14 (7.1%) | 9 (4.0%) |
| 50 to 54 Years | 26 (13.1%) | 27 (11.8%) |
| 55 to 59 Years | 33 (16.7%) | 14 (6.1%) |
| 60 to 64 Years | 13 (6.6%) | 10 (4.4%) |
| 65 to 69 Years | 13 (6.6%) | 8 (3.5%) |
| 70 to 74 Years | 4 (2.0%) | 27 (11.8%) |
| 75 to 79 Years | 13 (6.6%) | 0 (0.0%) |
| 80 to 84 Years | 4 (2.0%) | 5 (2.2%) |
| 85 Years and over | 0 (0.0%) | 11 (4.8%) |
| Total | 198 (100.0%) | 228 (100.0%) |
Families and Households in Northport
Median Family Size in Northport
The median family size in Northport is 3.03 persons per family, with married-couple families (107 | 84.3%) accounting for the largest median family size of 3.19 persons per family. On the other hand, single female/mother families (12 | 9.5%) represent the smallest median family size with 2.00 persons per family.
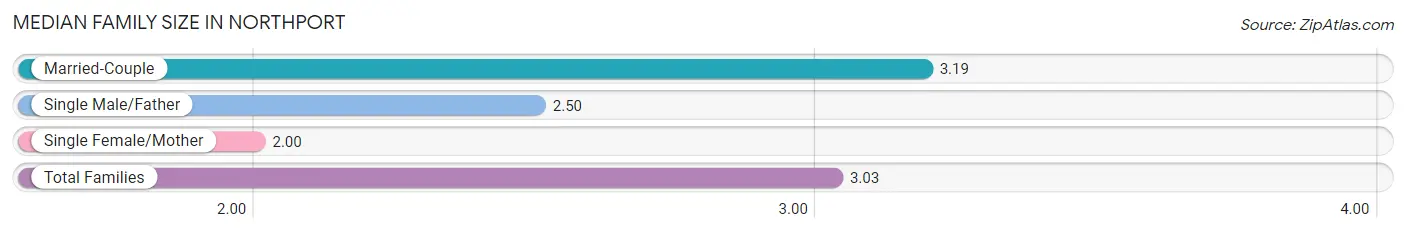
| Family Type | # Families | Family Size |
| Married-Couple | 107 (84.3%) | 3.19 |
| Single Male/Father | 8 (6.3%) | 2.50 |
| Single Female/Mother | 12 (9.5%) | 2.00 |
| Total Families | 127 (100.0%) | 3.03 |
Median Household Size in Northport
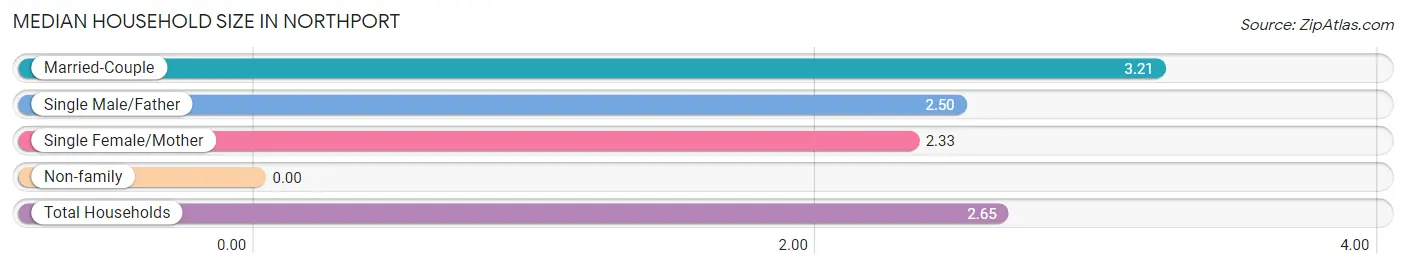
| Household Type | # Households | Household Size |
| Married-Couple | 107 (66.5%) | 3.21 |
| Single Male/Father | 8 (5.0%) | 2.50 |
| Single Female/Mother | 12 (7.4%) | 2.33 |
| Non-family | 34 (21.1%) | - |
| Total Households | 161 (100.0%) | 2.65 |
Household Size by Marriage Status in Northport
Out of a total of 161 households in Northport, 127 (78.9%) are family households, while 34 (21.1%) are nonfamily households. The most numerous type of family households are 2-person households, comprising 64, and the most common type of nonfamily households are 1-person households, comprising 34.
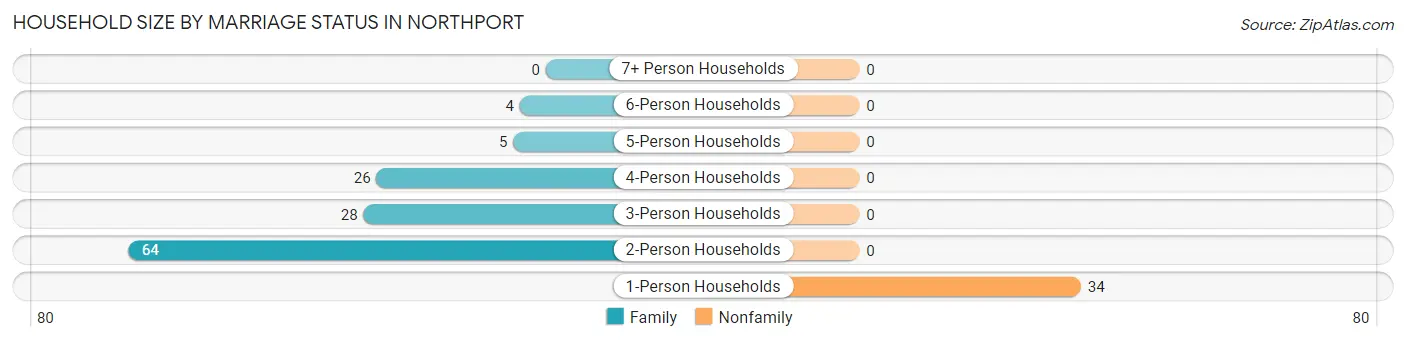
| Household Size | Family Households | Nonfamily Households |
| 1-Person Households | - | 34 (21.1%) |
| 2-Person Households | 64 (39.8%) | 0 (0.0%) |
| 3-Person Households | 28 (17.4%) | 0 (0.0%) |
| 4-Person Households | 26 (16.2%) | 0 (0.0%) |
| 5-Person Households | 5 (3.1%) | 0 (0.0%) |
| 6-Person Households | 4 (2.5%) | 0 (0.0%) |
| 7+ Person Households | 0 (0.0%) | 0 (0.0%) |
| Total | 127 (78.9%) | 34 (21.1%) |
Female Fertility in Northport
Fertility by Age in Northport
| Age Bracket | Women with Births | Births / 1,000 Women |
| 15 to 19 years | 0 (0.0%) | 0.0 |
| 20 to 34 years | 0 (0.0%) | 0.0 |
| 35 to 50 years | 0 (0.0%) | 0.0 |
| Total | 0 (0.0%) | 0.0 |
Fertility by Age by Marriage Status in Northport
| Age Bracket | Married | Unmarried |
| 15 to 19 years | 0 (0.0%) | 0 (0.0%) |
| 20 to 34 years | 0 (0.0%) | 0 (0.0%) |
| 35 to 50 years | 0 (0.0%) | 0 (0.0%) |
| Total | 0 (0.0%) | 0 (0.0%) |
Fertility by Education in Northport
| Educational Attainment | Women with Births | Births / 1,000 Women |
| Less than High School | 0 (0.0%) | 0.0 |
| High School Diploma | 0 (0.0%) | 0.0 |
| College or Associate's Degree | 0 (0.0%) | 0.0 |
| Bachelor's Degree | 0 (0.0%) | 0.0 |
| Graduate Degree | 0 (0.0%) | 0.0 |
| Total | 0 (0.0%) | 0.0 |
Fertility by Education by Marriage Status in Northport
| Educational Attainment | Married | Unmarried |
| Less than High School | 0 (0.0%) | 0 (0.0%) |
| High School Diploma | 0 (0.0%) | 0 (0.0%) |
| College or Associate's Degree | 0 (0.0%) | 0 (0.0%) |
| Bachelor's Degree | 0 (0.0%) | 0 (0.0%) |
| Graduate Degree | 0 (0.0%) | 0 (0.0%) |
| Total | 0 (0.0%) | 0 (0.0%) |
Employment Characteristics in Northport
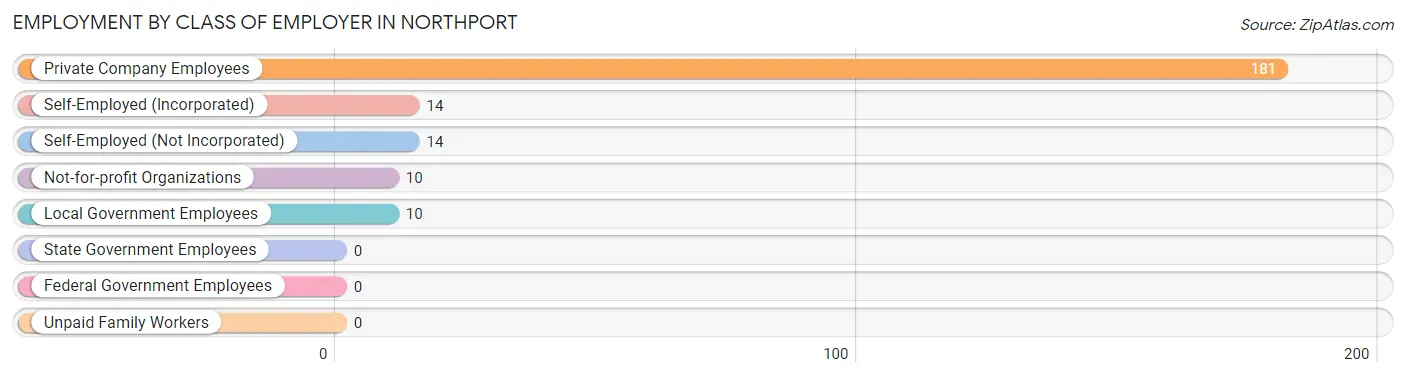
Employment by Class of Employer in Northport
Among the 229 employed individuals in Northport, private company employees (181 | 79.0%), self-employed (incorporated) (14 | 6.1%), and self-employed (not incorporated) (14 | 6.1%) make up the most common classes of employment.
| Employer Class | # Employees | % Employees |
| Private Company Employees | 181 | 79.0% |
| Self-Employed (Incorporated) | 14 | 6.1% |
| Self-Employed (Not Incorporated) | 14 | 6.1% |
| Not-for-profit Organizations | 10 | 4.4% |
| Local Government Employees | 10 | 4.4% |
| State Government Employees | 0 | 0.0% |
| Federal Government Employees | 0 | 0.0% |
| Unpaid Family Workers | 0 | 0.0% |
| Total | 229 | 100.0% |
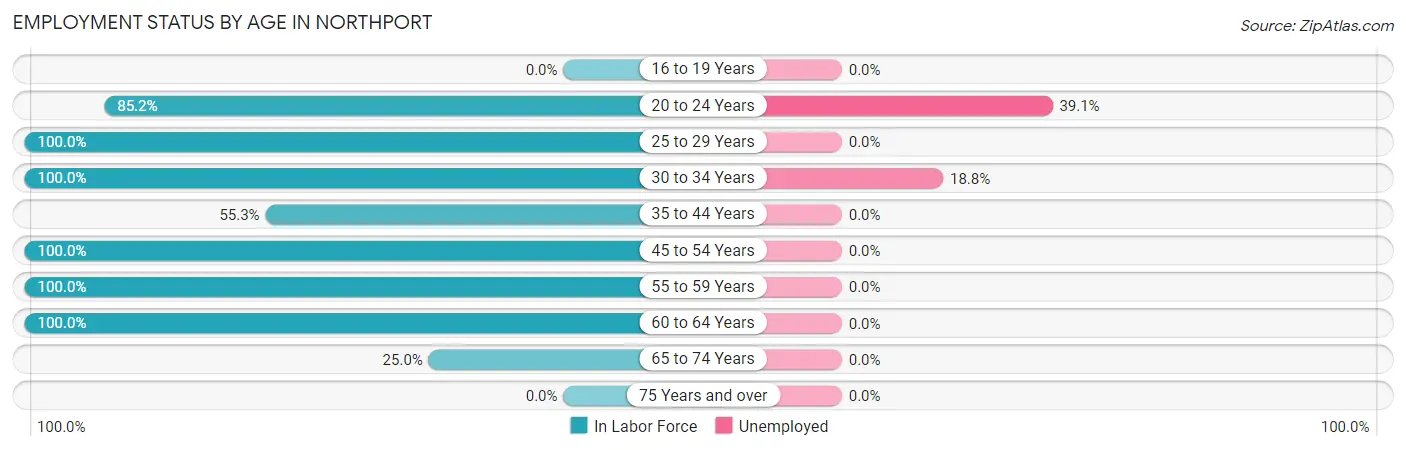
Employment Status by Age in Northport
According to the labor force statistics for Northport, out of the total population over 16 years of age (346), 69.7% or 241 individuals are in the labor force, with 5.0% or 12 of them unemployed. The age group with the highest labor force participation rate is 25 to 29 years, with 100.0% or 22 individuals in the labor force. Within the labor force, the 20 to 24 years age range has the highest percentage of unemployed individuals, with 39.1% or 9 of them being unemployed.
| Age Bracket | In Labor Force | Unemployed |
| 16 to 19 Years | 0 (0.0%) | 0 (0.0%) |
| 20 to 24 Years | 23 (85.2%) | 9 (39.1%) |
| 25 to 29 Years | 22 (100.0%) | 0 (0.0%) |
| 30 to 34 Years | 16 (100.0%) | 3 (18.8%) |
| 35 to 44 Years | 21 (55.3%) | 0 (0.0%) |
| 45 to 54 Years | 76 (100.0%) | 0 (0.0%) |
| 55 to 59 Years | 47 (100.0%) | 0 (0.0%) |
| 60 to 64 Years | 23 (100.0%) | 0 (0.0%) |
| 65 to 74 Years | 13 (25.0%) | 0 (0.0%) |
| 75 Years and over | 0 (0.0%) | 0 (0.0%) |
| Total | 241 (69.7%) | 12 (5.0%) |
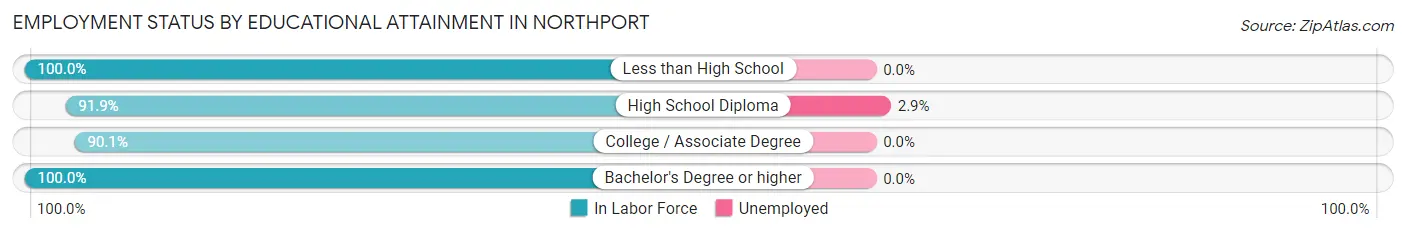
Employment Status by Educational Attainment in Northport
According to labor force statistics for Northport, 92.3% of individuals (205) out of the total population between 25 and 64 years of age (222) are in the labor force, with 1.5% or 3 of them being unemployed. The group with the highest labor force participation rate are those with the educational attainment of less than high school, with 100.0% or 4 individuals in the labor force. Within the labor force, individuals with high school diploma education have the highest percentage of unemployment, with 2.9% or 3 of them being unemployed.
| Educational Attainment | In Labor Force | Unemployed |
| Less than High School | 4 (100.0%) | 0 (0.0%) |
| High School Diploma | 102 (91.9%) | 3 (2.9%) |
| College / Associate Degree | 73 (90.1%) | 0 (0.0%) |
| Bachelor's Degree or higher | 26 (100.0%) | 0 (0.0%) |
| Total | 205 (92.3%) | 3 (1.5%) |
Employment Occupations by Sex in Northport
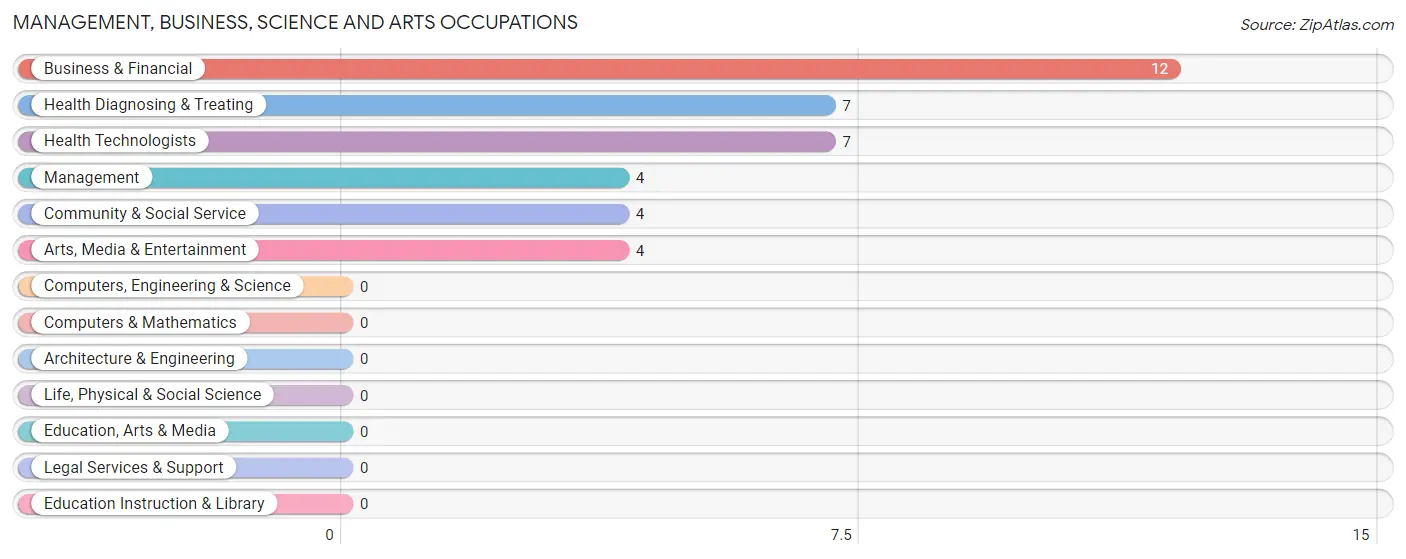
Management, Business, Science and Arts Occupations
The most common Management, Business, Science and Arts occupations in Northport are Business & Financial (12 | 5.2%), Health Diagnosing & Treating (7 | 3.1%), Health Technologists (7 | 3.1%), Management (4 | 1.8%), and Community & Social Service (4 | 1.8%).
Management, Business, Science and Arts Occupations by Sex
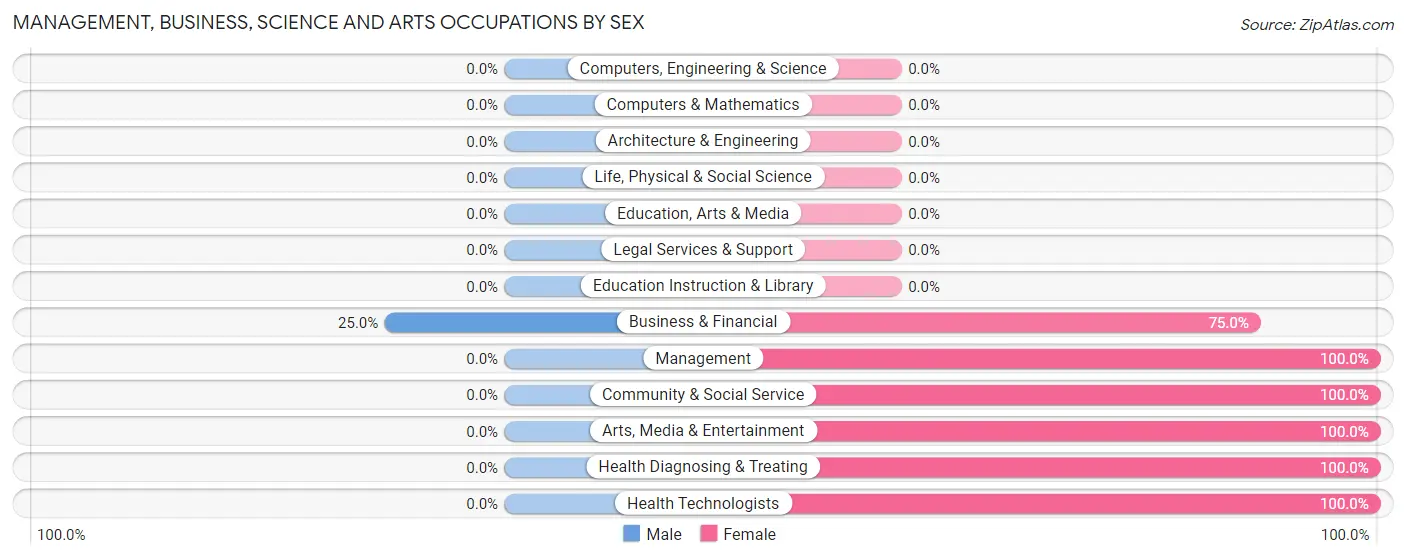
| Occupation | Male | Female |
| Management | 0 (0.0%) | 4 (100.0%) |
| Business & Financial | 3 (25.0%) | 9 (75.0%) |
| Computers, Engineering & Science | 0 (0.0%) | 0 (0.0%) |
| Computers & Mathematics | 0 (0.0%) | 0 (0.0%) |
| Architecture & Engineering | 0 (0.0%) | 0 (0.0%) |
| Life, Physical & Social Science | 0 (0.0%) | 0 (0.0%) |
| Community & Social Service | 0 (0.0%) | 4 (100.0%) |
| Education, Arts & Media | 0 (0.0%) | 0 (0.0%) |
| Legal Services & Support | 0 (0.0%) | 0 (0.0%) |
| Education Instruction & Library | 0 (0.0%) | 0 (0.0%) |
| Arts, Media & Entertainment | 0 (0.0%) | 4 (100.0%) |
| Health Diagnosing & Treating | 0 (0.0%) | 7 (100.0%) |
| Health Technologists | 0 (0.0%) | 7 (100.0%) |
| Total (Category) | 3 (11.1%) | 24 (88.9%) |
| Total (Overall) | 132 (57.6%) | 97 (42.4%) |
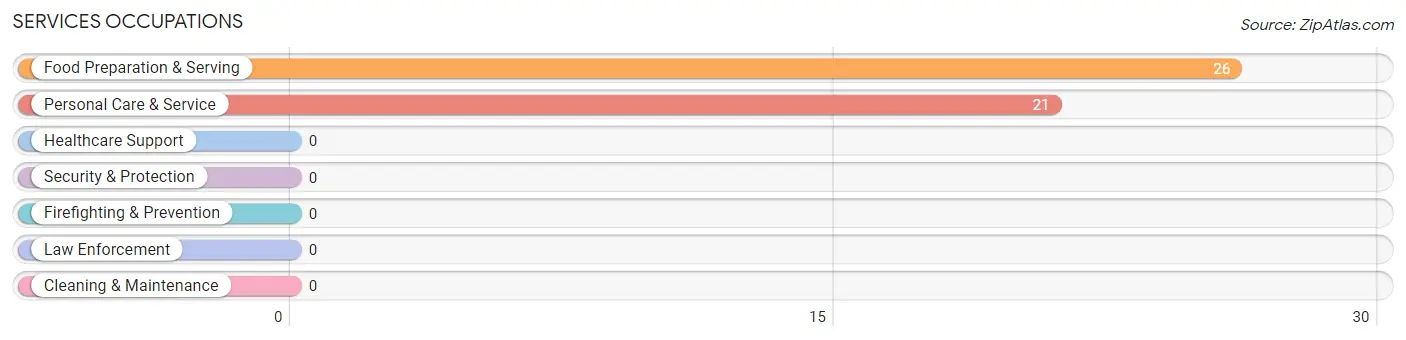
Services Occupations
The most common Services occupations in Northport are Food Preparation & Serving (26 | 11.4%), and Personal Care & Service (21 | 9.2%).
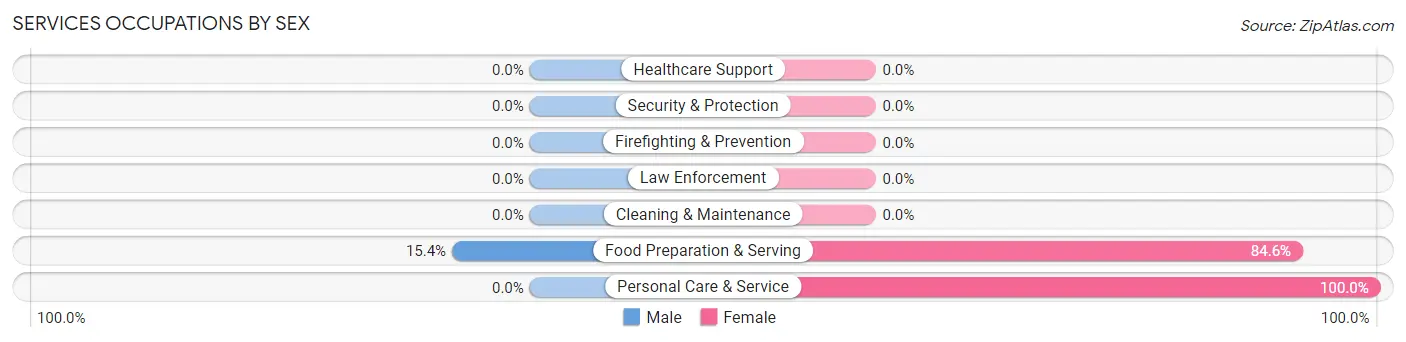
Services Occupations by Sex
| Occupation | Male | Female |
| Healthcare Support | 0 (0.0%) | 0 (0.0%) |
| Security & Protection | 0 (0.0%) | 0 (0.0%) |
| Firefighting & Prevention | 0 (0.0%) | 0 (0.0%) |
| Law Enforcement | 0 (0.0%) | 0 (0.0%) |
| Food Preparation & Serving | 4 (15.4%) | 22 (84.6%) |
| Cleaning & Maintenance | 0 (0.0%) | 0 (0.0%) |
| Personal Care & Service | 0 (0.0%) | 21 (100.0%) |
| Total (Category) | 4 (8.5%) | 43 (91.5%) |
| Total (Overall) | 132 (57.6%) | 97 (42.4%) |
Sales and Office Occupations
The most common Sales and Office occupations in Northport are Office & Administration (13 | 5.7%), and Sales & Related (10 | 4.4%).
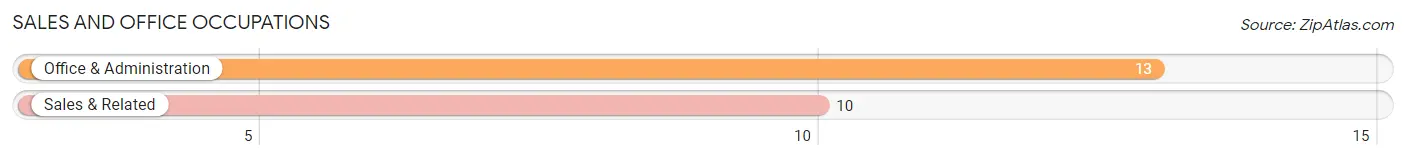
Sales and Office Occupations by Sex
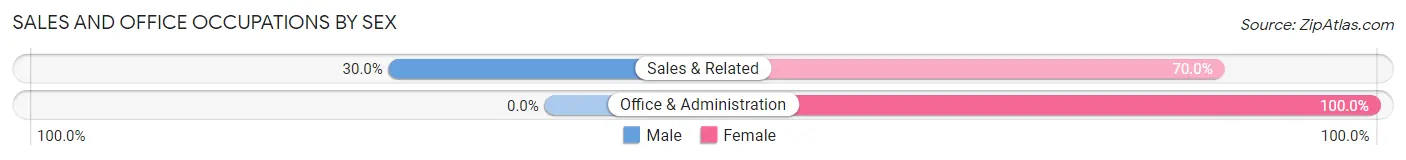
| Occupation | Male | Female |
| Sales & Related | 3 (30.0%) | 7 (70.0%) |
| Office & Administration | 0 (0.0%) | 13 (100.0%) |
| Total (Category) | 3 (13.0%) | 20 (87.0%) |
| Total (Overall) | 132 (57.6%) | 97 (42.4%) |
Natural Resources, Construction and Maintenance Occupations
The most common Natural Resources, Construction and Maintenance occupations in Northport are Installation, Maintenance & Repair (39 | 17.0%), and Construction & Extraction (23 | 10.0%).
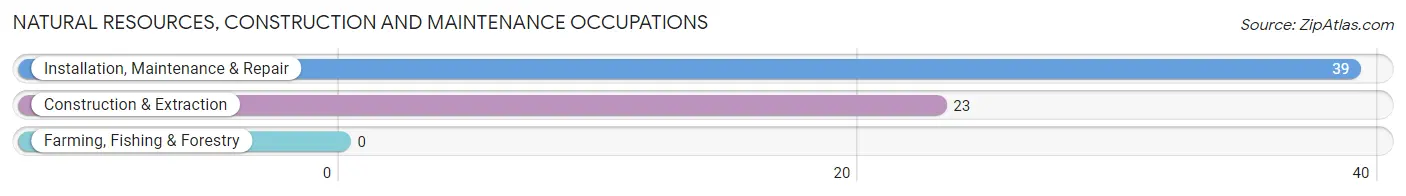
Natural Resources, Construction and Maintenance Occupations by Sex
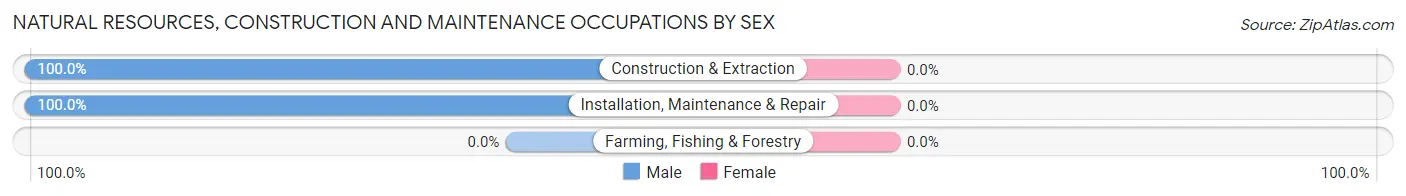
| Occupation | Male | Female |
| Farming, Fishing & Forestry | 0 (0.0%) | 0 (0.0%) |
| Construction & Extraction | 23 (100.0%) | 0 (0.0%) |
| Installation, Maintenance & Repair | 39 (100.0%) | 0 (0.0%) |
| Total (Category) | 62 (100.0%) | 0 (0.0%) |
| Total (Overall) | 132 (57.6%) | 97 (42.4%) |
Production, Transportation and Moving Occupations
The most common Production, Transportation and Moving occupations in Northport are Production (43 | 18.8%), Material Moving (23 | 10.0%), and Transportation (4 | 1.8%).
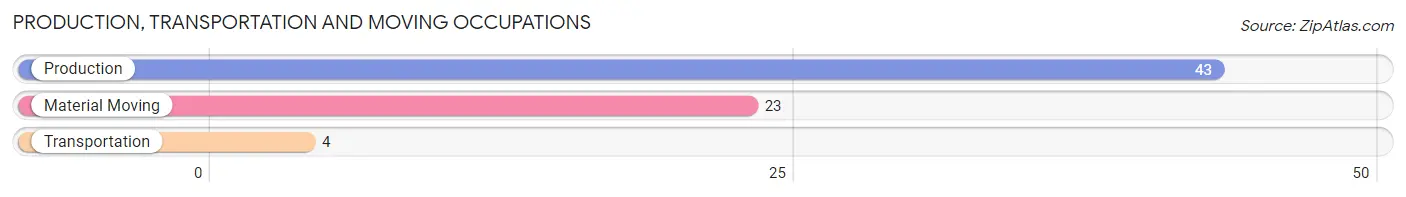
Production, Transportation and Moving Occupations by Sex
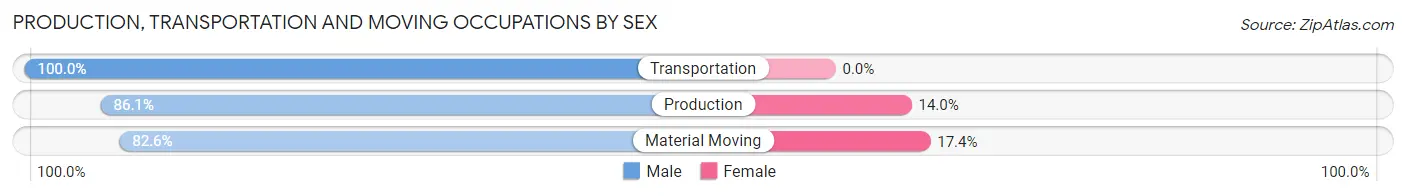
| Occupation | Male | Female |
| Production | 37 (86.1%) | 6 (14.0%) |
| Transportation | 4 (100.0%) | 0 (0.0%) |
| Material Moving | 19 (82.6%) | 4 (17.4%) |
| Total (Category) | 60 (85.7%) | 10 (14.3%) |
| Total (Overall) | 132 (57.6%) | 97 (42.4%) |
Employment Industries by Sex in Northport
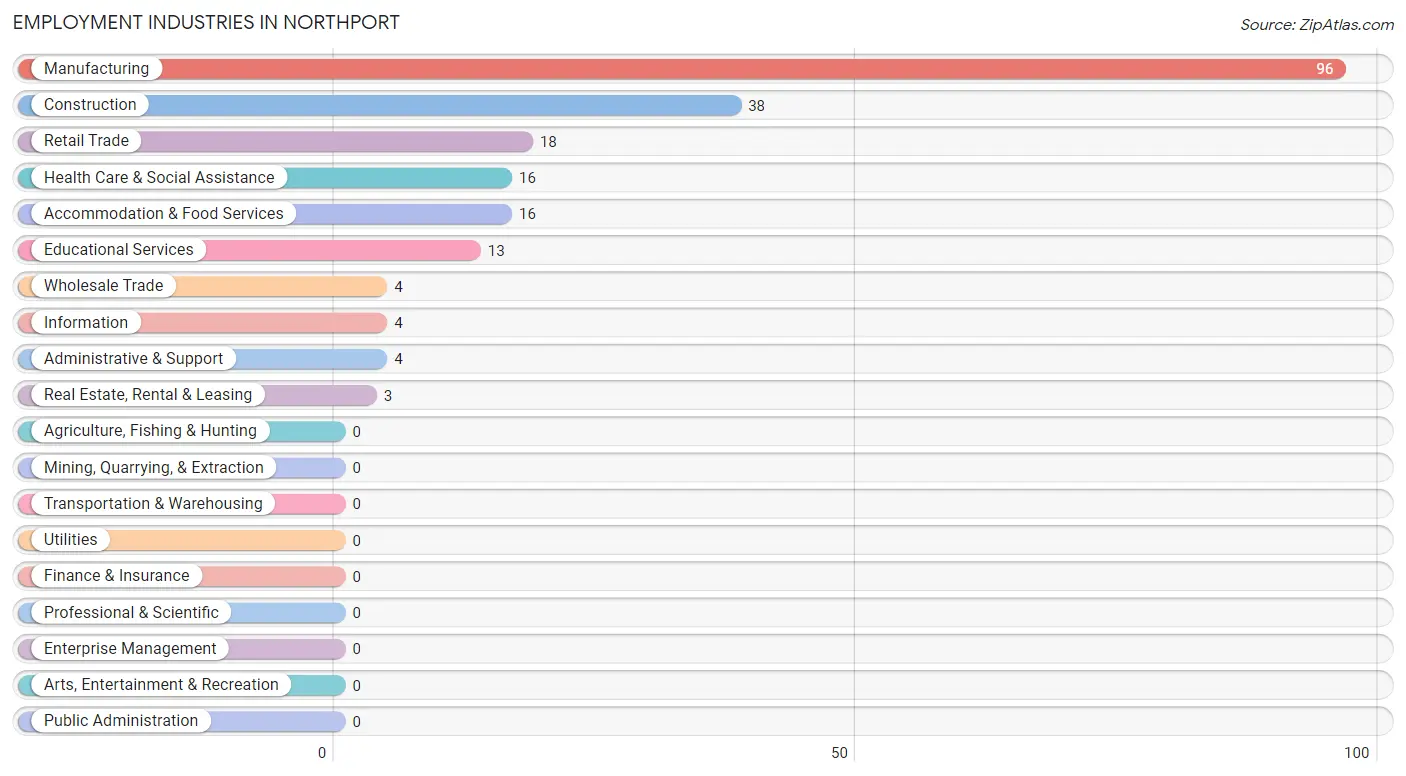
Employment Industries in Northport
The major employment industries in Northport include Manufacturing (96 | 41.9%), Construction (38 | 16.6%), Retail Trade (18 | 7.9%), Health Care & Social Assistance (16 | 7.0%), and Accommodation & Food Services (16 | 7.0%).
Employment Industries by Sex in Northport
The Northport industries that see more men than women are Information (100.0%), Real Estate, Rental & Leasing (100.0%), and Construction (89.5%), whereas the industries that tend to have a higher number of women are Wholesale Trade (100.0%), Administrative & Support (100.0%), and Health Care & Social Assistance (100.0%).
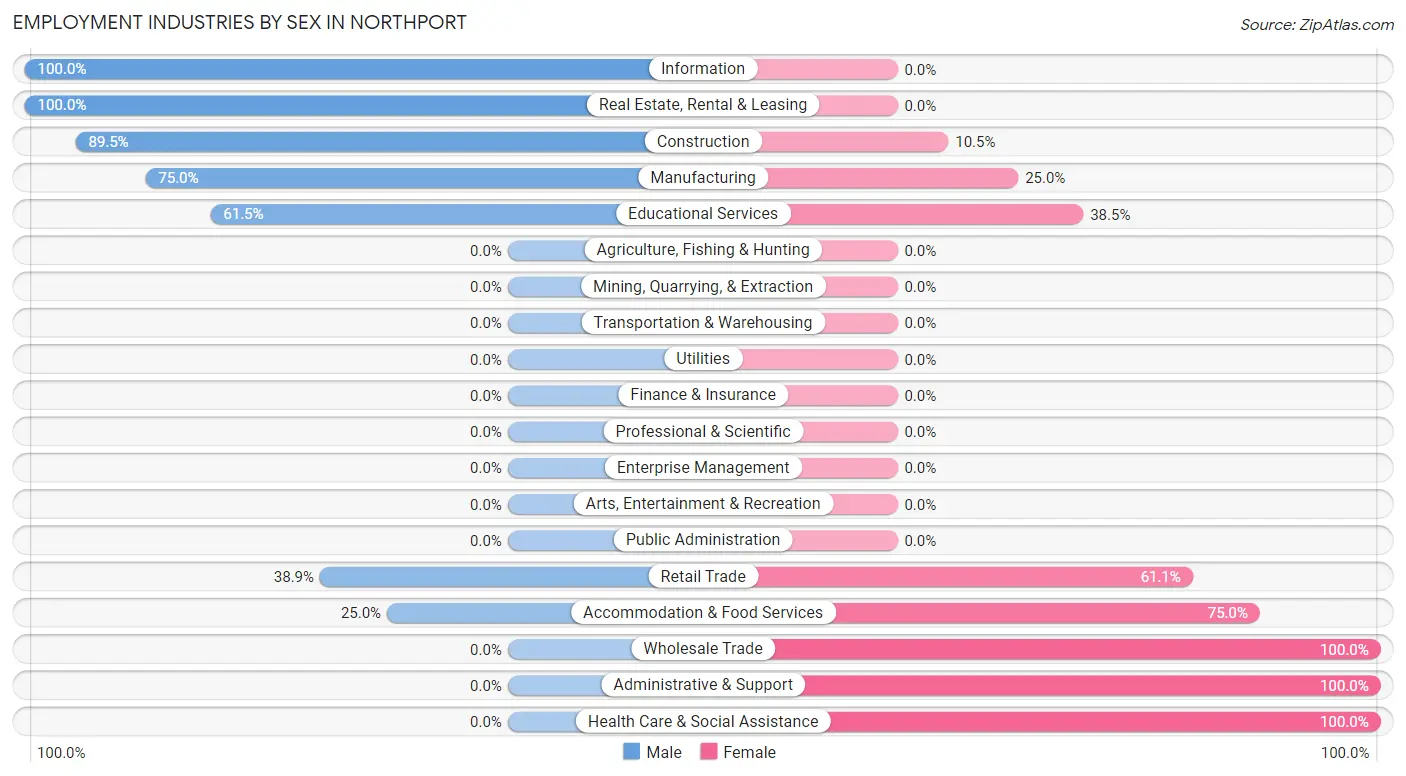
| Industry | Male | Female |
| Agriculture, Fishing & Hunting | 0 (0.0%) | 0 (0.0%) |
| Mining, Quarrying, & Extraction | 0 (0.0%) | 0 (0.0%) |
| Construction | 34 (89.5%) | 4 (10.5%) |
| Manufacturing | 72 (75.0%) | 24 (25.0%) |
| Wholesale Trade | 0 (0.0%) | 4 (100.0%) |
| Retail Trade | 7 (38.9%) | 11 (61.1%) |
| Transportation & Warehousing | 0 (0.0%) | 0 (0.0%) |
| Utilities | 0 (0.0%) | 0 (0.0%) |
| Information | 4 (100.0%) | 0 (0.0%) |
| Finance & Insurance | 0 (0.0%) | 0 (0.0%) |
| Real Estate, Rental & Leasing | 3 (100.0%) | 0 (0.0%) |
| Professional & Scientific | 0 (0.0%) | 0 (0.0%) |
| Enterprise Management | 0 (0.0%) | 0 (0.0%) |
| Administrative & Support | 0 (0.0%) | 4 (100.0%) |
| Educational Services | 8 (61.5%) | 5 (38.5%) |
| Health Care & Social Assistance | 0 (0.0%) | 16 (100.0%) |
| Arts, Entertainment & Recreation | 0 (0.0%) | 0 (0.0%) |
| Accommodation & Food Services | 4 (25.0%) | 12 (75.0%) |
| Public Administration | 0 (0.0%) | 0 (0.0%) |
| Total | 132 (57.6%) | 97 (42.4%) |
Education in Northport
School Enrollment in Northport
The most common levels of schooling among the 65 students in Northport are elementary school (21 | 32.3%), college / undergraduate (15 | 23.1%), and kindergarten (13 | 20.0%).
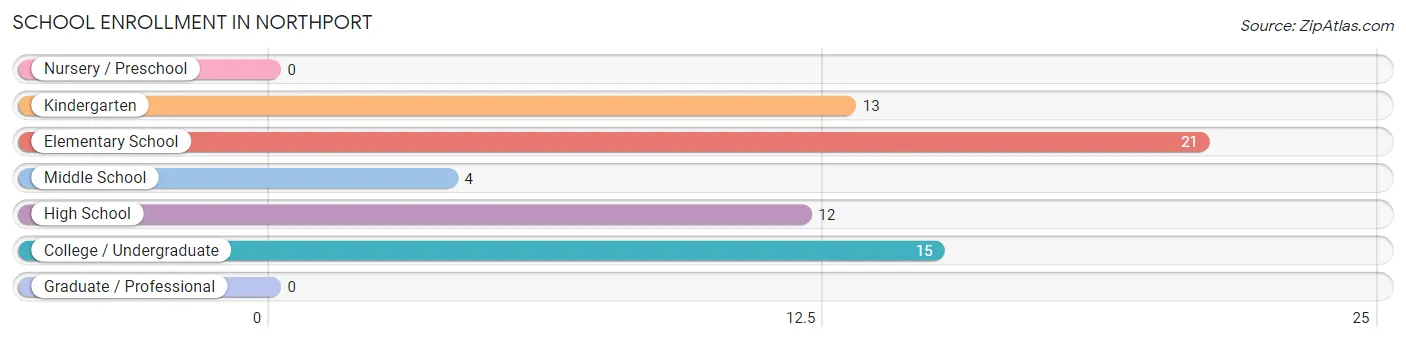
| School Level | # Students | % Students |
| Nursery / Preschool | 0 | 0.0% |
| Kindergarten | 13 | 20.0% |
| Elementary School | 21 | 32.3% |
| Middle School | 4 | 6.1% |
| High School | 12 | 18.5% |
| College / Undergraduate | 15 | 23.1% |
| Graduate / Professional | 0 | 0.0% |
| Total | 65 | 100.0% |
School Enrollment by Age by Funding Source in Northport
Out of a total of 65 students who are enrolled in schools in Northport, 10 (15.4%) attend a private institution, while the remaining 55 (84.6%) are enrolled in public schools. The age group of 20 to 24 year olds has the highest likelihood of being enrolled in private schools, with 4 (100.0% in the age bracket) enrolled. Conversely, the age group of 10 to 14 year olds has the lowest likelihood of being enrolled in a private school, with 4 (100.0% in the age bracket) attending a public institution.
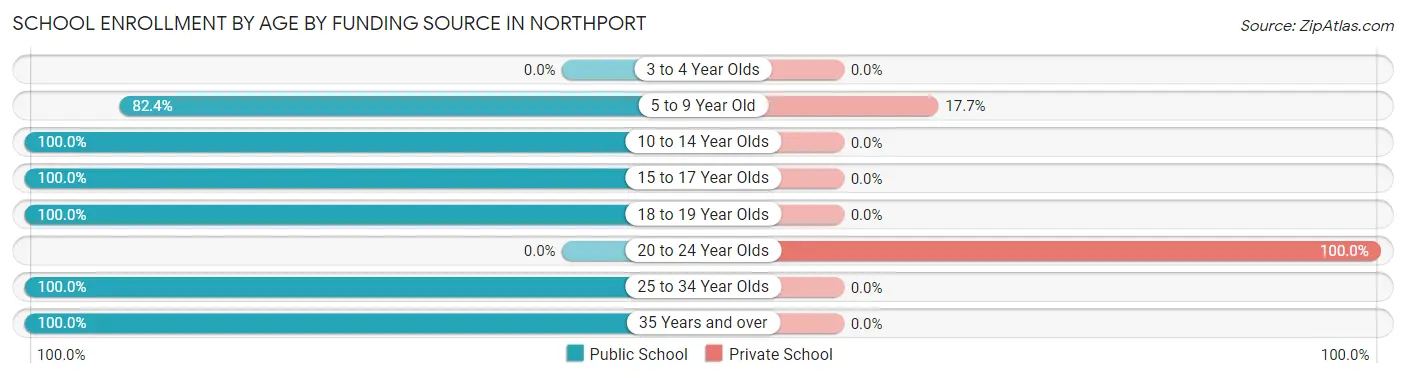
| Age Bracket | Public School | Private School |
| 3 to 4 Year Olds | 0 (0.0%) | 0 (0.0%) |
| 5 to 9 Year Old | 28 (82.4%) | 6 (17.6%) |
| 10 to 14 Year Olds | 4 (100.0%) | 0 (0.0%) |
| 15 to 17 Year Olds | 7 (100.0%) | 0 (0.0%) |
| 18 to 19 Year Olds | 5 (100.0%) | 0 (0.0%) |
| 20 to 24 Year Olds | 0 (0.0%) | 4 (100.0%) |
| 25 to 34 Year Olds | 3 (100.0%) | 0 (0.0%) |
| 35 Years and over | 8 (100.0%) | 0 (0.0%) |
| Total | 55 (84.6%) | 10 (15.4%) |
Educational Attainment by Field of Study in Northport
Science & technology (11 | 37.9%), business (8 | 27.6%), bio, nature & agricultural (4 | 13.8%), physical & health sciences (3 | 10.3%), and social sciences (3 | 10.3%) are the most common fields of study among 29 individuals in Northport who have obtained a bachelor's degree or higher.
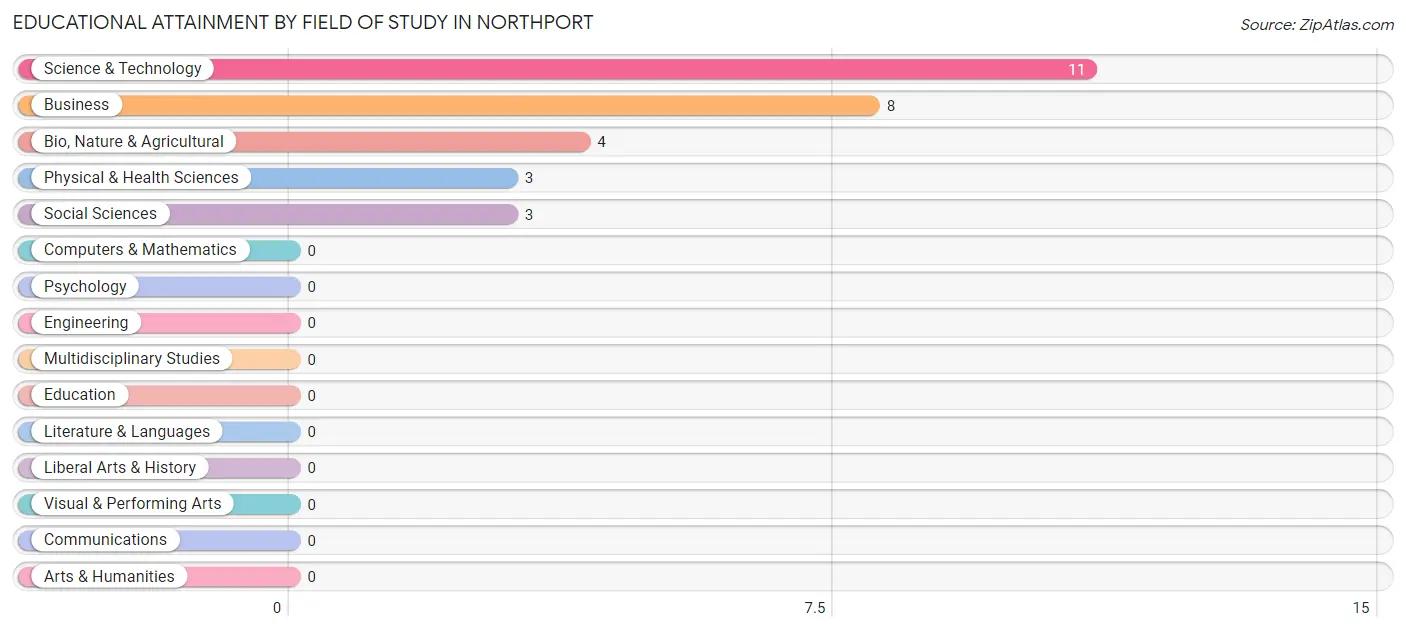
| Field of Study | # Graduates | % Graduates |
| Computers & Mathematics | 0 | 0.0% |
| Bio, Nature & Agricultural | 4 | 13.8% |
| Physical & Health Sciences | 3 | 10.3% |
| Psychology | 0 | 0.0% |
| Social Sciences | 3 | 10.3% |
| Engineering | 0 | 0.0% |
| Multidisciplinary Studies | 0 | 0.0% |
| Science & Technology | 11 | 37.9% |
| Business | 8 | 27.6% |
| Education | 0 | 0.0% |
| Literature & Languages | 0 | 0.0% |
| Liberal Arts & History | 0 | 0.0% |
| Visual & Performing Arts | 0 | 0.0% |
| Communications | 0 | 0.0% |
| Arts & Humanities | 0 | 0.0% |
| Total | 29 | 100.0% |
Transportation & Commute in Northport
Vehicle Availability by Sex in Northport
The most prevalent vehicle ownership categories in Northport are males with 3 vehicles (61, accounting for 46.2%) and females with 3 vehicles (34, making up 62.9%).
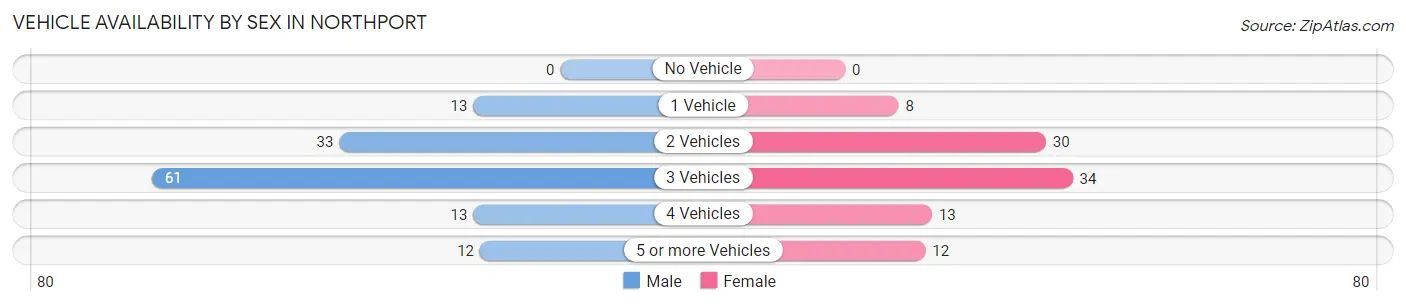
| Vehicles Available | Male | Female |
| No Vehicle | 0 (0.0%) | 0 (0.0%) |
| 1 Vehicle | 13 (9.9%) | 8 (8.3%) |
| 2 Vehicles | 33 (25.0%) | 30 (30.9%) |
| 3 Vehicles | 61 (46.2%) | 34 (35.0%) |
| 4 Vehicles | 13 (9.9%) | 13 (13.4%) |
| 5 or more Vehicles | 12 (9.1%) | 12 (12.4%) |
| Total | 132 (100.0%) | 97 (100.0%) |
Commute Time in Northport
The most frequently occuring commute durations in Northport are 15 to 19 minutes (60 commuters, 29.4%), 35 to 39 minutes (27 commuters, 13.2%), and 30 to 34 minutes (23 commuters, 11.3%).
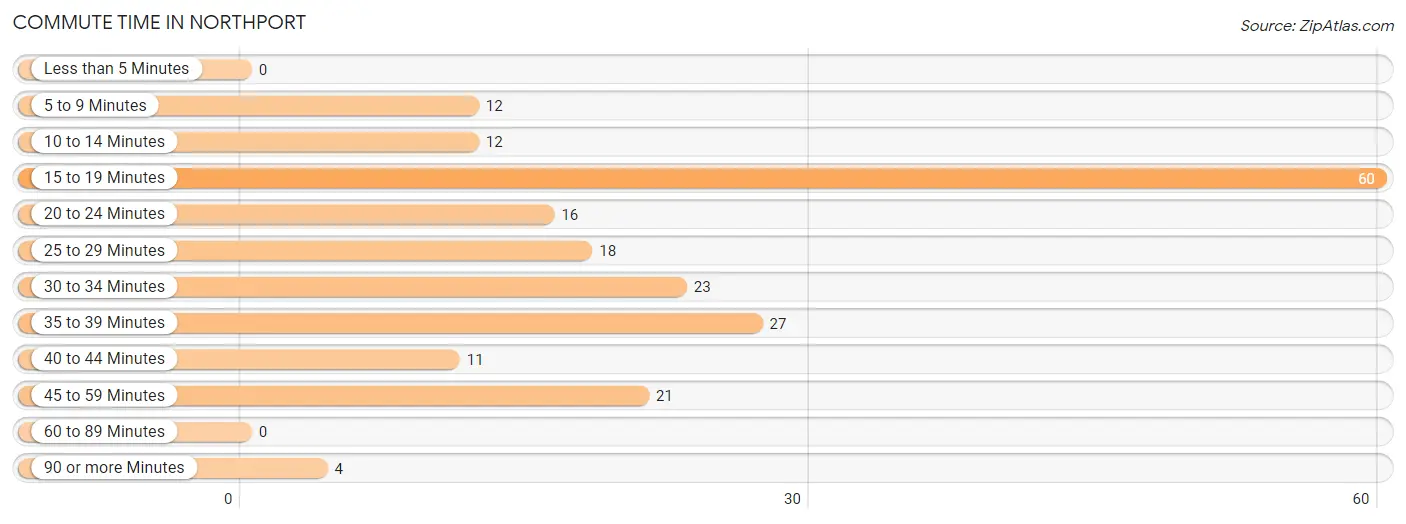
| Commute Time | # Commuters | % Commuters |
| Less than 5 Minutes | 0 | 0.0% |
| 5 to 9 Minutes | 12 | 5.9% |
| 10 to 14 Minutes | 12 | 5.9% |
| 15 to 19 Minutes | 60 | 29.4% |
| 20 to 24 Minutes | 16 | 7.8% |
| 25 to 29 Minutes | 18 | 8.8% |
| 30 to 34 Minutes | 23 | 11.3% |
| 35 to 39 Minutes | 27 | 13.2% |
| 40 to 44 Minutes | 11 | 5.4% |
| 45 to 59 Minutes | 21 | 10.3% |
| 60 to 89 Minutes | 0 | 0.0% |
| 90 or more Minutes | 4 | 2.0% |
Commute Time by Sex in Northport
The most common commute times in Northport are 15 to 19 minutes (56 commuters, 43.8%) for males and 25 to 29 minutes (14 commuters, 18.4%) for females.
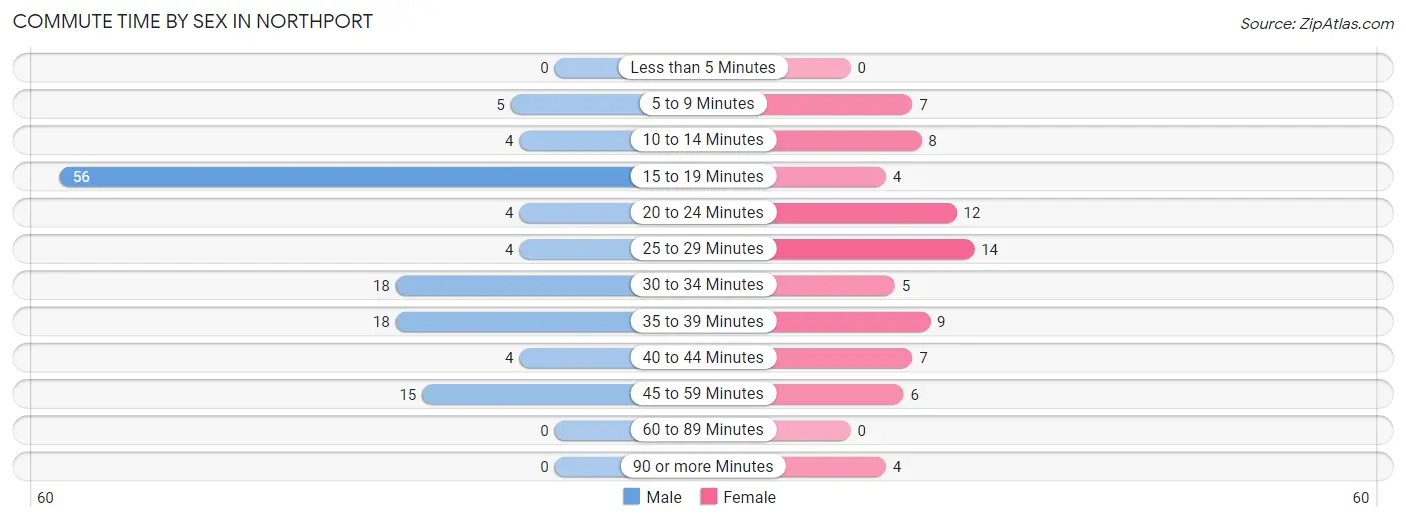
| Commute Time | Male | Female |
| Less than 5 Minutes | 0 (0.0%) | 0 (0.0%) |
| 5 to 9 Minutes | 5 (3.9%) | 7 (9.2%) |
| 10 to 14 Minutes | 4 (3.1%) | 8 (10.5%) |
| 15 to 19 Minutes | 56 (43.8%) | 4 (5.3%) |
| 20 to 24 Minutes | 4 (3.1%) | 12 (15.8%) |
| 25 to 29 Minutes | 4 (3.1%) | 14 (18.4%) |
| 30 to 34 Minutes | 18 (14.1%) | 5 (6.6%) |
| 35 to 39 Minutes | 18 (14.1%) | 9 (11.8%) |
| 40 to 44 Minutes | 4 (3.1%) | 7 (9.2%) |
| 45 to 59 Minutes | 15 (11.7%) | 6 (7.9%) |
| 60 to 89 Minutes | 0 (0.0%) | 0 (0.0%) |
| 90 or more Minutes | 0 (0.0%) | 4 (5.3%) |
Time of Departure to Work by Sex in Northport
The most frequent times of departure to work in Northport are 12:00 AM to 4:59 AM (26, 20.3%) for males and 5:00 AM to 5:29 AM (16, 21.0%) for females.
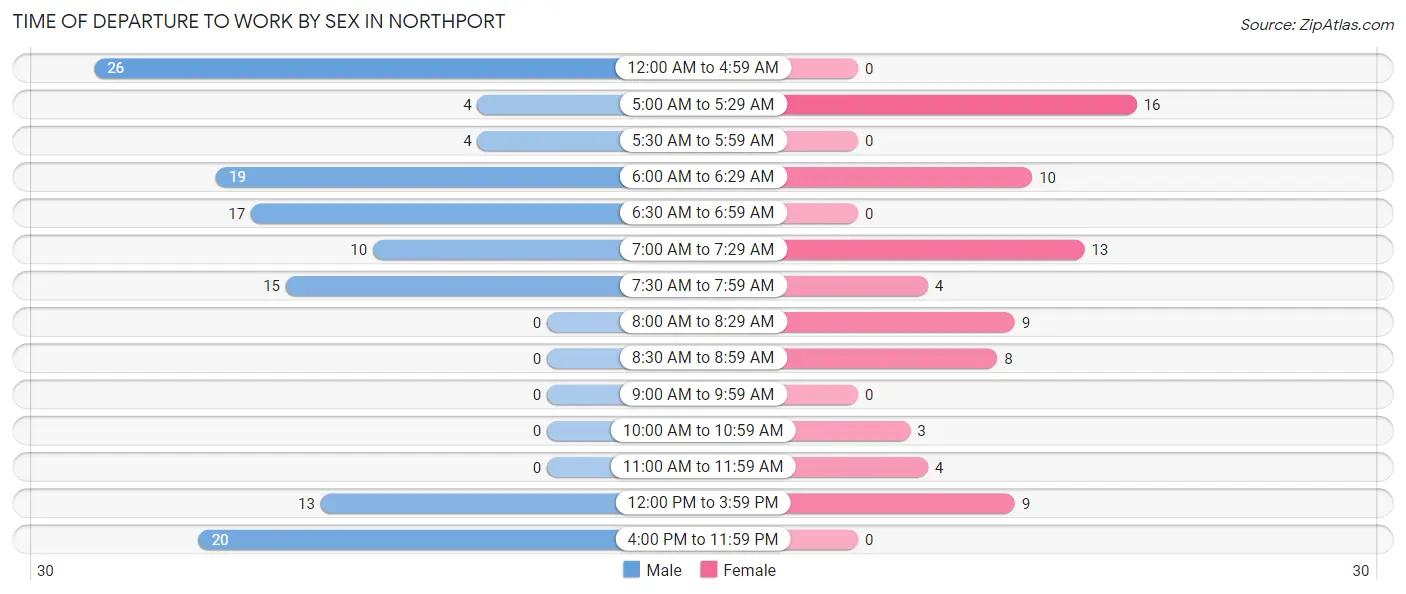
| Time of Departure | Male | Female |
| 12:00 AM to 4:59 AM | 26 (20.3%) | 0 (0.0%) |
| 5:00 AM to 5:29 AM | 4 (3.1%) | 16 (21.0%) |
| 5:30 AM to 5:59 AM | 4 (3.1%) | 0 (0.0%) |
| 6:00 AM to 6:29 AM | 19 (14.8%) | 10 (13.2%) |
| 6:30 AM to 6:59 AM | 17 (13.3%) | 0 (0.0%) |
| 7:00 AM to 7:29 AM | 10 (7.8%) | 13 (17.1%) |
| 7:30 AM to 7:59 AM | 15 (11.7%) | 4 (5.3%) |
| 8:00 AM to 8:29 AM | 0 (0.0%) | 9 (11.8%) |
| 8:30 AM to 8:59 AM | 0 (0.0%) | 8 (10.5%) |
| 9:00 AM to 9:59 AM | 0 (0.0%) | 0 (0.0%) |
| 10:00 AM to 10:59 AM | 0 (0.0%) | 3 (4.0%) |
| 11:00 AM to 11:59 AM | 0 (0.0%) | 4 (5.3%) |
| 12:00 PM to 3:59 PM | 13 (10.2%) | 9 (11.8%) |
| 4:00 PM to 11:59 PM | 20 (15.6%) | 0 (0.0%) |
| Total | 128 (100.0%) | 76 (100.0%) |
Housing Occupancy in Northport
Occupancy by Ownership in Northport
Of the total 161 dwellings in Northport, owner-occupied units account for 145 (90.1%), while renter-occupied units make up 16 (9.9%).
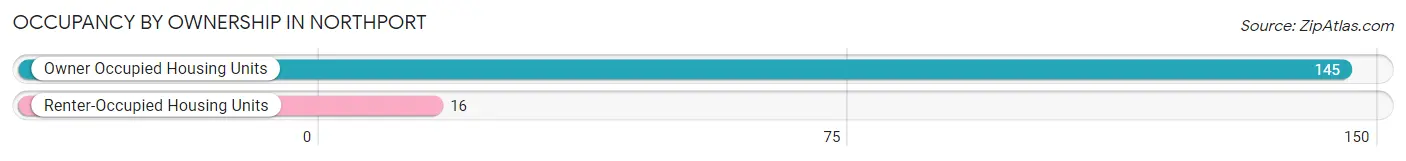
| Occupancy | # Housing Units | % Housing Units |
| Owner Occupied Housing Units | 145 | 90.1% |
| Renter-Occupied Housing Units | 16 | 9.9% |
| Total Occupied Housing Units | 161 | 100.0% |
Occupancy by Household Size in Northport
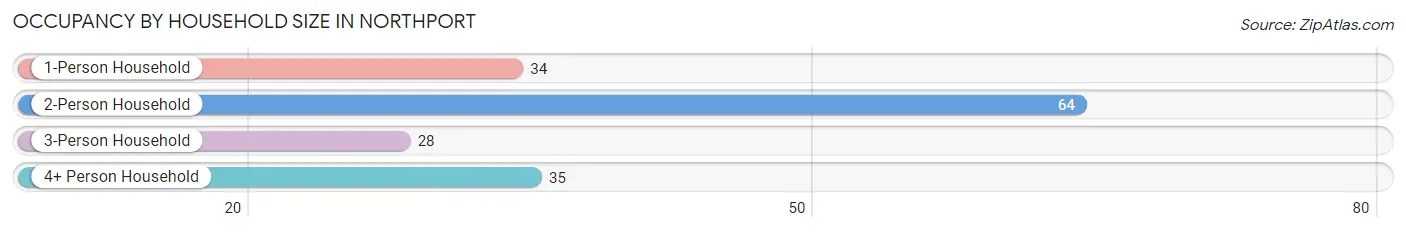
| Household Size | # Housing Units | % Housing Units |
| 1-Person Household | 34 | 21.1% |
| 2-Person Household | 64 | 39.8% |
| 3-Person Household | 28 | 17.4% |
| 4+ Person Household | 35 | 21.7% |
| Total Housing Units | 161 | 100.0% |
Occupancy by Ownership by Household Size in Northport
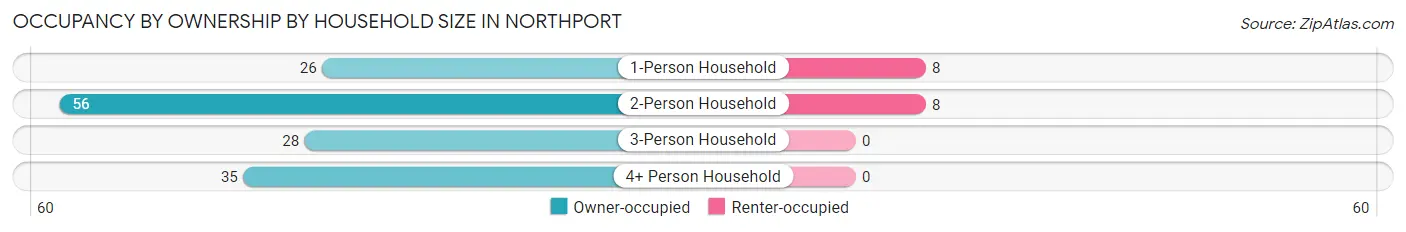
| Household Size | Owner-occupied | Renter-occupied |
| 1-Person Household | 26 (76.5%) | 8 (23.5%) |
| 2-Person Household | 56 (87.5%) | 8 (12.5%) |
| 3-Person Household | 28 (100.0%) | 0 (0.0%) |
| 4+ Person Household | 35 (100.0%) | 0 (0.0%) |
| Total Housing Units | 145 (90.1%) | 16 (9.9%) |
Occupancy by Educational Attainment in Northport
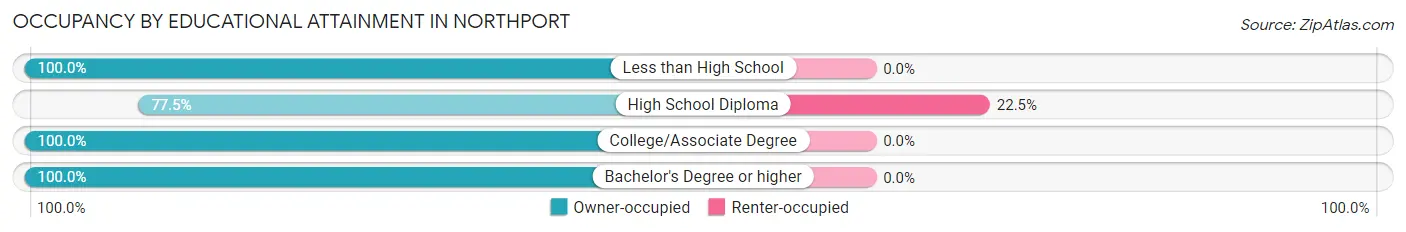
| Household Size | Owner-occupied | Renter-occupied |
| Less than High School | 19 (100.0%) | 0 (0.0%) |
| High School Diploma | 55 (77.5%) | 16 (22.5%) |
| College/Associate Degree | 59 (100.0%) | 0 (0.0%) |
| Bachelor's Degree or higher | 12 (100.0%) | 0 (0.0%) |
Occupancy by Age of Householder in Northport
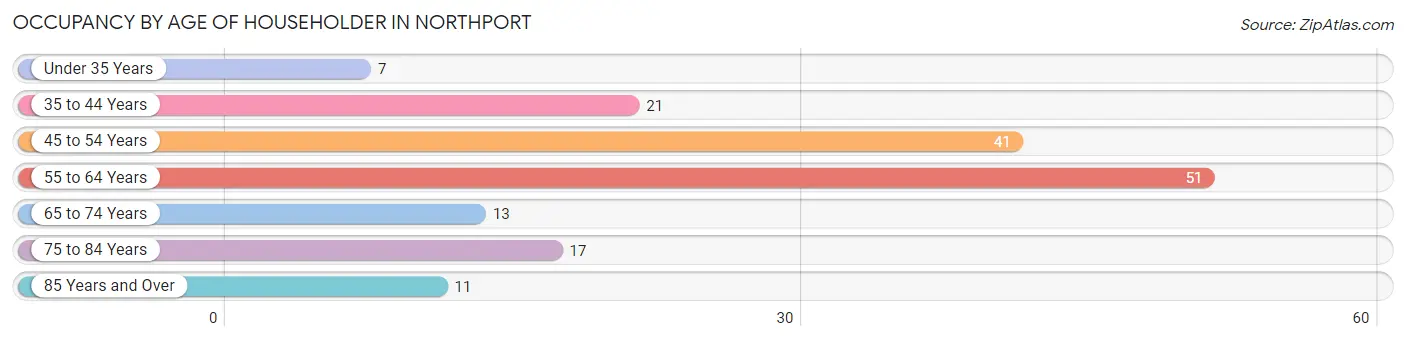
| Age Bracket | # Households | % Households |
| Under 35 Years | 7 | 4.3% |
| 35 to 44 Years | 21 | 13.0% |
| 45 to 54 Years | 41 | 25.5% |
| 55 to 64 Years | 51 | 31.7% |
| 65 to 74 Years | 13 | 8.1% |
| 75 to 84 Years | 17 | 10.6% |
| 85 Years and Over | 11 | 6.8% |
| Total | 161 | 100.0% |
Housing Finances in Northport
Median Income by Occupancy in Northport
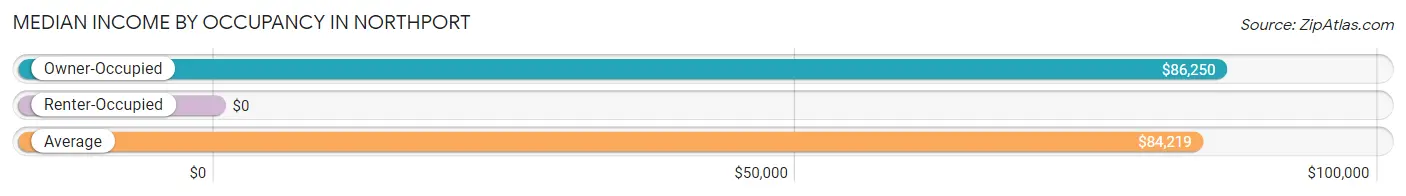
| Occupancy Type | # Households | Median Income |
| Owner-Occupied | 145 (90.1%) | $86,250 |
| Renter-Occupied | 16 (9.9%) | $0 |
| Average | 161 (100.0%) | $84,219 |
Occupancy by Householder Income Bracket in Northport
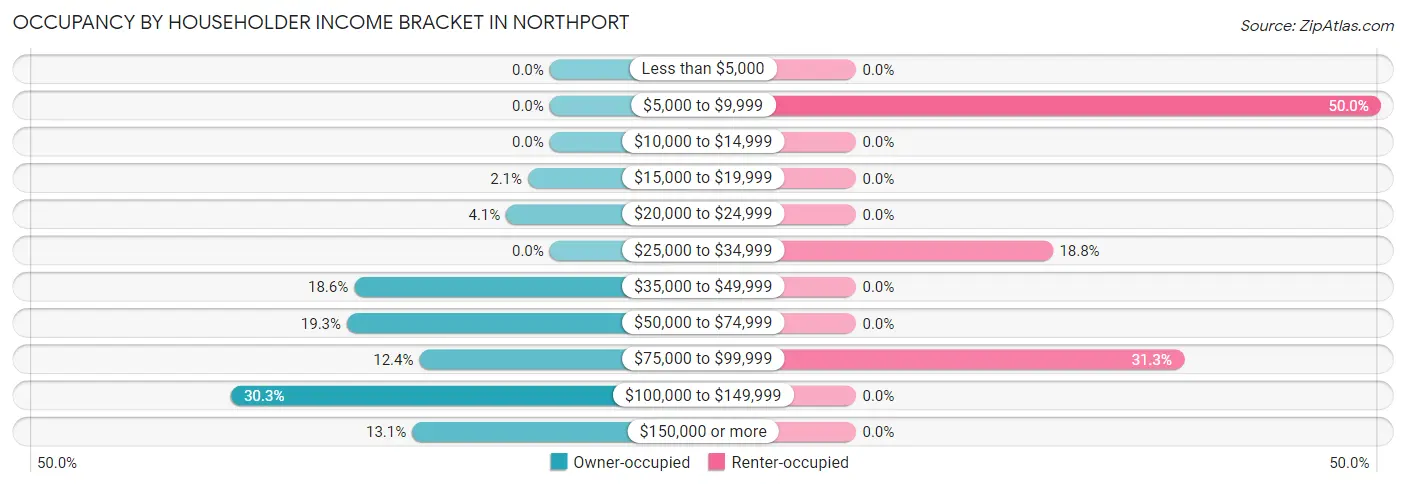
| Income Bracket | Owner-occupied | Renter-occupied |
| Less than $5,000 | 0 (0.0%) | 0 (0.0%) |
| $5,000 to $9,999 | 0 (0.0%) | 8 (50.0%) |
| $10,000 to $14,999 | 0 (0.0%) | 0 (0.0%) |
| $15,000 to $19,999 | 3 (2.1%) | 0 (0.0%) |
| $20,000 to $24,999 | 6 (4.1%) | 0 (0.0%) |
| $25,000 to $34,999 | 0 (0.0%) | 3 (18.8%) |
| $35,000 to $49,999 | 27 (18.6%) | 0 (0.0%) |
| $50,000 to $74,999 | 28 (19.3%) | 0 (0.0%) |
| $75,000 to $99,999 | 18 (12.4%) | 5 (31.2%) |
| $100,000 to $149,999 | 44 (30.3%) | 0 (0.0%) |
| $150,000 or more | 19 (13.1%) | 0 (0.0%) |
| Total | 145 (100.0%) | 16 (100.0%) |
Monthly Housing Cost Tiers in Northport
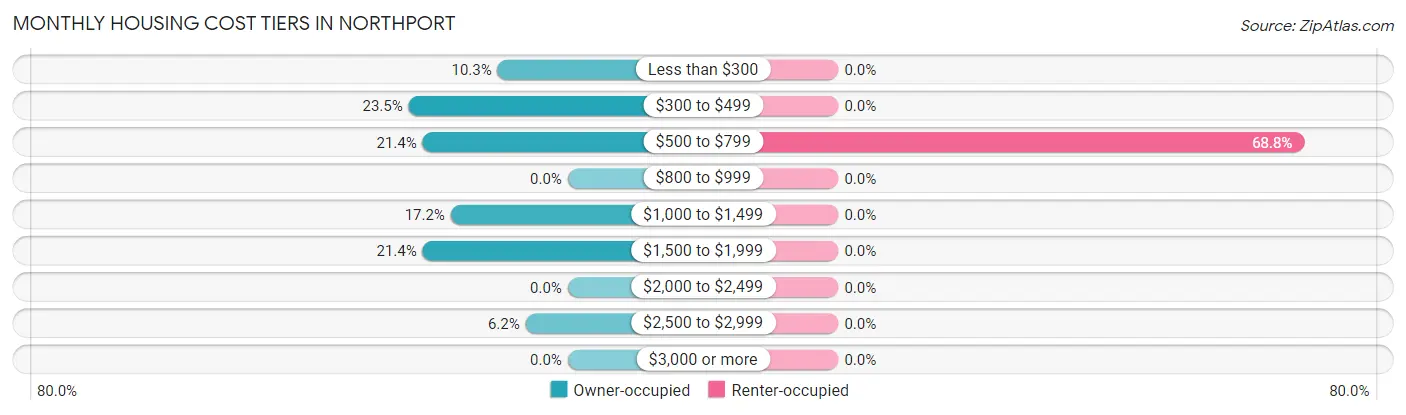
| Monthly Cost | Owner-occupied | Renter-occupied |
| Less than $300 | 15 (10.3%) | 0 (0.0%) |
| $300 to $499 | 34 (23.4%) | 0 (0.0%) |
| $500 to $799 | 31 (21.4%) | 11 (68.8%) |
| $800 to $999 | 0 (0.0%) | 0 (0.0%) |
| $1,000 to $1,499 | 25 (17.2%) | 0 (0.0%) |
| $1,500 to $1,999 | 31 (21.4%) | 0 (0.0%) |
| $2,000 to $2,499 | 0 (0.0%) | 0 (0.0%) |
| $2,500 to $2,999 | 9 (6.2%) | 0 (0.0%) |
| $3,000 or more | 0 (0.0%) | 0 (0.0%) |
| Total | 145 (100.0%) | 16 (100.0%) |
Physical Housing Characteristics in Northport
Housing Structures in Northport
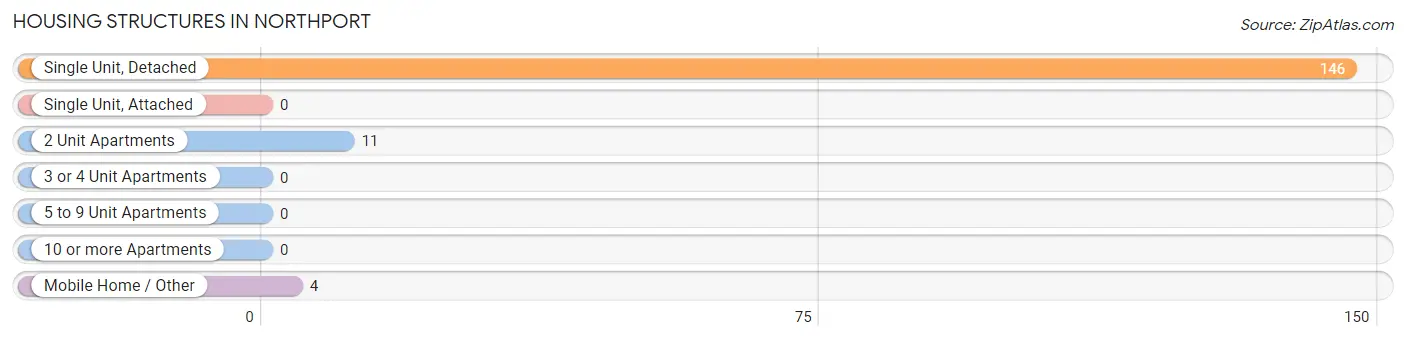
| Structure Type | # Housing Units | % Housing Units |
| Single Unit, Detached | 146 | 90.7% |
| Single Unit, Attached | 0 | 0.0% |
| 2 Unit Apartments | 11 | 6.8% |
| 3 or 4 Unit Apartments | 0 | 0.0% |
| 5 to 9 Unit Apartments | 0 | 0.0% |
| 10 or more Apartments | 0 | 0.0% |
| Mobile Home / Other | 4 | 2.5% |
| Total | 161 | 100.0% |
Housing Structures by Occupancy in Northport
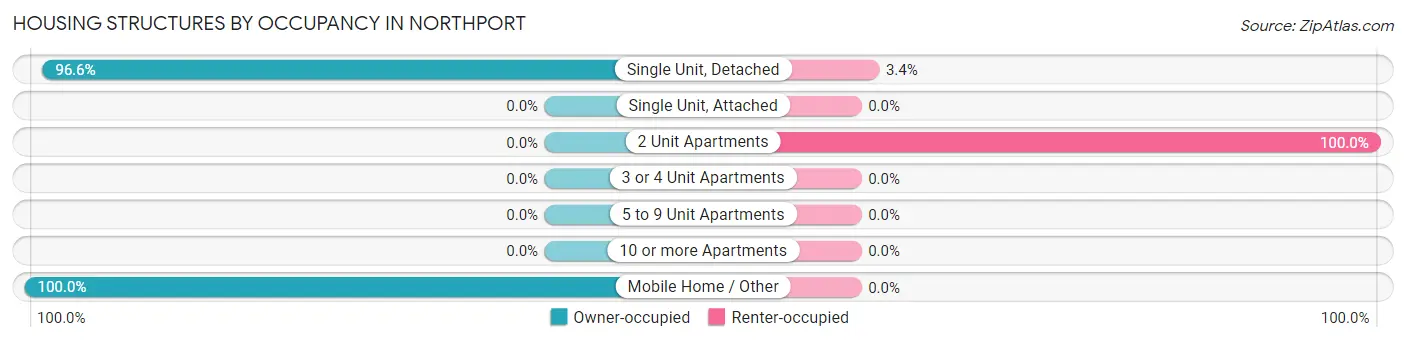
| Structure Type | Owner-occupied | Renter-occupied |
| Single Unit, Detached | 141 (96.6%) | 5 (3.4%) |
| Single Unit, Attached | 0 (0.0%) | 0 (0.0%) |
| 2 Unit Apartments | 0 (0.0%) | 11 (100.0%) |
| 3 or 4 Unit Apartments | 0 (0.0%) | 0 (0.0%) |
| 5 to 9 Unit Apartments | 0 (0.0%) | 0 (0.0%) |
| 10 or more Apartments | 0 (0.0%) | 0 (0.0%) |
| Mobile Home / Other | 4 (100.0%) | 0 (0.0%) |
| Total | 145 (90.1%) | 16 (9.9%) |
Housing Structures by Number of Rooms in Northport
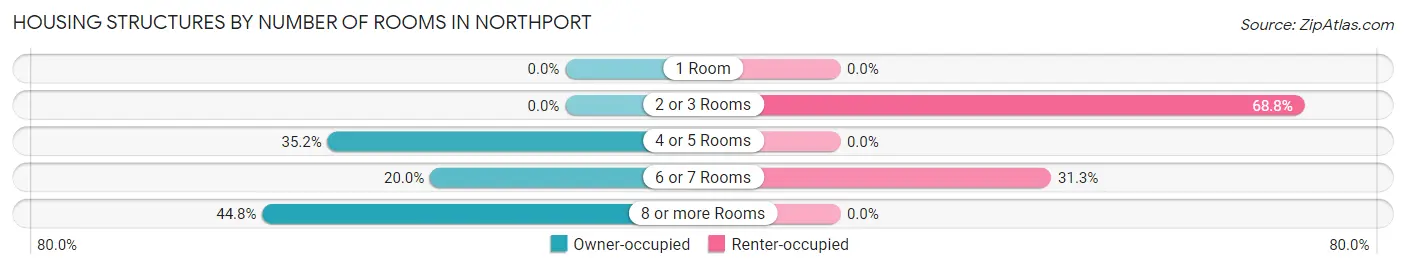
| Number of Rooms | Owner-occupied | Renter-occupied |
| 1 Room | 0 (0.0%) | 0 (0.0%) |
| 2 or 3 Rooms | 0 (0.0%) | 11 (68.8%) |
| 4 or 5 Rooms | 51 (35.2%) | 0 (0.0%) |
| 6 or 7 Rooms | 29 (20.0%) | 5 (31.2%) |
| 8 or more Rooms | 65 (44.8%) | 0 (0.0%) |
| Total | 145 (100.0%) | 16 (100.0%) |
Housing Structure by Heating Type in Northport
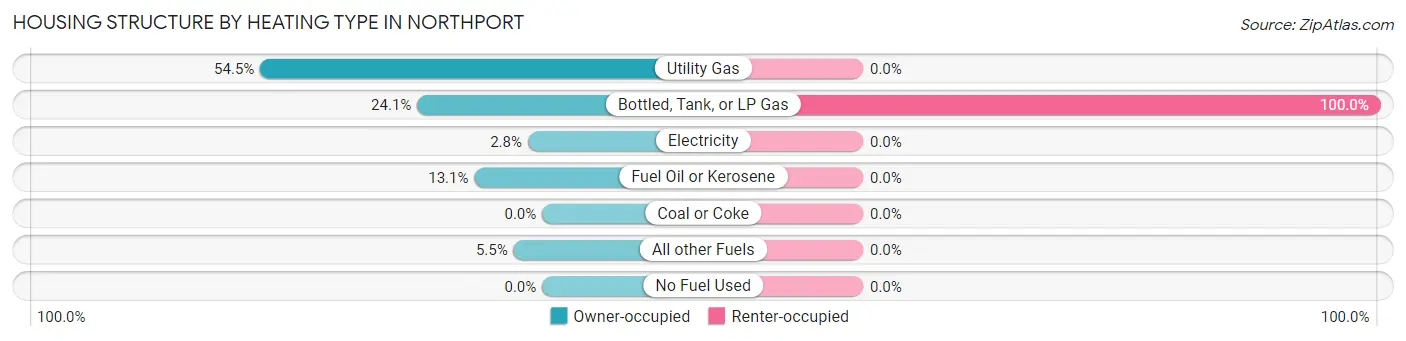
| Heating Type | Owner-occupied | Renter-occupied |
| Utility Gas | 79 (54.5%) | 0 (0.0%) |
| Bottled, Tank, or LP Gas | 35 (24.1%) | 16 (100.0%) |
| Electricity | 4 (2.8%) | 0 (0.0%) |
| Fuel Oil or Kerosene | 19 (13.1%) | 0 (0.0%) |
| Coal or Coke | 0 (0.0%) | 0 (0.0%) |
| All other Fuels | 8 (5.5%) | 0 (0.0%) |
| No Fuel Used | 0 (0.0%) | 0 (0.0%) |
| Total | 145 (100.0%) | 16 (100.0%) |
Household Vehicle Usage in Northport
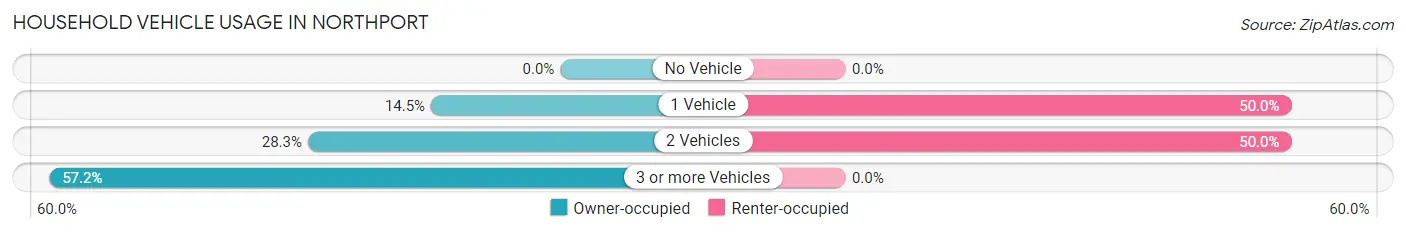
| Vehicles per Household | Owner-occupied | Renter-occupied |
| No Vehicle | 0 (0.0%) | 0 (0.0%) |
| 1 Vehicle | 21 (14.5%) | 8 (50.0%) |
| 2 Vehicles | 41 (28.3%) | 8 (50.0%) |
| 3 or more Vehicles | 83 (57.2%) | 0 (0.0%) |
| Total | 145 (100.0%) | 16 (100.0%) |
Real Estate & Mortgages in Northport
Real Estate and Mortgage Overview in Northport
| Characteristic | Without Mortgage | With Mortgage |
| Housing Units | 68 | 77 |
| Median Property Value | $166,700 | $207,000 |
| Median Household Income | $92,500 | $19 |
| Monthly Housing Costs | $456 | $0 |
| Real Estate Taxes | $1,750 | $0 |
Property Value by Mortgage Status in Northport
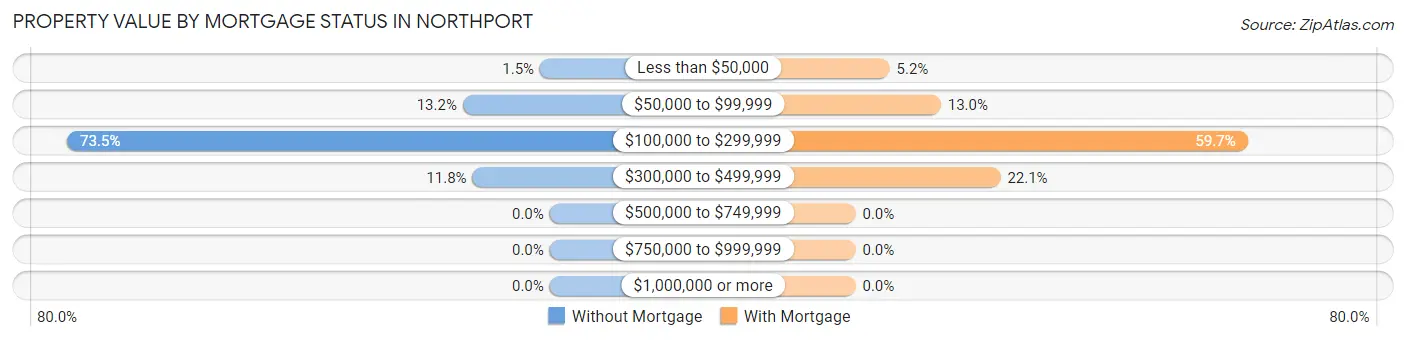
| Property Value | Without Mortgage | With Mortgage |
| Less than $50,000 | 1 (1.5%) | 4 (5.2%) |
| $50,000 to $99,999 | 9 (13.2%) | 10 (13.0%) |
| $100,000 to $299,999 | 50 (73.5%) | 46 (59.7%) |
| $300,000 to $499,999 | 8 (11.8%) | 17 (22.1%) |
| $500,000 to $749,999 | 0 (0.0%) | 0 (0.0%) |
| $750,000 to $999,999 | 0 (0.0%) | 0 (0.0%) |
| $1,000,000 or more | 0 (0.0%) | 0 (0.0%) |
| Total | 68 (100.0%) | 77 (100.0%) |
Household Income by Mortgage Status in Northport
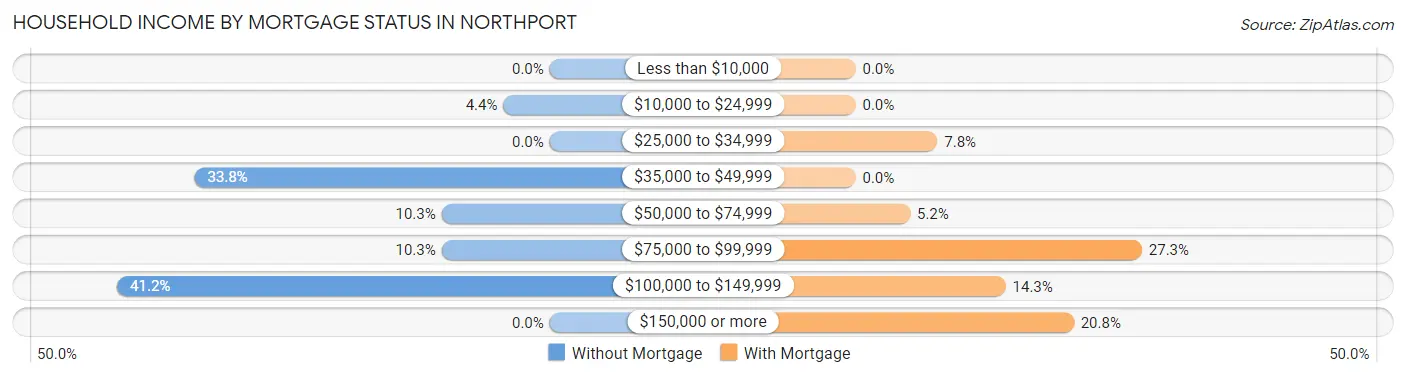
| Household Income | Without Mortgage | With Mortgage |
| Less than $10,000 | 0 (0.0%) | 0 (0.0%) |
| $10,000 to $24,999 | 3 (4.4%) | 0 (0.0%) |
| $25,000 to $34,999 | 0 (0.0%) | 6 (7.8%) |
| $35,000 to $49,999 | 23 (33.8%) | 0 (0.0%) |
| $50,000 to $74,999 | 7 (10.3%) | 4 (5.2%) |
| $75,000 to $99,999 | 7 (10.3%) | 21 (27.3%) |
| $100,000 to $149,999 | 28 (41.2%) | 11 (14.3%) |
| $150,000 or more | 0 (0.0%) | 16 (20.8%) |
| Total | 68 (100.0%) | 77 (100.0%) |
Property Value to Household Income Ratio in Northport
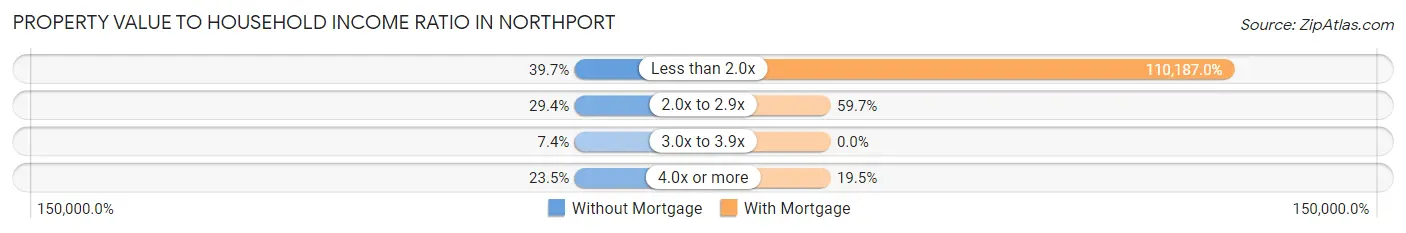
| Value-to-Income Ratio | Without Mortgage | With Mortgage |
| Less than 2.0x | 27 (39.7%) | 84,844 (110,187.0%) |
| 2.0x to 2.9x | 20 (29.4%) | 46 (59.7%) |
| 3.0x to 3.9x | 5 (7.3%) | 0 (0.0%) |
| 4.0x or more | 16 (23.5%) | 15 (19.5%) |
| Total | 68 (100.0%) | 77 (100.0%) |
Real Estate Taxes by Mortgage Status in Northport
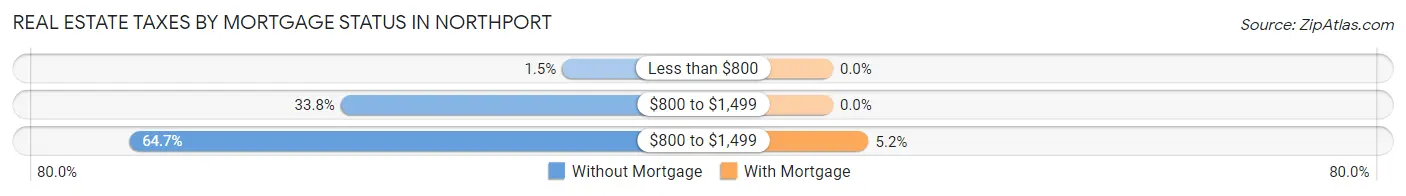
| Property Taxes | Without Mortgage | With Mortgage |
| Less than $800 | 1 (1.5%) | 0 (0.0%) |
| $800 to $1,499 | 23 (33.8%) | 0 (0.0%) |
| $800 to $1,499 | 44 (64.7%) | 4 (5.2%) |
| Total | 68 (100.0%) | 77 (100.0%) |
Health & Disability in Northport
Health Insurance Coverage by Age in Northport
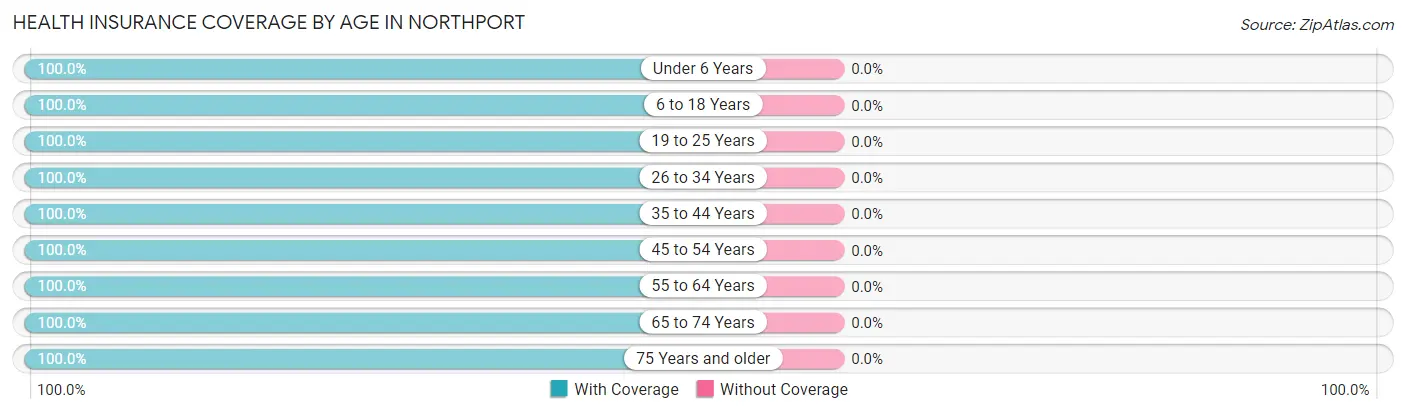
| Age Bracket | With Coverage | Without Coverage |
| Under 6 Years | 55 (100.0%) | 0 (0.0%) |
| 6 to 18 Years | 37 (100.0%) | 0 (0.0%) |
| 19 to 25 Years | 27 (100.0%) | 0 (0.0%) |
| 26 to 34 Years | 38 (100.0%) | 0 (0.0%) |
| 35 to 44 Years | 38 (100.0%) | 0 (0.0%) |
| 45 to 54 Years | 76 (100.0%) | 0 (0.0%) |
| 55 to 64 Years | 70 (100.0%) | 0 (0.0%) |
| 65 to 74 Years | 52 (100.0%) | 0 (0.0%) |
| 75 Years and older | 33 (100.0%) | 0 (0.0%) |
| Total | 426 (100.0%) | 0 (0.0%) |
Health Insurance Coverage by Citizenship Status in Northport
| Citizenship Status | With Coverage | Without Coverage |
| Native Born | 55 (100.0%) | 0 (0.0%) |
| Foreign Born, Citizen | 37 (100.0%) | 0 (0.0%) |
| Foreign Born, not a Citizen | 27 (100.0%) | 0 (0.0%) |
Health Insurance Coverage by Household Income in Northport
| Household Income | With Coverage | Without Coverage |
| Under $25,000 | 22 (100.0%) | 0 (0.0%) |
| $25,000 to $49,999 | 51 (100.0%) | 0 (0.0%) |
| $50,000 to $74,999 | 69 (100.0%) | 0 (0.0%) |
| $75,000 to $99,999 | 76 (100.0%) | 0 (0.0%) |
| $100,000 and over | 208 (100.0%) | 0 (0.0%) |
Public vs Private Health Insurance Coverage by Age in Northport
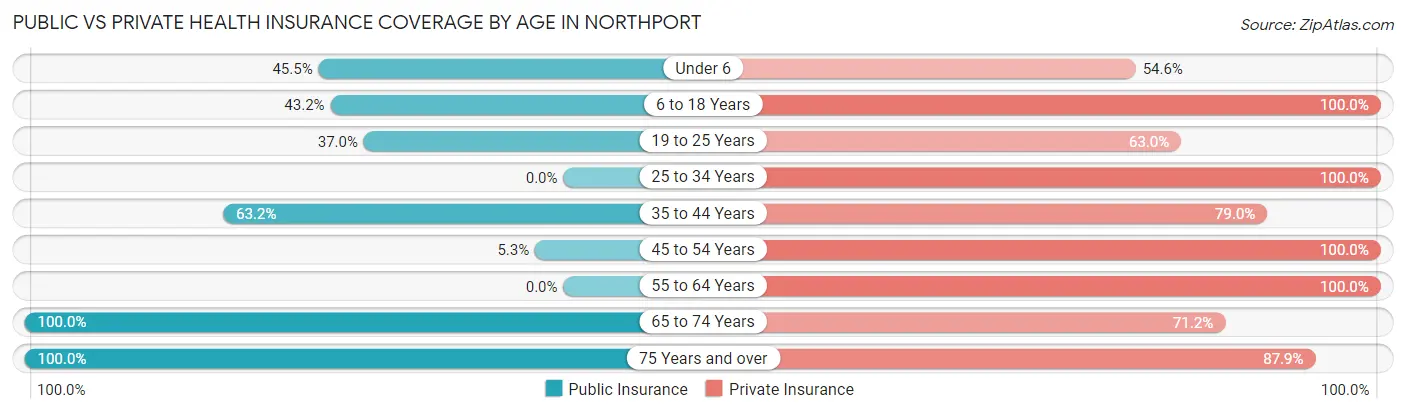
| Age Bracket | Public Insurance | Private Insurance |
| Under 6 | 25 (45.5%) | 30 (54.5%) |
| 6 to 18 Years | 16 (43.2%) | 37 (100.0%) |
| 19 to 25 Years | 10 (37.0%) | 17 (63.0%) |
| 25 to 34 Years | 0 (0.0%) | 38 (100.0%) |
| 35 to 44 Years | 24 (63.2%) | 30 (78.9%) |
| 45 to 54 Years | 4 (5.3%) | 76 (100.0%) |
| 55 to 64 Years | 0 (0.0%) | 70 (100.0%) |
| 65 to 74 Years | 52 (100.0%) | 37 (71.2%) |
| 75 Years and over | 33 (100.0%) | 29 (87.9%) |
| Total | 164 (38.5%) | 364 (85.5%) |
Disability Status by Sex by Age in Northport
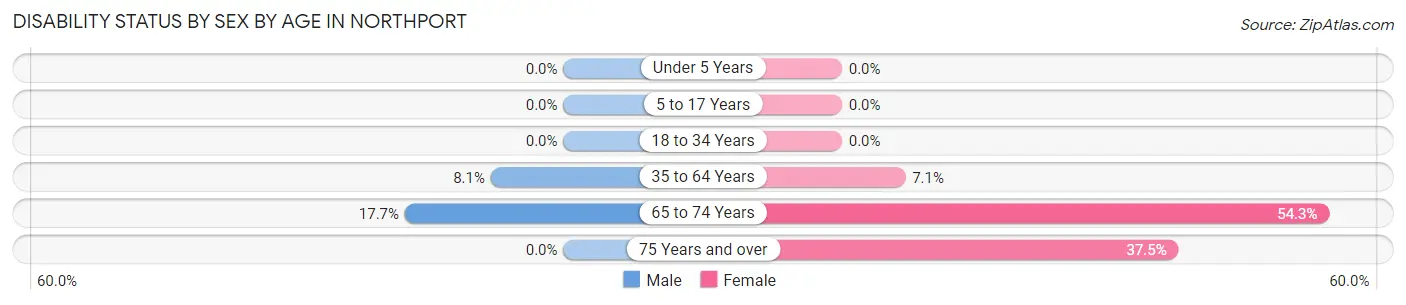
| Age Bracket | Male | Female |
| Under 5 Years | 0 (0.0%) | 0 (0.0%) |
| 5 to 17 Years | 0 (0.0%) | 0 (0.0%) |
| 18 to 34 Years | 0 (0.0%) | 0 (0.0%) |
| 35 to 64 Years | 8 (8.1%) | 6 (7.1%) |
| 65 to 74 Years | 3 (17.6%) | 19 (54.3%) |
| 75 Years and over | 0 (0.0%) | 6 (37.5%) |
Disability Class by Sex by Age in Northport
Disability Class: Hearing Difficulty
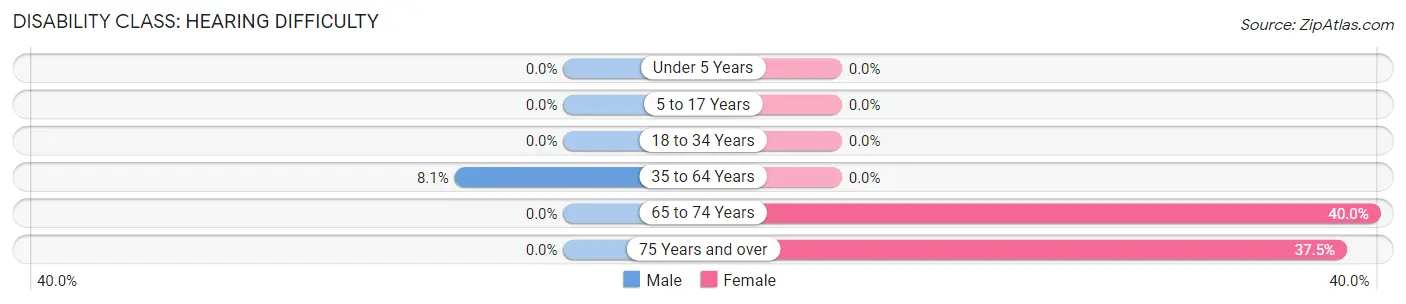
| Age Bracket | Male | Female |
| Under 5 Years | 0 (0.0%) | 0 (0.0%) |
| 5 to 17 Years | 0 (0.0%) | 0 (0.0%) |
| 18 to 34 Years | 0 (0.0%) | 0 (0.0%) |
| 35 to 64 Years | 8 (8.1%) | 0 (0.0%) |
| 65 to 74 Years | 0 (0.0%) | 14 (40.0%) |
| 75 Years and over | 0 (0.0%) | 6 (37.5%) |
Disability Class: Vision Difficulty
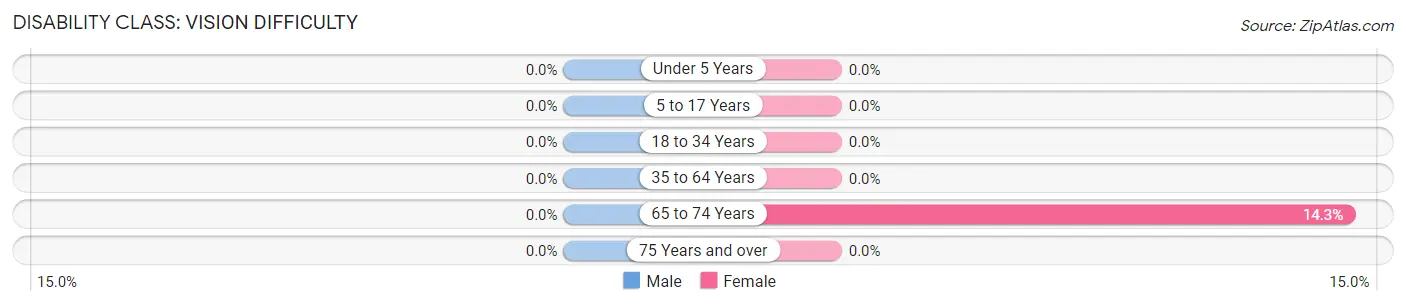
| Age Bracket | Male | Female |
| Under 5 Years | 0 (0.0%) | 0 (0.0%) |
| 5 to 17 Years | 0 (0.0%) | 0 (0.0%) |
| 18 to 34 Years | 0 (0.0%) | 0 (0.0%) |
| 35 to 64 Years | 0 (0.0%) | 0 (0.0%) |
| 65 to 74 Years | 0 (0.0%) | 5 (14.3%) |
| 75 Years and over | 0 (0.0%) | 0 (0.0%) |
Disability Class: Cognitive Difficulty
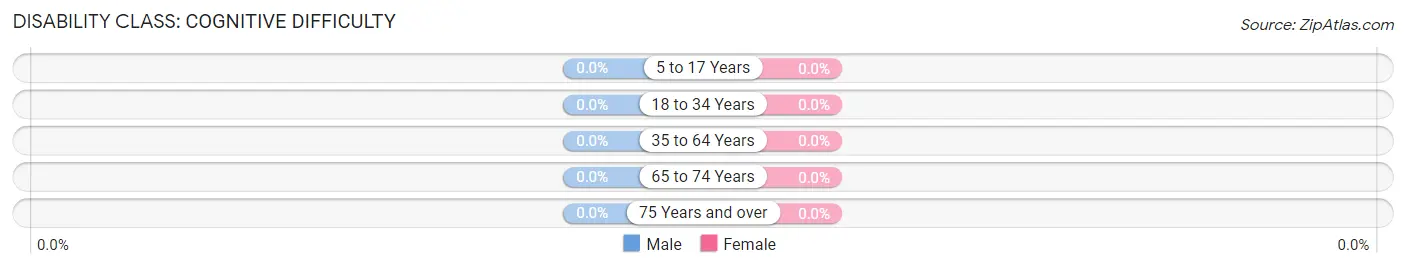
| Age Bracket | Male | Female |
| 5 to 17 Years | 0 (0.0%) | 0 (0.0%) |
| 18 to 34 Years | 0 (0.0%) | 0 (0.0%) |
| 35 to 64 Years | 0 (0.0%) | 0 (0.0%) |
| 65 to 74 Years | 0 (0.0%) | 0 (0.0%) |
| 75 Years and over | 0 (0.0%) | 0 (0.0%) |
Disability Class: Ambulatory Difficulty
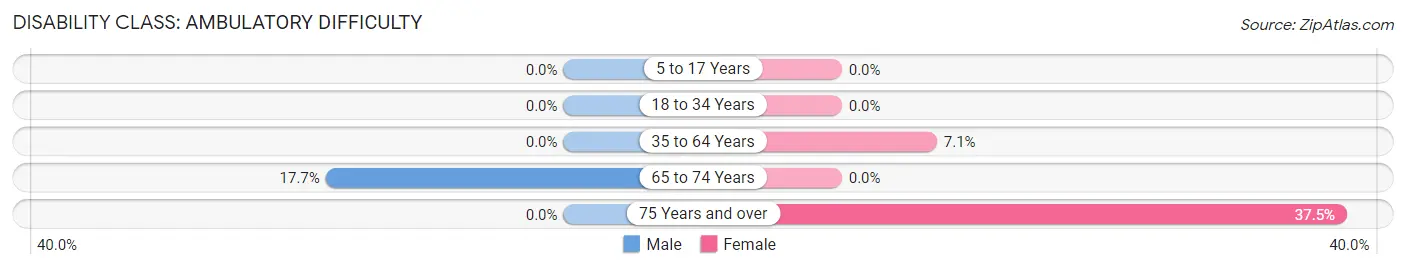
| Age Bracket | Male | Female |
| 5 to 17 Years | 0 (0.0%) | 0 (0.0%) |
| 18 to 34 Years | 0 (0.0%) | 0 (0.0%) |
| 35 to 64 Years | 0 (0.0%) | 6 (7.1%) |
| 65 to 74 Years | 3 (17.6%) | 0 (0.0%) |
| 75 Years and over | 0 (0.0%) | 6 (37.5%) |
Disability Class: Self-Care Difficulty
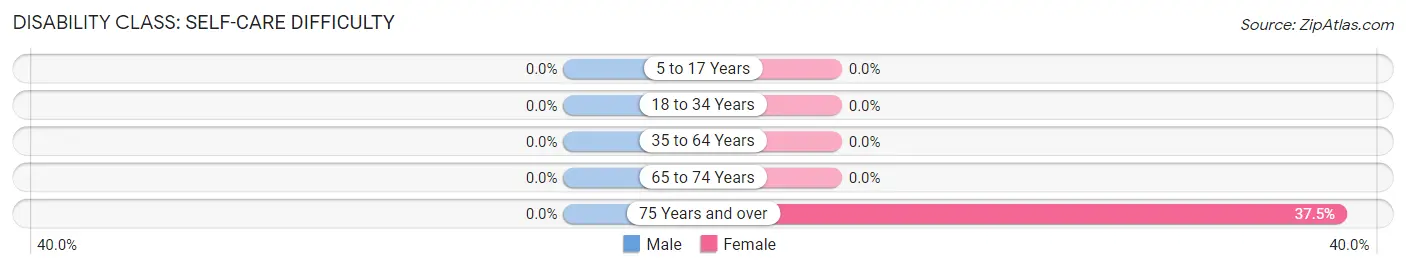
| Age Bracket | Male | Female |
| 5 to 17 Years | 0 (0.0%) | 0 (0.0%) |
| 18 to 34 Years | 0 (0.0%) | 0 (0.0%) |
| 35 to 64 Years | 0 (0.0%) | 0 (0.0%) |
| 65 to 74 Years | 0 (0.0%) | 0 (0.0%) |
| 75 Years and over | 0 (0.0%) | 6 (37.5%) |
Technology Access in Northport
Computing Device Access in Northport
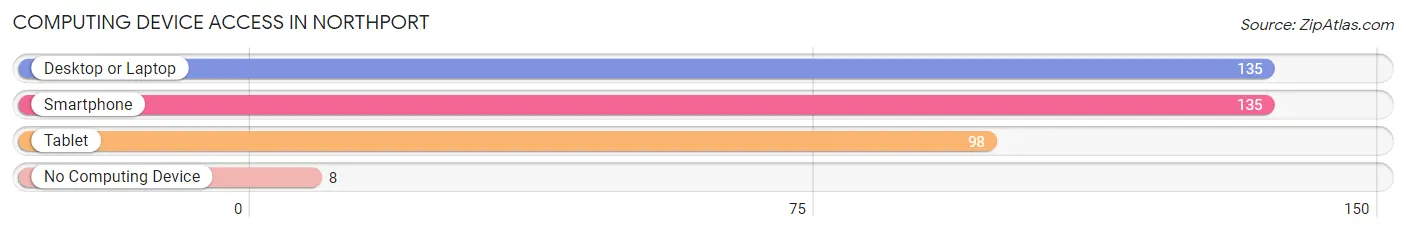
| Device Type | # Households | % Households |
| Desktop or Laptop | 135 | 83.9% |
| Smartphone | 135 | 83.9% |
| Tablet | 98 | 60.9% |
| No Computing Device | 8 | 5.0% |
| Total | 161 | 100.0% |
Internet Access in Northport
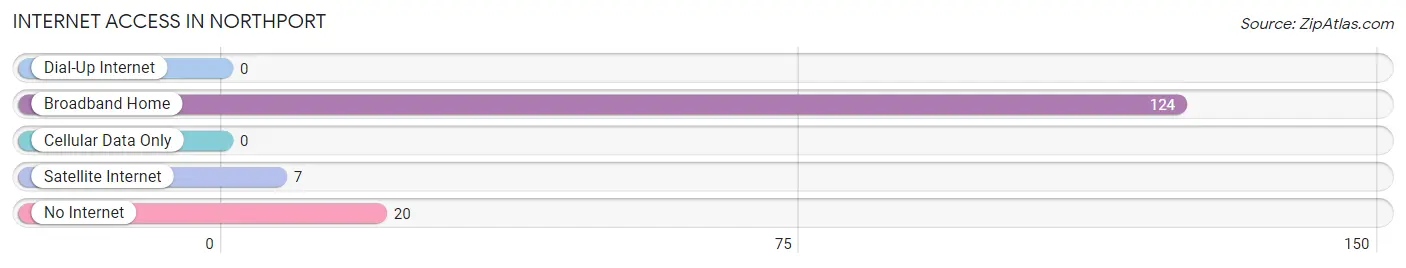
| Internet Type | # Households | % Households |
| Dial-Up Internet | 0 | 0.0% |
| Broadband Home | 124 | 77.0% |
| Cellular Data Only | 0 | 0.0% |
| Satellite Internet | 7 | 4.3% |
| No Internet | 20 | 12.4% |
| Total | 161 | 100.0% |
Northport Summary
Northport is a small unincorporated community located in Door County, Wisconsin. It is situated on the western shore of Lake Michigan, approximately 20 miles north of Sturgeon Bay. The community is home to a population of approximately 200 people, and is known for its picturesque views of the lake and its surrounding countryside.
History
Northport was first settled in the late 1800s by a group of Norwegian immigrants. The settlers were attracted to the area by its abundance of natural resources, including timber, fish, and wild game. The community was originally known as “Nordport”, which translates to “north port” in Norwegian. The name was later changed to Northport to better reflect the community’s location.
In the early 1900s, Northport became a popular destination for vacationers from Milwaukee and Chicago. The community was home to several resorts, including the Northport Hotel, which was built in 1906. The hotel was a popular destination for wealthy vacationers, and was known for its luxurious accommodations and amenities.
In the 1950s, Northport began to experience a decline in tourism. This was due in part to the increasing popularity of other vacation destinations, such as the Wisconsin Dells. The decline in tourism led to a decrease in the community’s population, and by the 1970s, Northport had become a virtual ghost town.
In the 1980s, Northport began to experience a resurgence in popularity. This was due in part to the increasing popularity of Door County as a tourist destination. The community has since become a popular destination for vacationers, and is home to several resorts, restaurants, and other attractions.
Geography
Northport is located on the western shore of Lake Michigan, approximately 20 miles north of Sturgeon Bay. The community is situated on a peninsula, which is surrounded by the waters of the lake on three sides. The area is characterized by rolling hills, forests, and wetlands.
The climate in Northport is typical of the Upper Midwest, with cold winters and warm summers. The average temperature in the winter is around 20 degrees Fahrenheit, while the average temperature in the summer is around 70 degrees Fahrenheit.
Economy
The economy of Northport is largely based on tourism. The community is home to several resorts, restaurants, and other attractions, which attract visitors from all over the country. The community is also home to several marinas, which provide services to boaters and fishermen.
In addition to tourism, Northport is home to several small businesses, including a grocery store, a hardware store, and a gas station. The community is also home to a number of art galleries, which feature the work of local artists.
Demographics
As of the 2010 census, the population of Northport was approximately 200 people. The racial makeup of the community was 97.5% White, 0.5% African American, 0.5% Native American, and 1.5% from other races. The median household income in Northport was $41,250, and the median home value was $179,000.
Northport is a small, close-knit community. The majority of the population is of Norwegian descent, and the community is known for its strong sense of community and tradition. The community is home to several churches, and is known for its annual festivals and events.
Common Questions
What is Per Capita Income in Northport?
Per Capita income in Northport is $35,361.
What is the Median Family Income in Northport?
Median Family Income in Northport is $99,583.
What is the Median Household income in Northport?
Median Household Income in Northport is $84,219.
What is Income or Wage Gap in Northport?
Income or Wage Gap in Northport is 54.9%.
Women in Northport earn 45.1 cents for every dollar earned by a man.
What is Inequality or Gini Index in Northport?
Inequality or Gini Index in Northport is 0.31.
What is the Total Population of Northport?
Total Population of Northport is 426.
What is the Total Male Population of Northport?
Total Male Population of Northport is 198.
What is the Total Female Population of Northport?
Total Female Population of Northport is 228.
What is the Ratio of Males per 100 Females in Northport?
There are 86.84 Males per 100 Females in Northport.
What is the Ratio of Females per 100 Males in Northport?
There are 115.15 Females per 100 Males in Northport.
What is the Median Population Age in Northport?
Median Population Age in Northport is 48.4 Years.
What is the Average Family Size in Northport
Average Family Size in Northport is 3.0 People.
What is the Average Household Size in Northport
Average Household Size in Northport is 2.6 People.
How Large is the Labor Force in Northport?
There are 241 People in the Labor Forcein in Northport.
What is the Percentage of People in the Labor Force in Northport?
69.7% of People are in the Labor Force in Northport.
What is the Unemployment Rate in Northport?
Unemployment Rate in Northport is 5.0%.