Bohners Lake, WI Map & Demographics
Bohners Lake Map
Bohners Lake Overview
$33,925
PER CAPITA INCOME
$83,986
AVG FAMILY INCOME
$74,041
AVG HOUSEHOLD INCOME
52.8%
WAGE / INCOME GAP [ % ]
47.2¢/ $1
WAGE / INCOME GAP [ $ ]
0.29
INEQUALITY / GINI INDEX
2,415
TOTAL POPULATION
1,360
MALE POPULATION
1,055
FEMALE POPULATION
128.91
MALES / 100 FEMALES
77.57
FEMALES / 100 MALES
39.6
MEDIAN AGE
3.0
AVG FAMILY SIZE
2.4
AVG HOUSEHOLD SIZE
1,242
LABOR FORCE [ PEOPLE ]
64.1%
PERCENT IN LABOR FORCE
7.7%
UNEMPLOYMENT RATE
Income in Bohners Lake
Income Overview in Bohners Lake
Per Capita Income in Bohners Lake is $33,925, while median incomes of families and households are $83,986 and $74,041 respectively.
| Characteristic | Number | Measure |
| Per Capita Income | 2,415 | $33,925 |
| Median Family Income | 600 | $83,986 |
| Mean Family Income | 600 | $89,338 |
| Median Household Income | 1,000 | $74,041 |
| Mean Household Income | 1,000 | $81,194 |
| Income Deficit | 600 | $0 |
| Wage / Income Gap (%) | 2,415 | 52.78% |
| Wage / Income Gap ($) | 2,415 | 47.22¢ per $1 |
| Gini / Inequality Index | 2,415 | 0.29 |
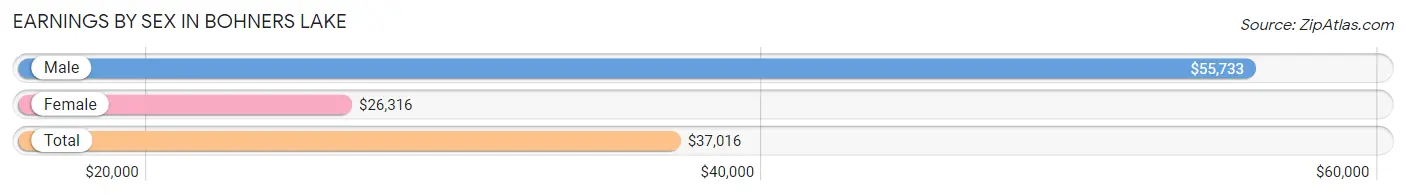
Earnings by Sex in Bohners Lake
Average Earnings in Bohners Lake are $37,016, $55,733 for men and $26,316 for women, a difference of 52.8%.
| Sex | Number | Average Earnings |
| Male | 872 (65.0%) | $55,733 |
| Female | 470 (35.0%) | $26,316 |
| Total | 1,342 (100.0%) | $37,016 |
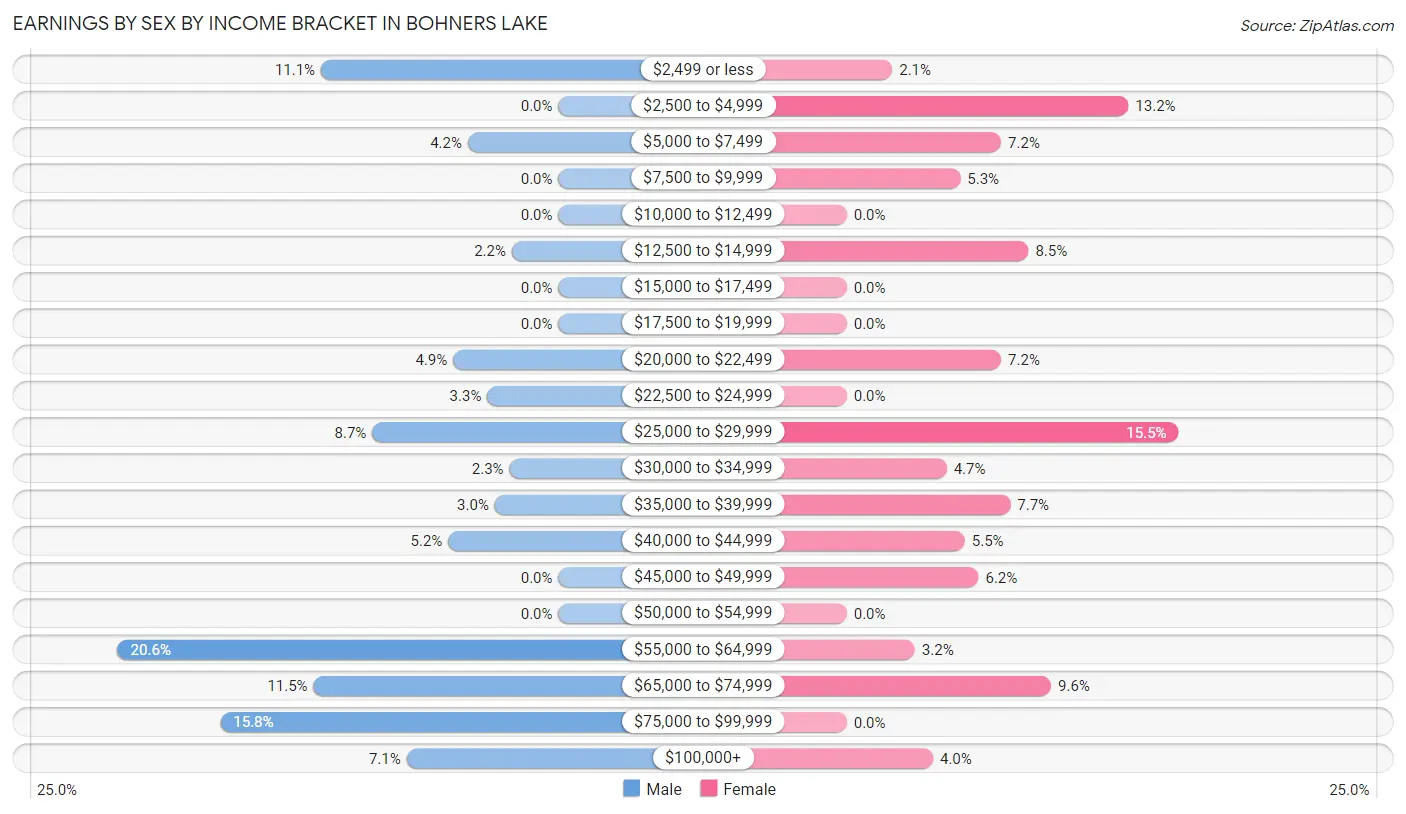
Earnings by Sex by Income Bracket in Bohners Lake
The most common earnings brackets in Bohners Lake are $55,000 to $64,999 for men (180 | 20.6%) and $25,000 to $29,999 for women (73 | 15.5%).
| Income | Male | Female |
| $2,499 or less | 97 (11.1%) | 10 (2.1%) |
| $2,500 to $4,999 | 0 (0.0%) | 62 (13.2%) |
| $5,000 to $7,499 | 37 (4.2%) | 34 (7.2%) |
| $7,500 to $9,999 | 0 (0.0%) | 25 (5.3%) |
| $10,000 to $12,499 | 0 (0.0%) | 0 (0.0%) |
| $12,500 to $14,999 | 19 (2.2%) | 40 (8.5%) |
| $15,000 to $17,499 | 0 (0.0%) | 0 (0.0%) |
| $17,500 to $19,999 | 0 (0.0%) | 0 (0.0%) |
| $20,000 to $22,499 | 43 (4.9%) | 34 (7.2%) |
| $22,500 to $24,999 | 29 (3.3%) | 0 (0.0%) |
| $25,000 to $29,999 | 76 (8.7%) | 73 (15.5%) |
| $30,000 to $34,999 | 20 (2.3%) | 22 (4.7%) |
| $35,000 to $39,999 | 26 (3.0%) | 36 (7.7%) |
| $40,000 to $44,999 | 45 (5.2%) | 26 (5.5%) |
| $45,000 to $49,999 | 0 (0.0%) | 29 (6.2%) |
| $50,000 to $54,999 | 0 (0.0%) | 0 (0.0%) |
| $55,000 to $64,999 | 180 (20.6%) | 15 (3.2%) |
| $65,000 to $74,999 | 100 (11.5%) | 45 (9.6%) |
| $75,000 to $99,999 | 138 (15.8%) | 0 (0.0%) |
| $100,000+ | 62 (7.1%) | 19 (4.0%) |
| Total | 872 (100.0%) | 470 (100.0%) |
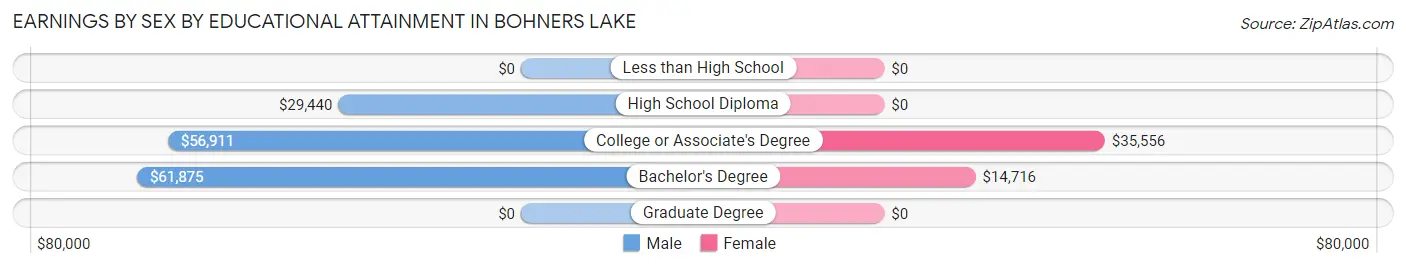
Earnings by Sex by Educational Attainment in Bohners Lake
Average earnings in Bohners Lake are $56,450 for men and $27,127 for women, a difference of 51.9%. Men with an educational attainment of bachelor's degree enjoy the highest average annual earnings of $61,875, while those with high school diploma education earn the least with $29,440. Women with an educational attainment of college or associate's degree earn the most with the average annual earnings of $35,556, while those with bachelor's degree education have the smallest earnings of $14,716.
| Educational Attainment | Male Income | Female Income |
| Less than High School | - | - |
| High School Diploma | $29,440 | $0 |
| College or Associate's Degree | $56,911 | $35,556 |
| Bachelor's Degree | $61,875 | $14,716 |
| Graduate Degree | - | - |
| Total | $56,450 | $27,127 |
Family Income in Bohners Lake
Family Income Brackets in Bohners Lake
According to the Bohners Lake family income data, there are 184 families falling into the $100,000 to $149,999 income range, which is the most common income bracket and makes up 30.7% of all families.
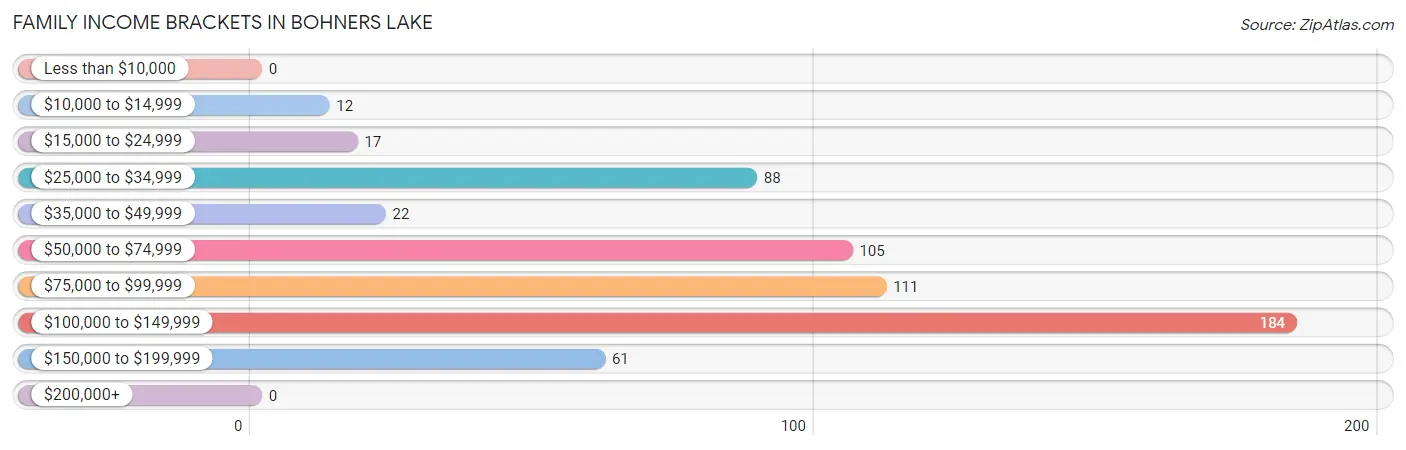
| Income Bracket | # Families | % Families |
| Less than $10,000 | 0 | 0.0% |
| $10,000 to $14,999 | 12 | 2.0% |
| $15,000 to $24,999 | 17 | 2.8% |
| $25,000 to $34,999 | 88 | 14.7% |
| $35,000 to $49,999 | 22 | 3.7% |
| $50,000 to $74,999 | 105 | 17.5% |
| $75,000 to $99,999 | 111 | 18.5% |
| $100,000 to $149,999 | 184 | 30.7% |
| $150,000 to $199,999 | 61 | 10.2% |
| $200,000+ | 0 | 0.0% |
Family Income by Famaliy Size in Bohners Lake
3-person families (78 | 13.0%) account for the highest median family income in Bohners Lake with $124,667 per family, while 3-person families (78 | 13.0%) have the highest median income of $41,556 per family member.
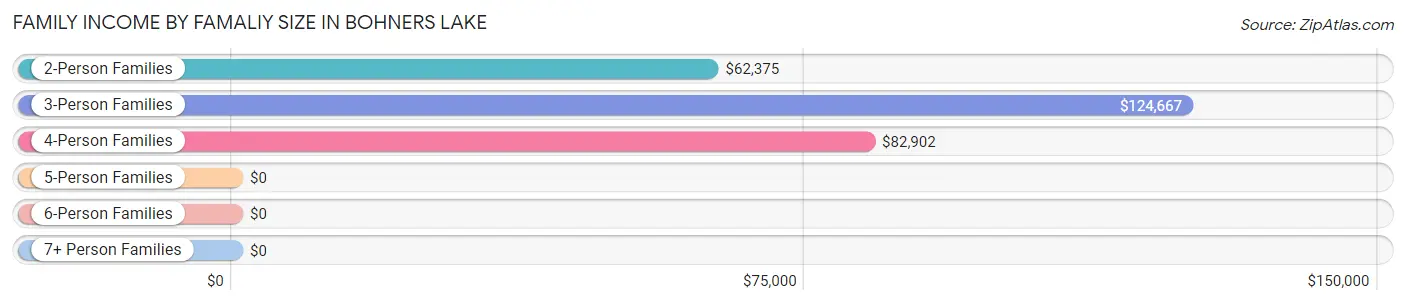
| Income Bracket | # Families | Median Income |
| 2-Person Families | 278 (46.3%) | $62,375 |
| 3-Person Families | 78 (13.0%) | $124,667 |
| 4-Person Families | 158 (26.3%) | $82,902 |
| 5-Person Families | 68 (11.3%) | $0 |
| 6-Person Families | 8 (1.3%) | $0 |
| 7+ Person Families | 10 (1.7%) | $0 |
| Total | 600 (100.0%) | $83,986 |
Family Income by Number of Earners in Bohners Lake
The median family income in Bohners Lake is $83,986, with families comprising 3+ earners (110) having the highest median family income of $124,667, while families with no earners (59) have the lowest median family income of $49,911, accounting for 18.3% and 9.8% of families, respectively.
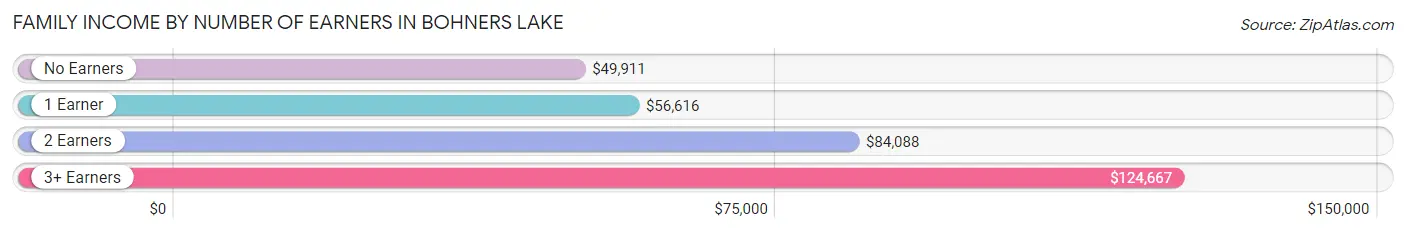
| Number of Earners | # Families | Median Income |
| No Earners | 59 (9.8%) | $49,911 |
| 1 Earner | 253 (42.2%) | $56,616 |
| 2 Earners | 178 (29.7%) | $84,088 |
| 3+ Earners | 110 (18.3%) | $124,667 |
| Total | 600 (100.0%) | $83,986 |
Household Income in Bohners Lake
Household Income Brackets in Bohners Lake
With 264 households falling in the category, the $50,000 to $74,999 income range is the most frequent in Bohners Lake, accounting for 26.4% of all households.
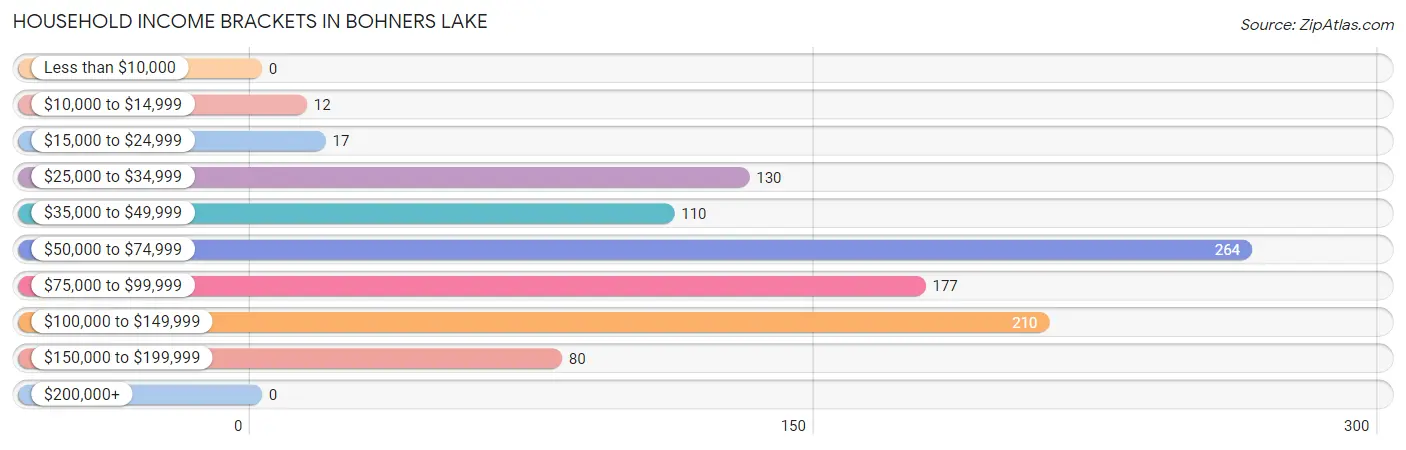
| Income Bracket | # Households | % Households |
| Less than $10,000 | 0 | 0.0% |
| $10,000 to $14,999 | 12 | 1.2% |
| $15,000 to $24,999 | 17 | 1.7% |
| $25,000 to $34,999 | 130 | 13.0% |
| $35,000 to $49,999 | 110 | 11.0% |
| $50,000 to $74,999 | 264 | 26.4% |
| $75,000 to $99,999 | 177 | 17.7% |
| $100,000 to $149,999 | 210 | 21.0% |
| $150,000 to $199,999 | 80 | 8.0% |
| $200,000+ | 0 | 0.0% |
Household Income by Householder Age in Bohners Lake
The median household income in Bohners Lake is $74,041, with the highest median household income of $83,683 found in the 25 to 44 years age bracket for the primary householder. A total of 249 households (24.9%) fall into this category. Meanwhile, the 15 to 24 years age bracket for the primary householder has the lowest median household income of $0, with 66 households (6.6%) in this group.
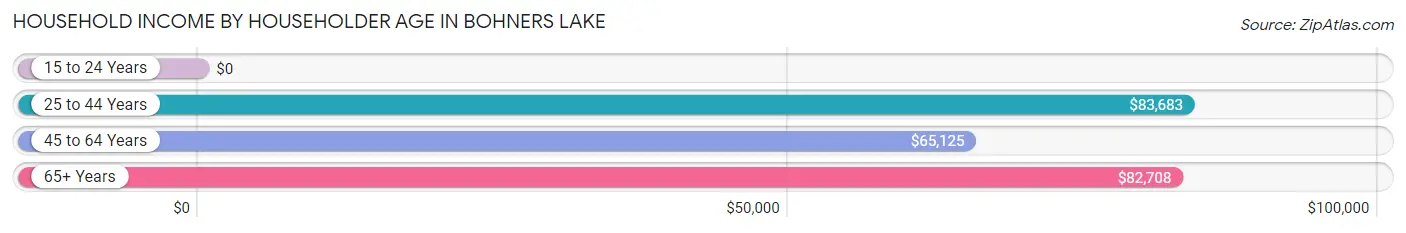
| Income Bracket | # Households | Median Income |
| 15 to 24 Years | 66 (6.6%) | $0 |
| 25 to 44 Years | 249 (24.9%) | $83,683 |
| 45 to 64 Years | 491 (49.1%) | $65,125 |
| 65+ Years | 194 (19.4%) | $82,708 |
| Total | 1,000 (100.0%) | $74,041 |
Poverty in Bohners Lake
Income Below Poverty by Sex and Age in Bohners Lake
With 3.3% poverty level for males and 4.0% for females among the residents of Bohners Lake, 6 to 11 year old males and 5 year old females are the most vulnerable to poverty, with 26 males (36.6%) and 11 females (100.0%) in their respective age groups living below the poverty level.
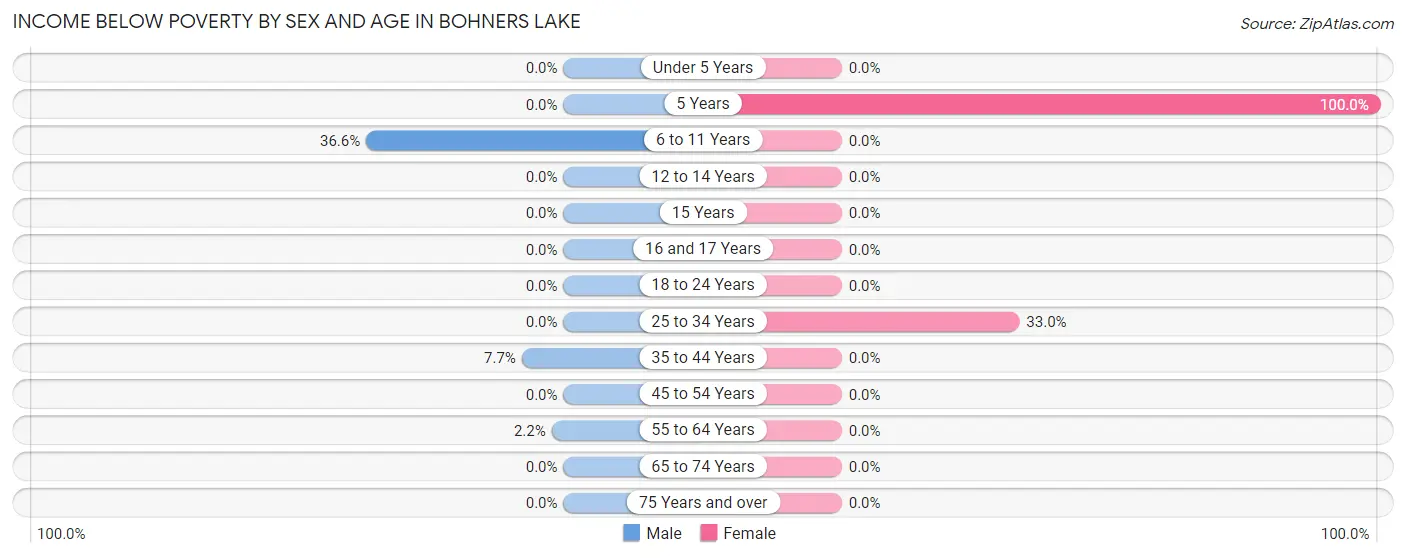
| Age Bracket | Male | Female |
| Under 5 Years | 0 (0.0%) | 0 (0.0%) |
| 5 Years | 0 (0.0%) | 11 (100.0%) |
| 6 to 11 Years | 26 (36.6%) | 0 (0.0%) |
| 12 to 14 Years | 0 (0.0%) | 0 (0.0%) |
| 15 Years | 0 (0.0%) | 0 (0.0%) |
| 16 and 17 Years | 0 (0.0%) | 0 (0.0%) |
| 18 to 24 Years | 0 (0.0%) | 0 (0.0%) |
| 25 to 34 Years | 0 (0.0%) | 30 (33.0%) |
| 35 to 44 Years | 14 (7.7%) | 0 (0.0%) |
| 45 to 54 Years | 0 (0.0%) | 0 (0.0%) |
| 55 to 64 Years | 3 (2.2%) | 0 (0.0%) |
| 65 to 74 Years | 0 (0.0%) | 0 (0.0%) |
| 75 Years and over | 0 (0.0%) | 0 (0.0%) |
| Total | 43 (3.3%) | 41 (4.0%) |
Income Above Poverty by Sex and Age in Bohners Lake
According to the poverty statistics in Bohners Lake, males aged under 5 years and females aged 6 to 11 years are the age groups that are most secure financially, with 100.0% of males and 100.0% of females in these age groups living above the poverty line.
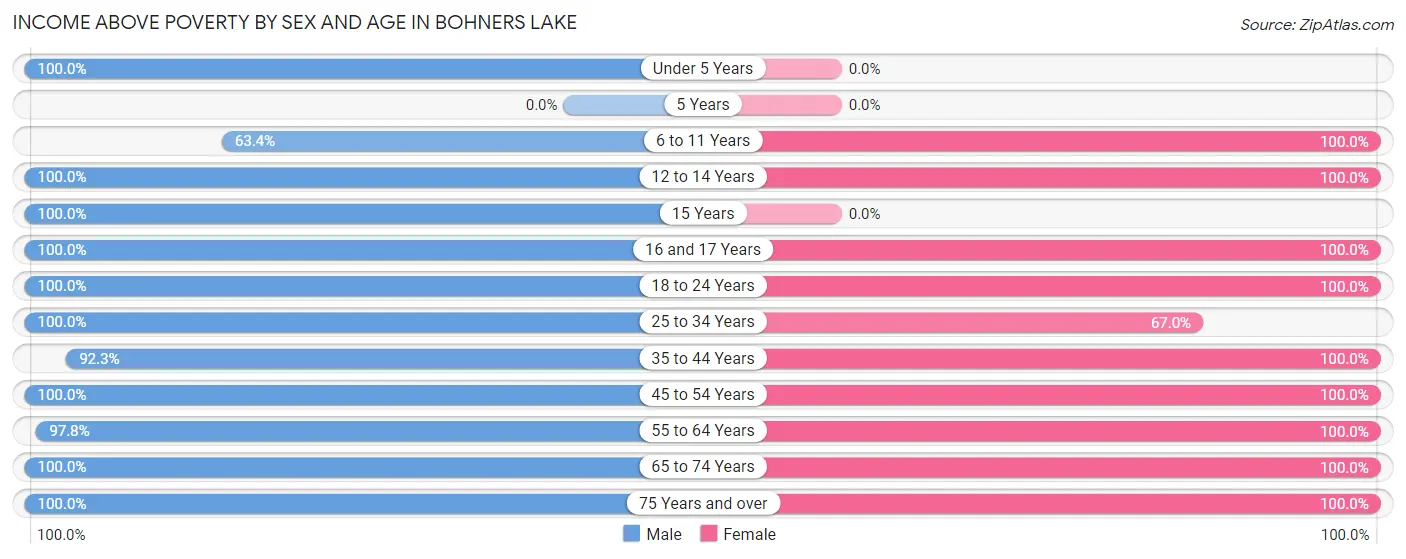
| Age Bracket | Male | Female |
| Under 5 Years | 112 (100.0%) | 0 (0.0%) |
| 5 Years | 0 (0.0%) | 0 (0.0%) |
| 6 to 11 Years | 45 (63.4%) | 120 (100.0%) |
| 12 to 14 Years | 45 (100.0%) | 9 (100.0%) |
| 15 Years | 49 (100.0%) | 0 (0.0%) |
| 16 and 17 Years | 24 (100.0%) | 83 (100.0%) |
| 18 to 24 Years | 218 (100.0%) | 29 (100.0%) |
| 25 to 34 Years | 89 (100.0%) | 61 (67.0%) |
| 35 to 44 Years | 167 (92.3%) | 128 (100.0%) |
| 45 to 54 Years | 241 (100.0%) | 132 (100.0%) |
| 55 to 64 Years | 134 (97.8%) | 239 (100.0%) |
| 65 to 74 Years | 42 (100.0%) | 130 (100.0%) |
| 75 Years and over | 77 (100.0%) | 47 (100.0%) |
| Total | 1,243 (96.7%) | 978 (96.0%) |
Income Below Poverty Among Married-Couple Families in Bohners Lake
The poverty statistics for married-couple families in Bohners Lake show that 3.0% or 12 of the total 405 families live below the poverty line. Families with 3 or 4 children have the highest poverty rate of 21.8%, comprising of 12 families. On the other hand, families with no children have the lowest poverty rate of 0.0%, which includes 0 families.
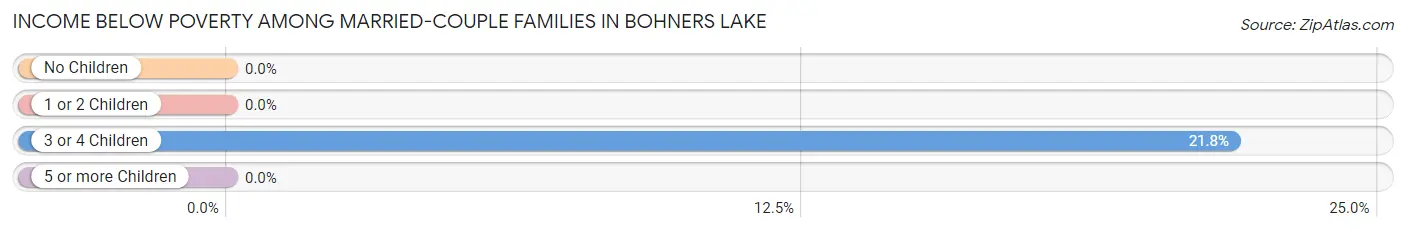
| Children | Above Poverty | Below Poverty |
| No Children | 233 (100.0%) | 0 (0.0%) |
| 1 or 2 Children | 117 (100.0%) | 0 (0.0%) |
| 3 or 4 Children | 43 (78.2%) | 12 (21.8%) |
| 5 or more Children | 0 (0.0%) | 0 (0.0%) |
| Total | 393 (97.0%) | 12 (3.0%) |
Income Below Poverty Among Single-Parent Households in Bohners Lake
| Children | Single Father | Single Mother |
| No Children | 0 (0.0%) | 0 (0.0%) |
| 1 or 2 Children | 0 (0.0%) | 0 (0.0%) |
| 3 or 4 Children | 0 (0.0%) | 0 (0.0%) |
| 5 or more Children | 0 (0.0%) | 0 (0.0%) |
| Total | 0 (0.0%) | 0 (0.0%) |
Income Below Poverty Among Married-Couple vs Single-Parent Households in Bohners Lake
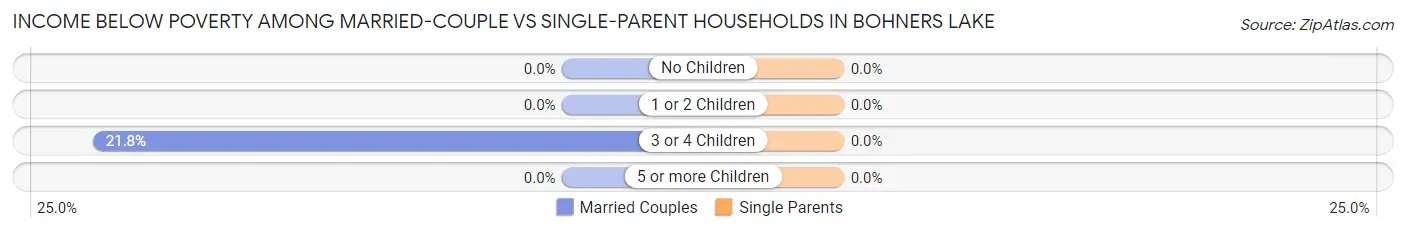
| Children | Married-Couple Families | Single-Parent Households |
| No Children | 0 (0.0%) | 0 (0.0%) |
| 1 or 2 Children | 0 (0.0%) | 0 (0.0%) |
| 3 or 4 Children | 12 (21.8%) | 0 (0.0%) |
| 5 or more Children | 0 (0.0%) | 0 (0.0%) |
| Total | 12 (3.0%) | 0 (0.0%) |
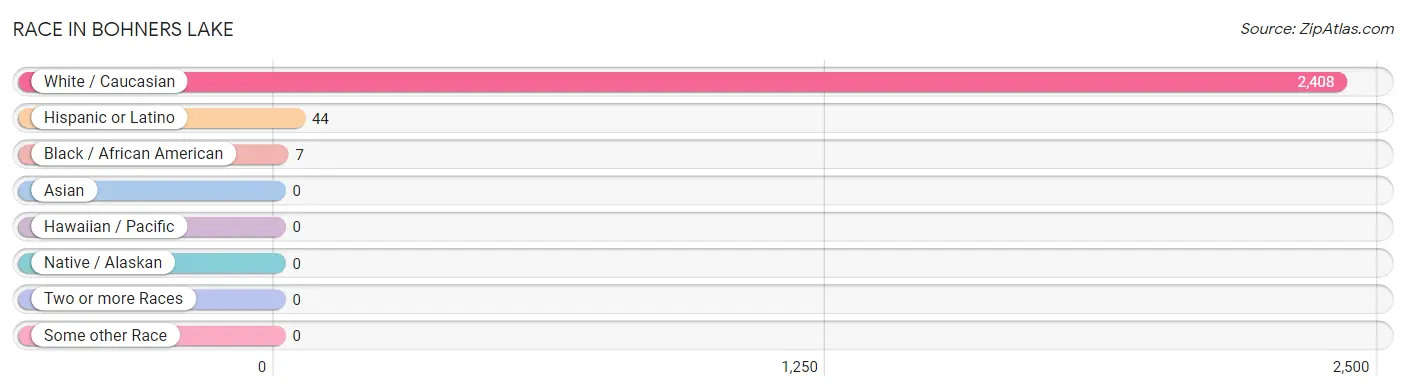
Race in Bohners Lake
The most populous races in Bohners Lake are White / Caucasian (2,408 | 99.7%), Hispanic or Latino (44 | 1.8%), and Black / African American (7 | 0.3%).
| Race | # Population | % Population |
| Asian | 0 | 0.0% |
| Black / African American | 7 | 0.3% |
| Hawaiian / Pacific | 0 | 0.0% |
| Hispanic or Latino | 44 | 1.8% |
| Native / Alaskan | 0 | 0.0% |
| White / Caucasian | 2,408 | 99.7% |
| Two or more Races | 0 | 0.0% |
| Some other Race | 0 | 0.0% |
| Total | 2,415 | 100.0% |
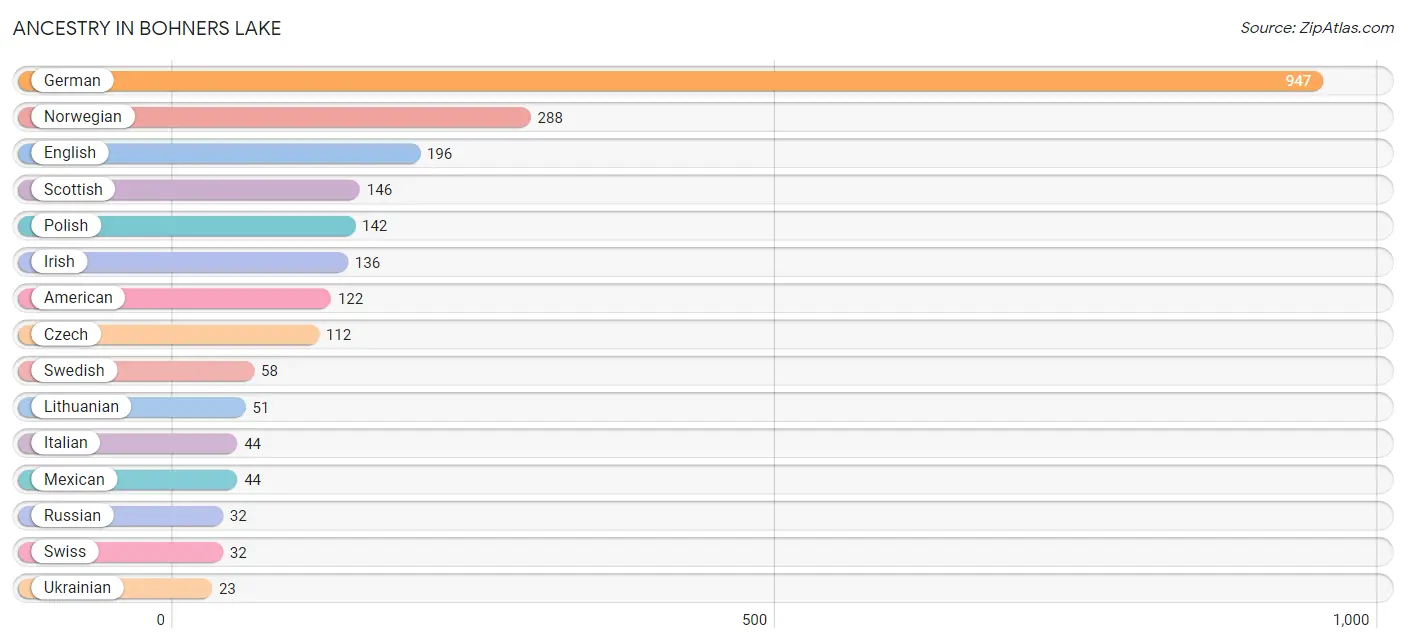
Ancestry in Bohners Lake
The most populous ancestries reported in Bohners Lake are German (947 | 39.2%), Norwegian (288 | 11.9%), English (196 | 8.1%), Scottish (146 | 6.0%), and Polish (142 | 5.9%), together accounting for 71.2% of all Bohners Lake residents.
| Ancestry | # Population | % Population |
| American | 122 | 5.1% |
| British | 16 | 0.7% |
| Croatian | 14 | 0.6% |
| Czech | 112 | 4.6% |
| Danish | 12 | 0.5% |
| English | 196 | 8.1% |
| French | 20 | 0.8% |
| French Canadian | 12 | 0.5% |
| German | 947 | 39.2% |
| Hungarian | 17 | 0.7% |
| Irish | 136 | 5.6% |
| Italian | 44 | 1.8% |
| Lithuanian | 51 | 2.1% |
| Mexican | 44 | 1.8% |
| Northern European | 15 | 0.6% |
| Norwegian | 288 | 11.9% |
| Polish | 142 | 5.9% |
| Russian | 32 | 1.3% |
| Scottish | 146 | 6.0% |
| Slovak | 16 | 0.7% |
| Swedish | 58 | 2.4% |
| Swiss | 32 | 1.3% |
| Ukrainian | 23 | 0.9% | View All 23 Rows |
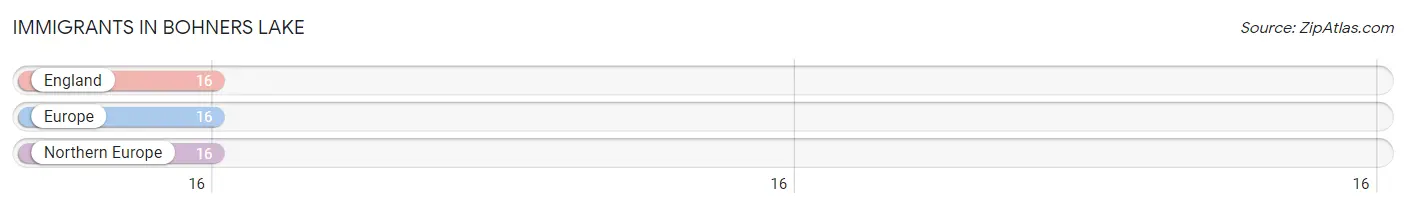
Immigrants in Bohners Lake
The most numerous immigrant groups reported in Bohners Lake came from England (16 | 0.7%), Europe (16 | 0.7%), and Northern Europe (16 | 0.7%), together accounting for 2.0% of all Bohners Lake residents.
| Immigration Origin | # Population | % Population |
| England | 16 | 0.7% |
| Europe | 16 | 0.7% |
| Northern Europe | 16 | 0.7% | View All 3 Rows |
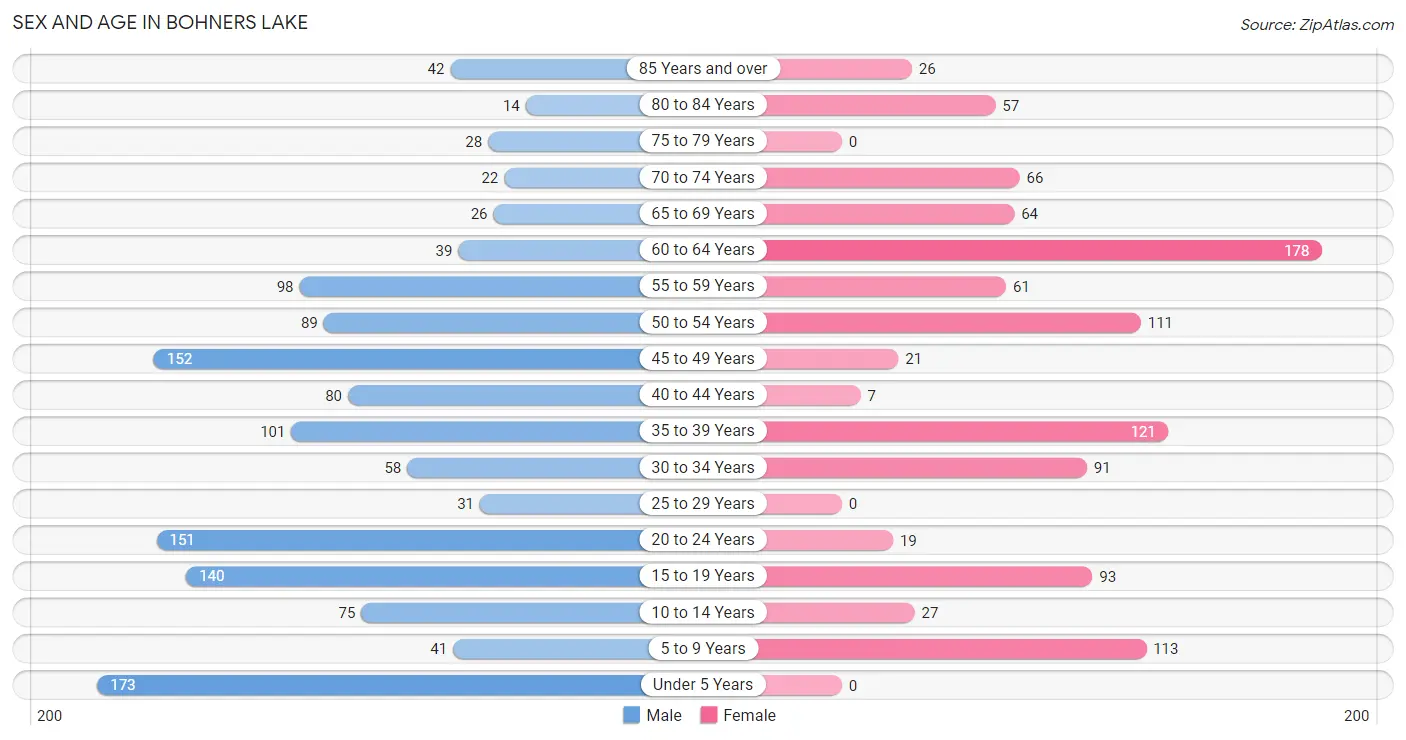
Sex and Age in Bohners Lake
Sex and Age in Bohners Lake
The most populous age groups in Bohners Lake are Under 5 Years (173 | 12.7%) for men and 60 to 64 Years (178 | 16.9%) for women.
| Age Bracket | Male | Female |
| Under 5 Years | 173 (12.7%) | 0 (0.0%) |
| 5 to 9 Years | 41 (3.0%) | 113 (10.7%) |
| 10 to 14 Years | 75 (5.5%) | 27 (2.6%) |
| 15 to 19 Years | 140 (10.3%) | 93 (8.8%) |
| 20 to 24 Years | 151 (11.1%) | 19 (1.8%) |
| 25 to 29 Years | 31 (2.3%) | 0 (0.0%) |
| 30 to 34 Years | 58 (4.3%) | 91 (8.6%) |
| 35 to 39 Years | 101 (7.4%) | 121 (11.5%) |
| 40 to 44 Years | 80 (5.9%) | 7 (0.7%) |
| 45 to 49 Years | 152 (11.2%) | 21 (2.0%) |
| 50 to 54 Years | 89 (6.5%) | 111 (10.5%) |
| 55 to 59 Years | 98 (7.2%) | 61 (5.8%) |
| 60 to 64 Years | 39 (2.9%) | 178 (16.9%) |
| 65 to 69 Years | 26 (1.9%) | 64 (6.1%) |
| 70 to 74 Years | 22 (1.6%) | 66 (6.3%) |
| 75 to 79 Years | 28 (2.1%) | 0 (0.0%) |
| 80 to 84 Years | 14 (1.0%) | 57 (5.4%) |
| 85 Years and over | 42 (3.1%) | 26 (2.5%) |
| Total | 1,360 (100.0%) | 1,055 (100.0%) |
Families and Households in Bohners Lake
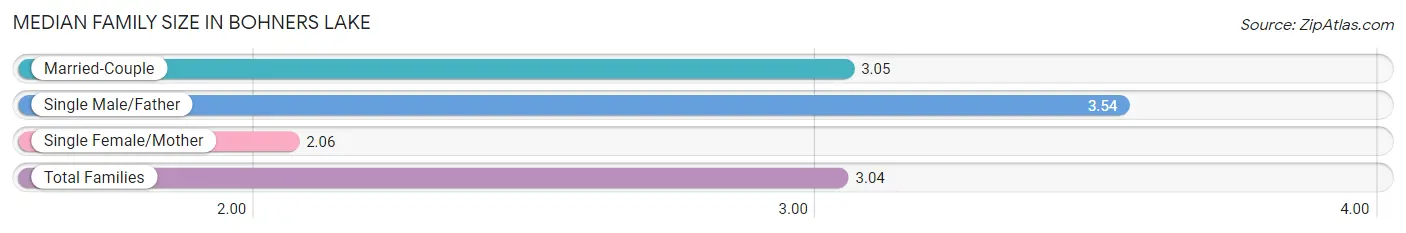
Median Family Size in Bohners Lake
The median family size in Bohners Lake is 3.04 persons per family, with single male/father families (125 | 20.8%) accounting for the largest median family size of 3.54 persons per family. On the other hand, single female/mother families (70 | 11.7%) represent the smallest median family size with 2.06 persons per family.
| Family Type | # Families | Family Size |
| Married-Couple | 405 (67.5%) | 3.05 |
| Single Male/Father | 125 (20.8%) | 3.54 |
| Single Female/Mother | 70 (11.7%) | 2.06 |
| Total Families | 600 (100.0%) | 3.04 |
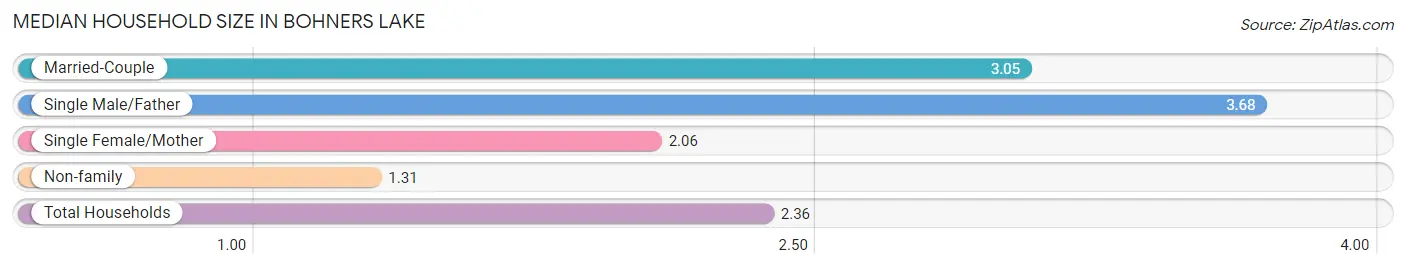
Median Household Size in Bohners Lake
The median household size in Bohners Lake is 2.36 persons per household, with single male/father households (125 | 12.5%) accounting for the largest median household size of 3.68 persons per household. non-family households (400 | 40.0%) represent the smallest median household size with 1.31 persons per household.
| Household Type | # Households | Household Size |
| Married-Couple | 405 (40.5%) | 3.05 |
| Single Male/Father | 125 (12.5%) | 3.68 |
| Single Female/Mother | 70 (7.0%) | 2.06 |
| Non-family | 400 (40.0%) | 1.31 |
| Total Households | 1,000 (100.0%) | 2.36 |
Household Size by Marriage Status in Bohners Lake
Out of a total of 1,000 households in Bohners Lake, 600 (60.0%) are family households, while 400 (40.0%) are nonfamily households. The most numerous type of family households are 2-person households, comprising 258, and the most common type of nonfamily households are 1-person households, comprising 274.
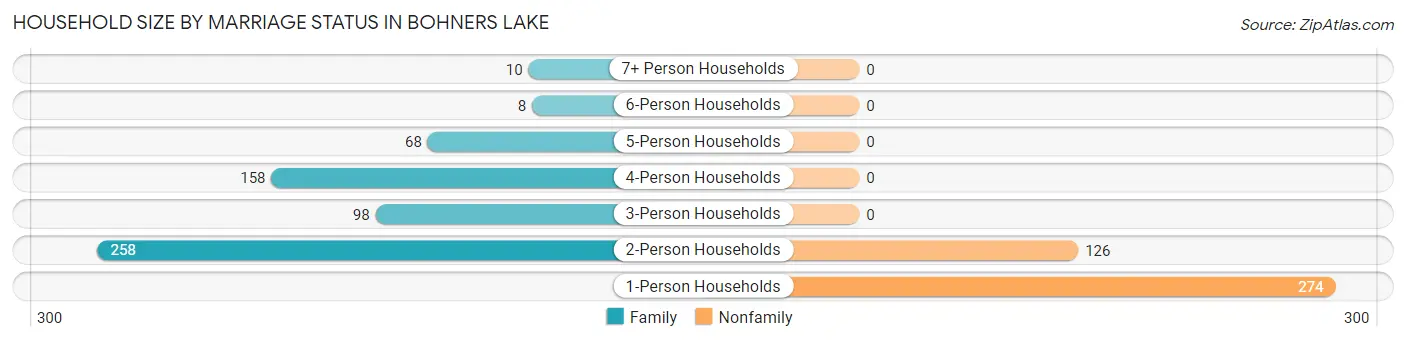
| Household Size | Family Households | Nonfamily Households |
| 1-Person Households | - | 274 (27.4%) |
| 2-Person Households | 258 (25.8%) | 126 (12.6%) |
| 3-Person Households | 98 (9.8%) | 0 (0.0%) |
| 4-Person Households | 158 (15.8%) | 0 (0.0%) |
| 5-Person Households | 68 (6.8%) | 0 (0.0%) |
| 6-Person Households | 8 (0.8%) | 0 (0.0%) |
| 7+ Person Households | 10 (1.0%) | 0 (0.0%) |
| Total | 600 (60.0%) | 400 (40.0%) |
Female Fertility in Bohners Lake
Fertility by Age in Bohners Lake
Average fertility rate in Bohners Lake is 33.0 births per 1,000 women. Women in the age bracket of 35 to 50 years have the highest fertility rate with 67.0 births per 1,000 women. Women in the age bracket of 35 to 50 years acount for 100.0% of all women with births.
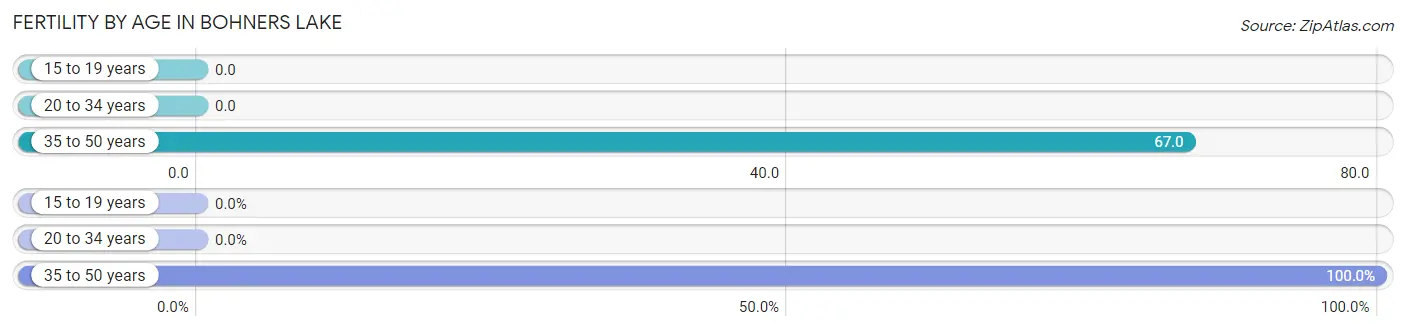
| Age Bracket | Women with Births | Births / 1,000 Women |
| 15 to 19 years | 0 (0.0%) | 0.0 |
| 20 to 34 years | 0 (0.0%) | 0.0 |
| 35 to 50 years | 13 (100.0%) | 67.0 |
| Total | 13 (100.0%) | 33.0 |
Fertility by Age by Marriage Status in Bohners Lake
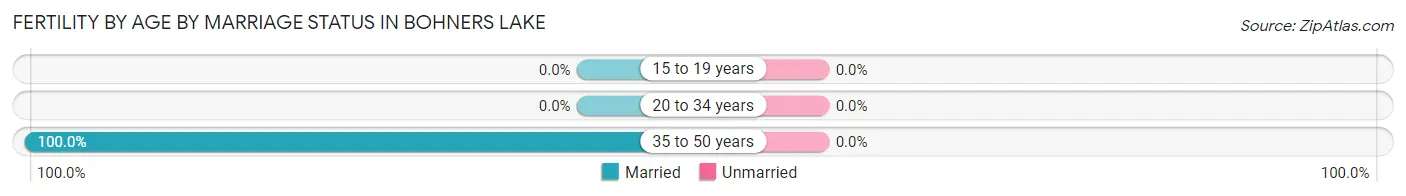
| Age Bracket | Married | Unmarried |
| 15 to 19 years | 0 (0.0%) | 0 (0.0%) |
| 20 to 34 years | 0 (0.0%) | 0 (0.0%) |
| 35 to 50 years | 13 (100.0%) | 0 (0.0%) |
| Total | 13 (100.0%) | 0 (0.0%) |
Fertility by Education in Bohners Lake
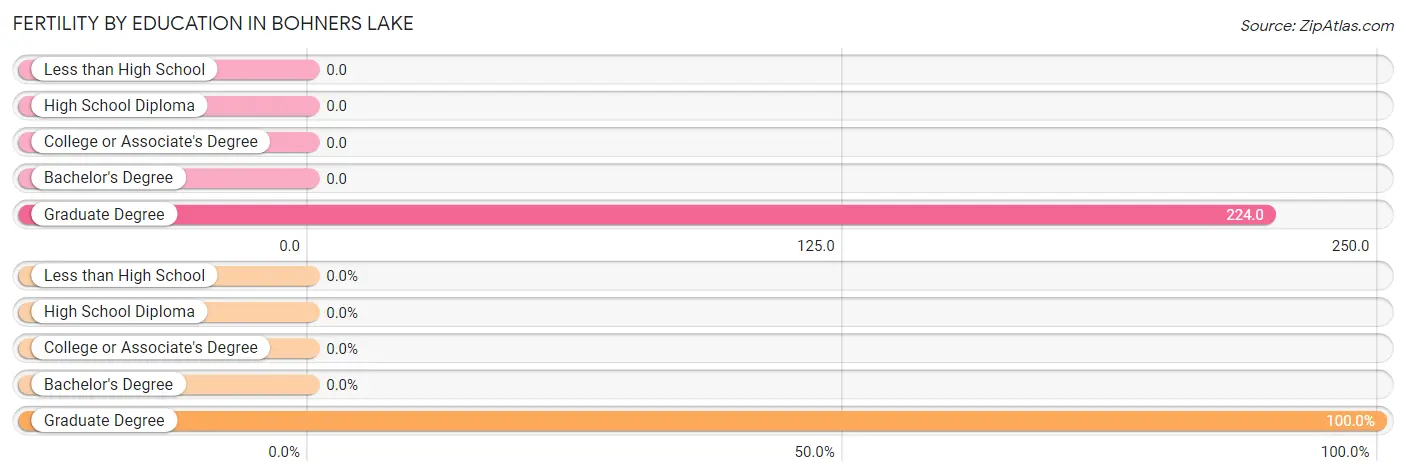
| Educational Attainment | Women with Births | Births / 1,000 Women |
| Less than High School | 0 (0.0%) | 0.0 |
| High School Diploma | 0 (0.0%) | 0.0 |
| College or Associate's Degree | 0 (0.0%) | 0.0 |
| Bachelor's Degree | 0 (0.0%) | 0.0 |
| Graduate Degree | 13 (100.0%) | 224.0 |
| Total | 13 (100.0%) | 33.0 |
Fertility by Education by Marriage Status in Bohners Lake
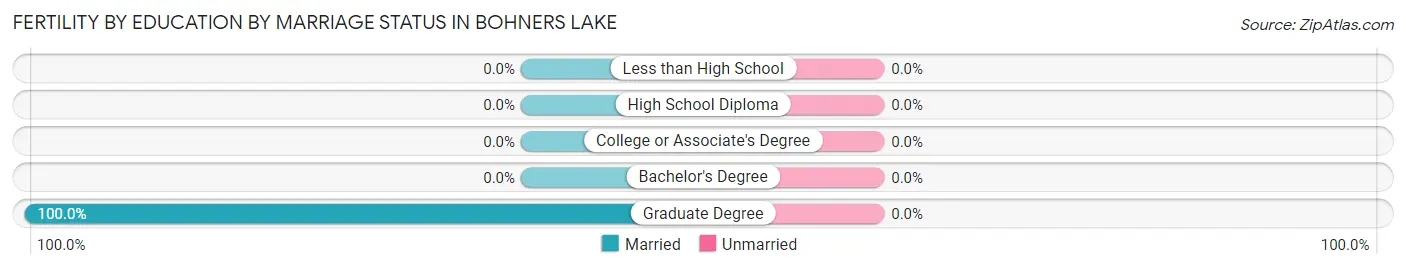
| Educational Attainment | Married | Unmarried |
| Less than High School | 0 (0.0%) | 0 (0.0%) |
| High School Diploma | 0 (0.0%) | 0 (0.0%) |
| College or Associate's Degree | 0 (0.0%) | 0 (0.0%) |
| Bachelor's Degree | 0 (0.0%) | 0 (0.0%) |
| Graduate Degree | 13 (100.0%) | 0 (0.0%) |
| Total | 13 (100.0%) | 0 (0.0%) |
Employment Characteristics in Bohners Lake
Employment by Class of Employer in Bohners Lake
Among the 1,145 employed individuals in Bohners Lake, private company employees (886 | 77.4%), self-employed (incorporated) (89 | 7.8%), and not-for-profit organizations (72 | 6.3%) make up the most common classes of employment.
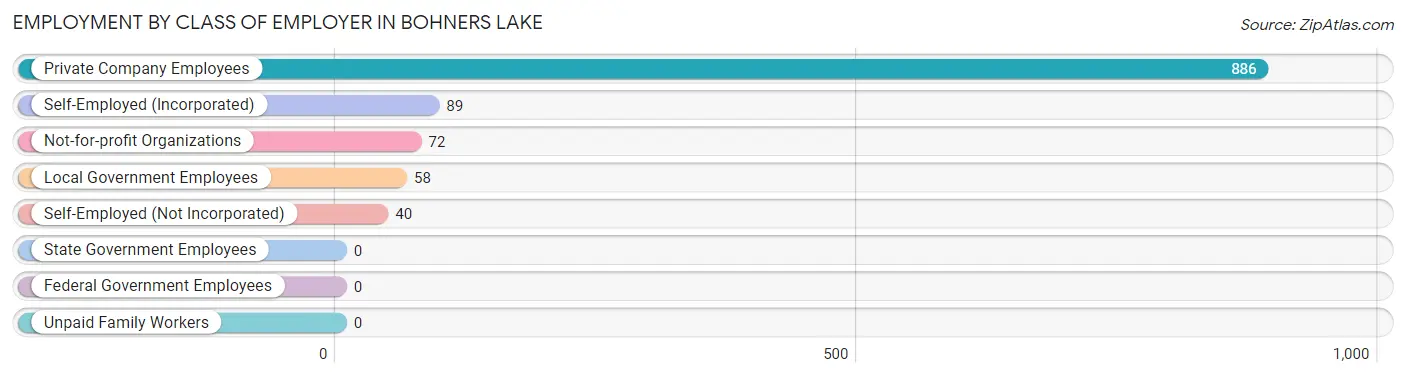
| Employer Class | # Employees | % Employees |
| Private Company Employees | 886 | 77.4% |
| Self-Employed (Incorporated) | 89 | 7.8% |
| Self-Employed (Not Incorporated) | 40 | 3.5% |
| Not-for-profit Organizations | 72 | 6.3% |
| Local Government Employees | 58 | 5.1% |
| State Government Employees | 0 | 0.0% |
| Federal Government Employees | 0 | 0.0% |
| Unpaid Family Workers | 0 | 0.0% |
| Total | 1,145 | 100.0% |
Employment Status by Age in Bohners Lake
According to the labor force statistics for Bohners Lake, out of the total population over 16 years of age (1,937), 64.1% or 1,242 individuals are in the labor force, with 7.7% or 96 of them unemployed. The age group with the highest labor force participation rate is 25 to 29 years, with 100.0% or 31 individuals in the labor force. Within the labor force, the 16 to 19 years age range has the highest percentage of unemployed individuals, with 78.8% or 67 of them being unemployed.
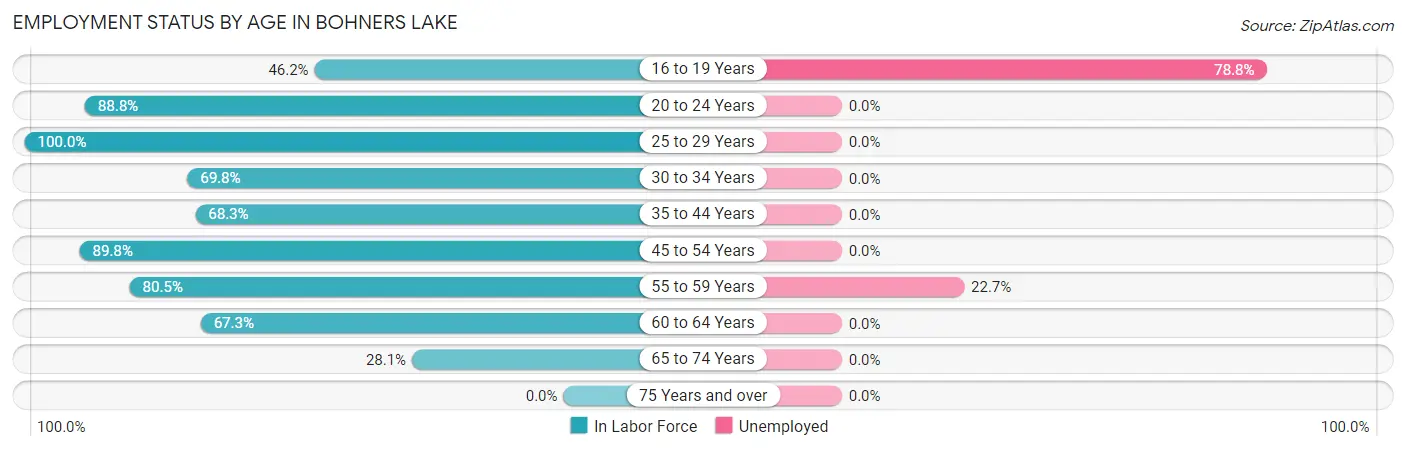
| Age Bracket | In Labor Force | Unemployed |
| 16 to 19 Years | 85 (46.2%) | 67 (78.8%) |
| 20 to 24 Years | 151 (88.8%) | 0 (0.0%) |
| 25 to 29 Years | 31 (100.0%) | 0 (0.0%) |
| 30 to 34 Years | 104 (69.8%) | 0 (0.0%) |
| 35 to 44 Years | 211 (68.3%) | 0 (0.0%) |
| 45 to 54 Years | 335 (89.8%) | 0 (0.0%) |
| 55 to 59 Years | 128 (80.5%) | 29 (22.7%) |
| 60 to 64 Years | 146 (67.3%) | 0 (0.0%) |
| 65 to 74 Years | 50 (28.1%) | 0 (0.0%) |
| 75 Years and over | 0 (0.0%) | 0 (0.0%) |
| Total | 1,242 (64.1%) | 96 (7.7%) |
Employment Status by Educational Attainment in Bohners Lake
According to labor force statistics for Bohners Lake, 77.1% of individuals (954) out of the total population between 25 and 64 years of age (1,238) are in the labor force, with 3.0% or 29 of them being unemployed. The group with the highest labor force participation rate are those with the educational attainment of bachelor's degree or higher, with 87.9% or 218 individuals in the labor force. Within the labor force, individuals with less than high school education have the highest percentage of unemployment, with 61.7% or 29 of them being unemployed.
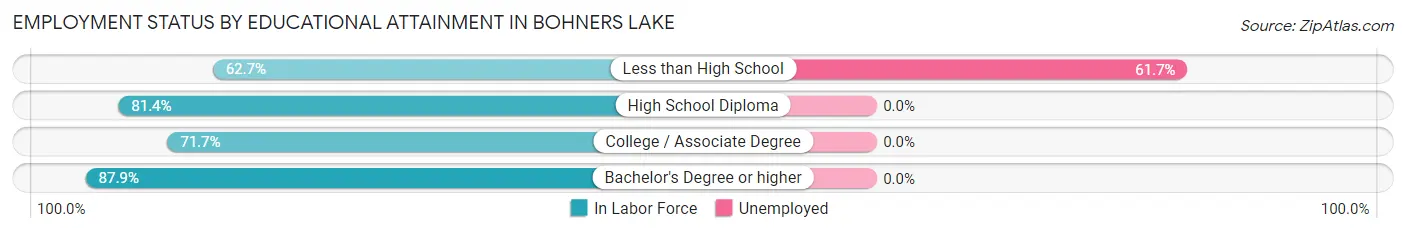
| Educational Attainment | In Labor Force | Unemployed |
| Less than High School | 47 (62.7%) | 46 (61.7%) |
| High School Diploma | 284 (81.4%) | 0 (0.0%) |
| College / Associate Degree | 406 (71.7%) | 0 (0.0%) |
| Bachelor's Degree or higher | 218 (87.9%) | 0 (0.0%) |
| Total | 954 (77.1%) | 37 (3.0%) |
Employment Occupations by Sex in Bohners Lake
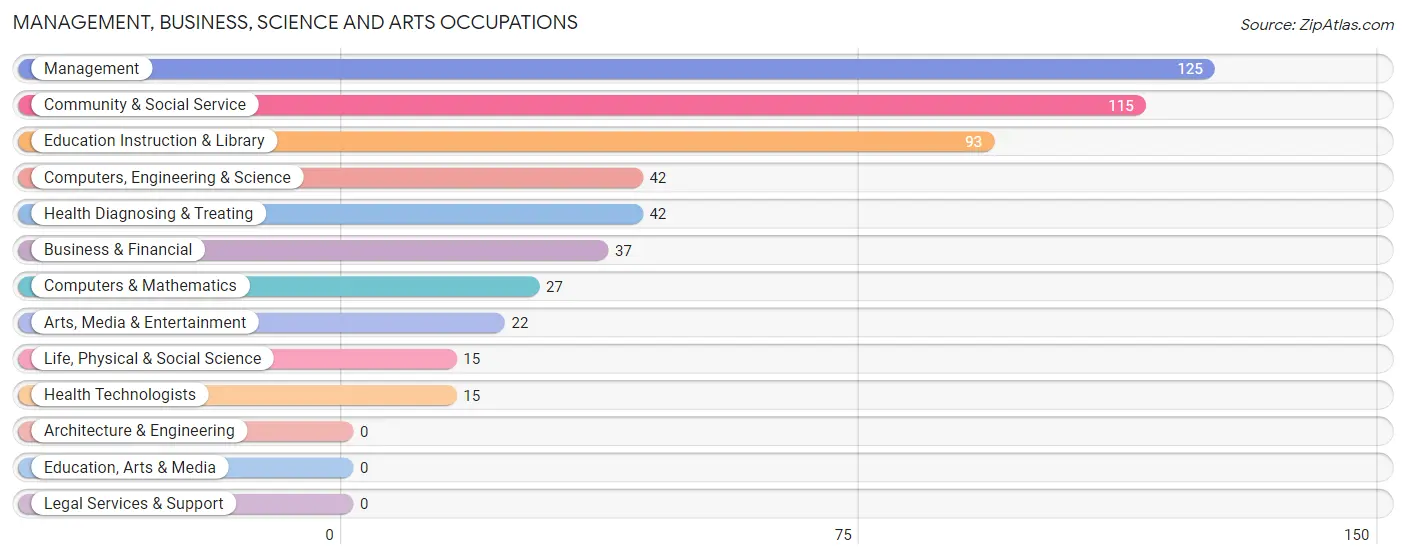
Management, Business, Science and Arts Occupations
The most common Management, Business, Science and Arts occupations in Bohners Lake are Management (125 | 10.9%), Community & Social Service (115 | 10.0%), Education Instruction & Library (93 | 8.1%), Computers, Engineering & Science (42 | 3.7%), and Health Diagnosing & Treating (42 | 3.7%).
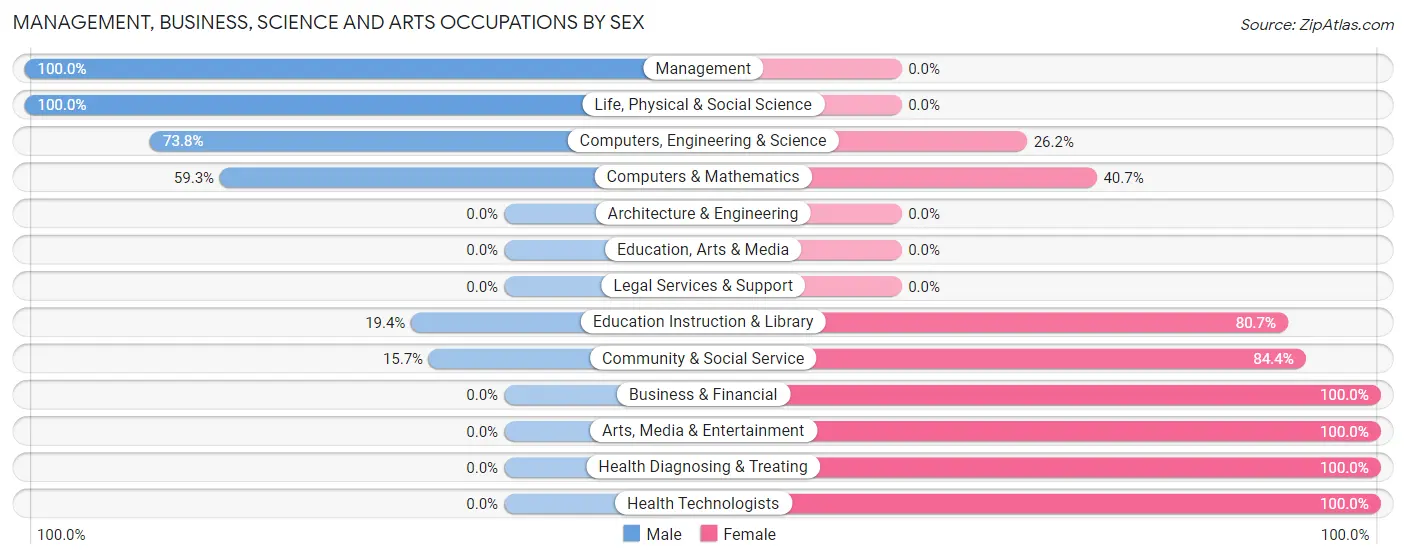
Management, Business, Science and Arts Occupations by Sex
Within the Management, Business, Science and Arts occupations in Bohners Lake, the most male-oriented occupations are Management (100.0%), Life, Physical & Social Science (100.0%), and Computers, Engineering & Science (73.8%), while the most female-oriented occupations are Business & Financial (100.0%), Arts, Media & Entertainment (100.0%), and Health Diagnosing & Treating (100.0%).
| Occupation | Male | Female |
| Management | 125 (100.0%) | 0 (0.0%) |
| Business & Financial | 0 (0.0%) | 37 (100.0%) |
| Computers, Engineering & Science | 31 (73.8%) | 11 (26.2%) |
| Computers & Mathematics | 16 (59.3%) | 11 (40.7%) |
| Architecture & Engineering | 0 (0.0%) | 0 (0.0%) |
| Life, Physical & Social Science | 15 (100.0%) | 0 (0.0%) |
| Community & Social Service | 18 (15.7%) | 97 (84.4%) |
| Education, Arts & Media | 0 (0.0%) | 0 (0.0%) |
| Legal Services & Support | 0 (0.0%) | 0 (0.0%) |
| Education Instruction & Library | 18 (19.4%) | 75 (80.6%) |
| Arts, Media & Entertainment | 0 (0.0%) | 22 (100.0%) |
| Health Diagnosing & Treating | 0 (0.0%) | 42 (100.0%) |
| Health Technologists | 0 (0.0%) | 15 (100.0%) |
| Total (Category) | 174 (48.2%) | 187 (51.8%) |
| Total (Overall) | 726 (63.4%) | 419 (36.6%) |
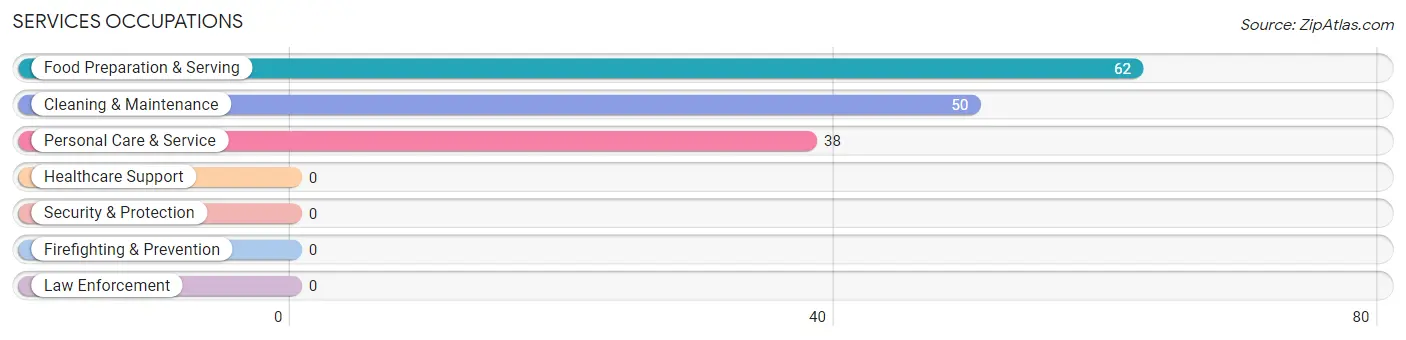
Services Occupations
The most common Services occupations in Bohners Lake are Food Preparation & Serving (62 | 5.4%), Cleaning & Maintenance (50 | 4.4%), and Personal Care & Service (38 | 3.3%).
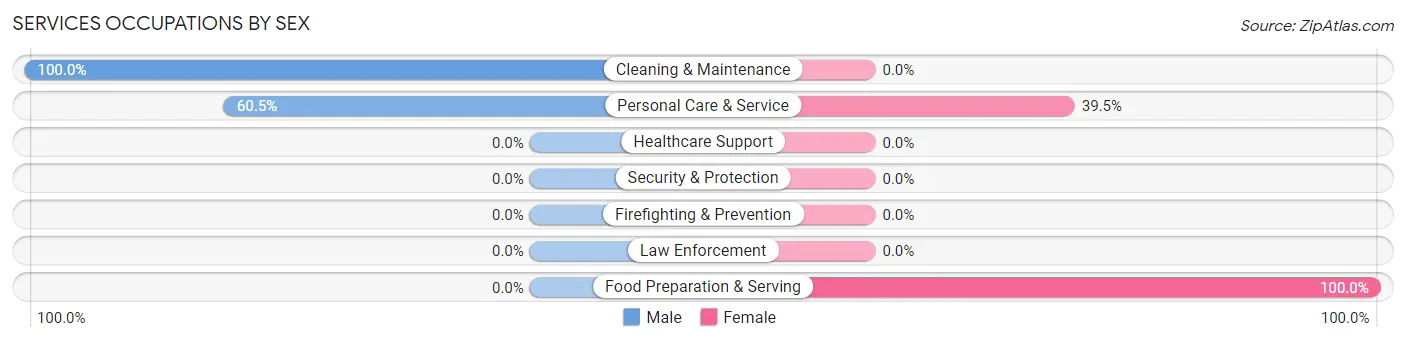
Services Occupations by Sex
Within the Services occupations in Bohners Lake, the most male-oriented occupations are Cleaning & Maintenance (100.0%), and Personal Care & Service (60.5%), while the most female-oriented occupations are Food Preparation & Serving (100.0%), and Personal Care & Service (39.5%).
| Occupation | Male | Female |
| Healthcare Support | 0 (0.0%) | 0 (0.0%) |
| Security & Protection | 0 (0.0%) | 0 (0.0%) |
| Firefighting & Prevention | 0 (0.0%) | 0 (0.0%) |
| Law Enforcement | 0 (0.0%) | 0 (0.0%) |
| Food Preparation & Serving | 0 (0.0%) | 62 (100.0%) |
| Cleaning & Maintenance | 50 (100.0%) | 0 (0.0%) |
| Personal Care & Service | 23 (60.5%) | 15 (39.5%) |
| Total (Category) | 73 (48.7%) | 77 (51.3%) |
| Total (Overall) | 726 (63.4%) | 419 (36.6%) |
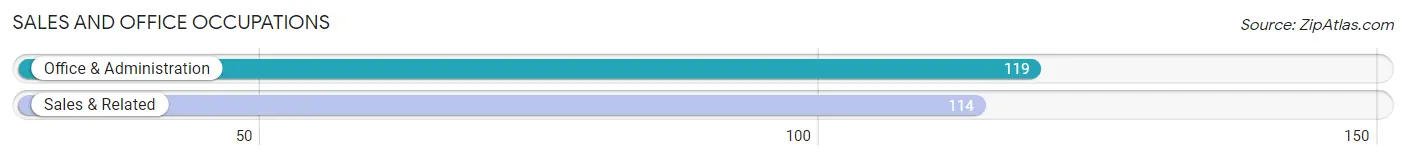
Sales and Office Occupations
The most common Sales and Office occupations in Bohners Lake are Office & Administration (119 | 10.4%), and Sales & Related (114 | 10.0%).
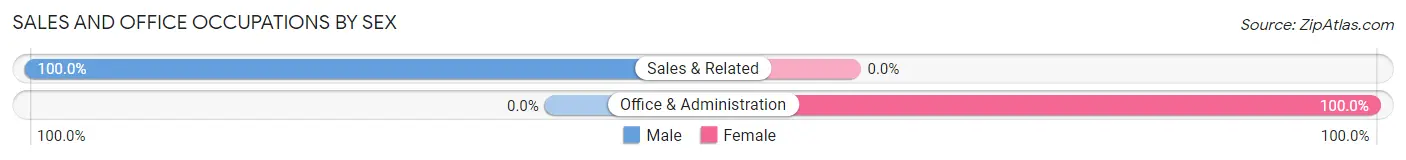
Sales and Office Occupations by Sex
| Occupation | Male | Female |
| Sales & Related | 114 (100.0%) | 0 (0.0%) |
| Office & Administration | 0 (0.0%) | 119 (100.0%) |
| Total (Category) | 114 (48.9%) | 119 (51.1%) |
| Total (Overall) | 726 (63.4%) | 419 (36.6%) |
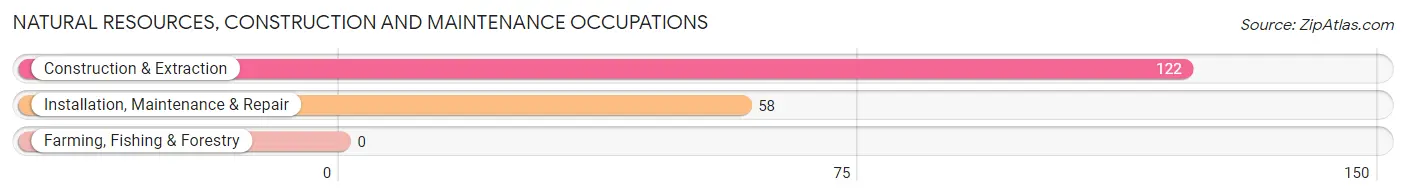
Natural Resources, Construction and Maintenance Occupations
The most common Natural Resources, Construction and Maintenance occupations in Bohners Lake are Construction & Extraction (122 | 10.7%), and Installation, Maintenance & Repair (58 | 5.1%).
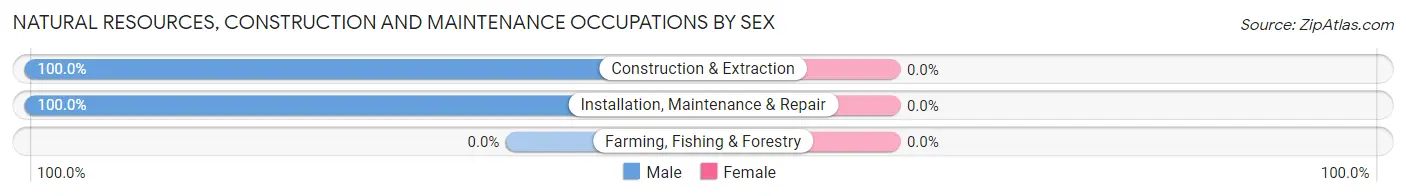
Natural Resources, Construction and Maintenance Occupations by Sex
| Occupation | Male | Female |
| Farming, Fishing & Forestry | 0 (0.0%) | 0 (0.0%) |
| Construction & Extraction | 122 (100.0%) | 0 (0.0%) |
| Installation, Maintenance & Repair | 58 (100.0%) | 0 (0.0%) |
| Total (Category) | 180 (100.0%) | 0 (0.0%) |
| Total (Overall) | 726 (63.4%) | 419 (36.6%) |
Production, Transportation and Moving Occupations
The most common Production, Transportation and Moving occupations in Bohners Lake are Production (183 | 16.0%), and Transportation (38 | 3.3%).
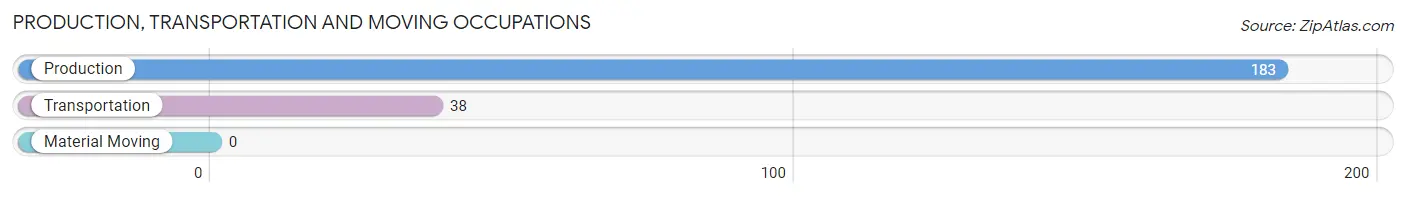
Production, Transportation and Moving Occupations by Sex
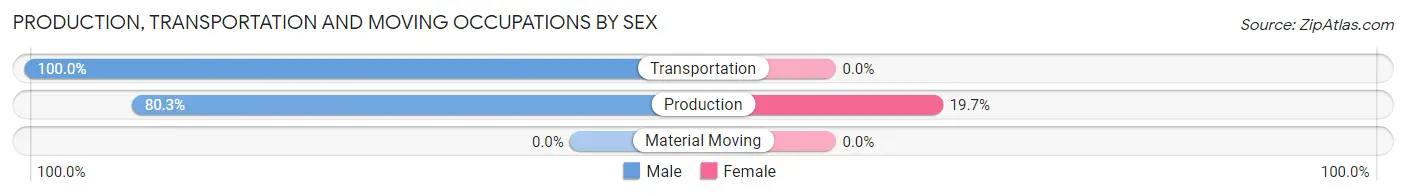
| Occupation | Male | Female |
| Production | 147 (80.3%) | 36 (19.7%) |
| Transportation | 38 (100.0%) | 0 (0.0%) |
| Material Moving | 0 (0.0%) | 0 (0.0%) |
| Total (Category) | 185 (83.7%) | 36 (16.3%) |
| Total (Overall) | 726 (63.4%) | 419 (36.6%) |
Employment Industries by Sex in Bohners Lake
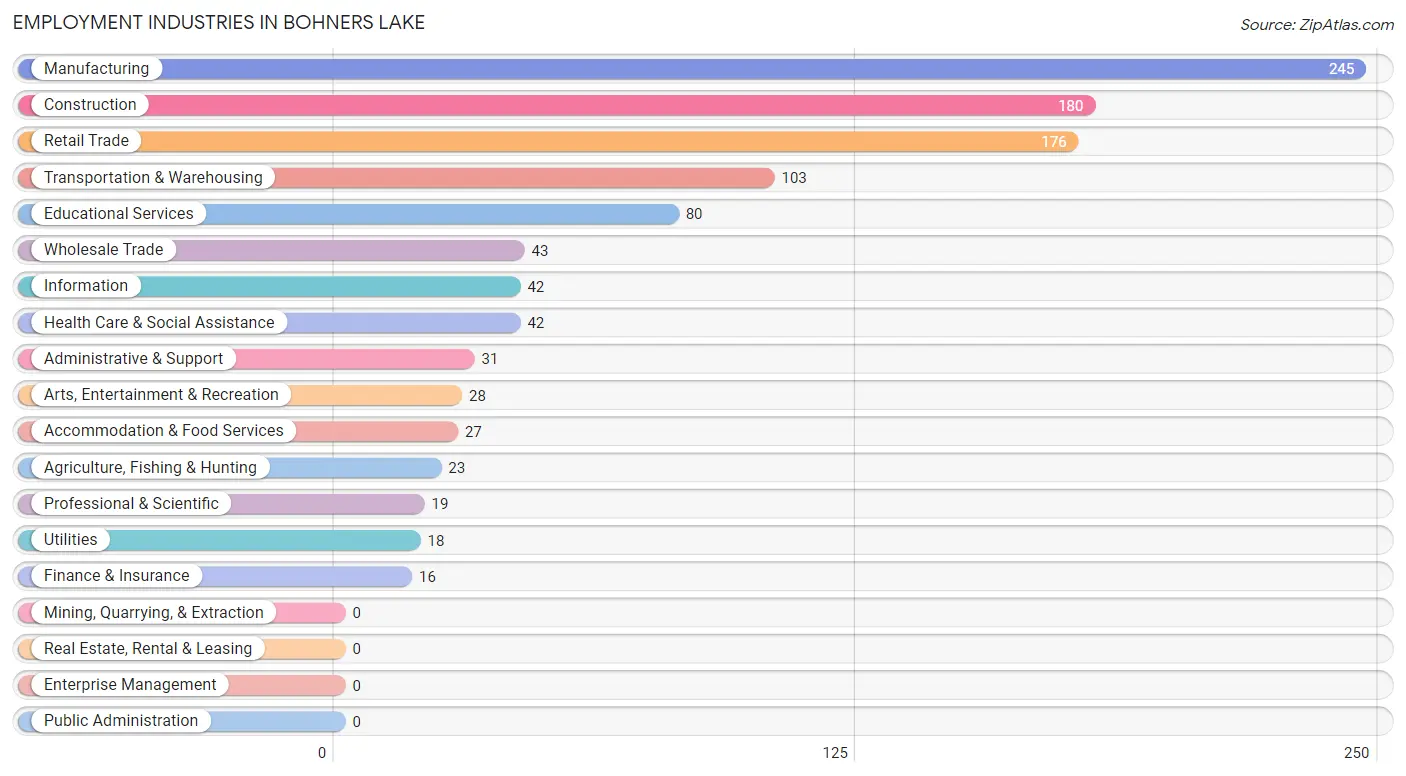
Employment Industries in Bohners Lake
The major employment industries in Bohners Lake include Manufacturing (245 | 21.4%), Construction (180 | 15.7%), Retail Trade (176 | 15.4%), Transportation & Warehousing (103 | 9.0%), and Educational Services (80 | 7.0%).
Employment Industries by Sex in Bohners Lake
The Bohners Lake industries that see more men than women are Agriculture, Fishing & Hunting (100.0%), Wholesale Trade (100.0%), and Utilities (100.0%), whereas the industries that tend to have a higher number of women are Professional & Scientific (100.0%), Health Care & Social Assistance (100.0%), and Arts, Entertainment & Recreation (100.0%).
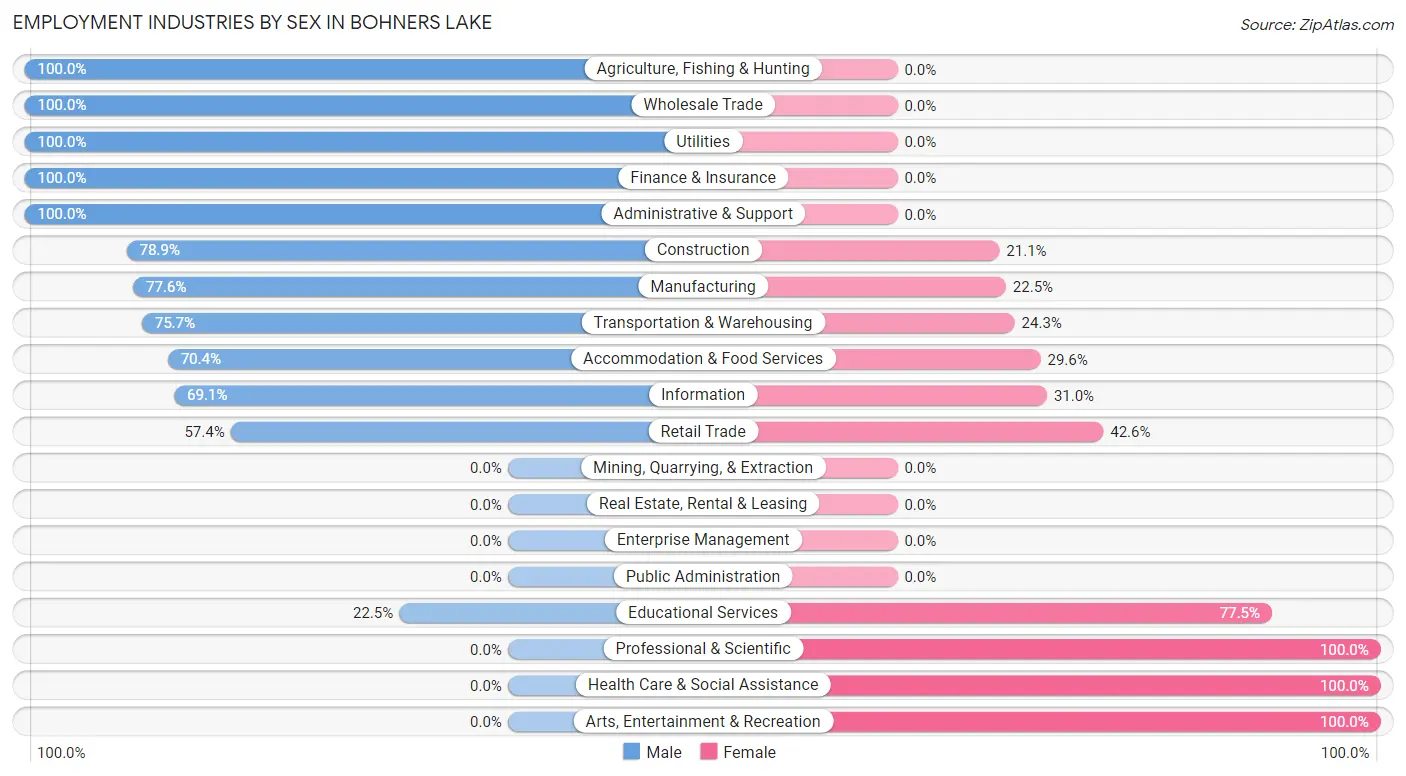
| Industry | Male | Female |
| Agriculture, Fishing & Hunting | 23 (100.0%) | 0 (0.0%) |
| Mining, Quarrying, & Extraction | 0 (0.0%) | 0 (0.0%) |
| Construction | 142 (78.9%) | 38 (21.1%) |
| Manufacturing | 190 (77.5%) | 55 (22.5%) |
| Wholesale Trade | 43 (100.0%) | 0 (0.0%) |
| Retail Trade | 101 (57.4%) | 75 (42.6%) |
| Transportation & Warehousing | 78 (75.7%) | 25 (24.3%) |
| Utilities | 18 (100.0%) | 0 (0.0%) |
| Information | 29 (69.1%) | 13 (30.9%) |
| Finance & Insurance | 16 (100.0%) | 0 (0.0%) |
| Real Estate, Rental & Leasing | 0 (0.0%) | 0 (0.0%) |
| Professional & Scientific | 0 (0.0%) | 19 (100.0%) |
| Enterprise Management | 0 (0.0%) | 0 (0.0%) |
| Administrative & Support | 31 (100.0%) | 0 (0.0%) |
| Educational Services | 18 (22.5%) | 62 (77.5%) |
| Health Care & Social Assistance | 0 (0.0%) | 42 (100.0%) |
| Arts, Entertainment & Recreation | 0 (0.0%) | 28 (100.0%) |
| Accommodation & Food Services | 19 (70.4%) | 8 (29.6%) |
| Public Administration | 0 (0.0%) | 0 (0.0%) |
| Total | 726 (63.4%) | 419 (36.6%) |
Education in Bohners Lake
School Enrollment in Bohners Lake
The most common levels of schooling among the 453 students in Bohners Lake are high school (166 | 36.6%), elementary school (137 | 30.2%), and middle school (75 | 16.6%).
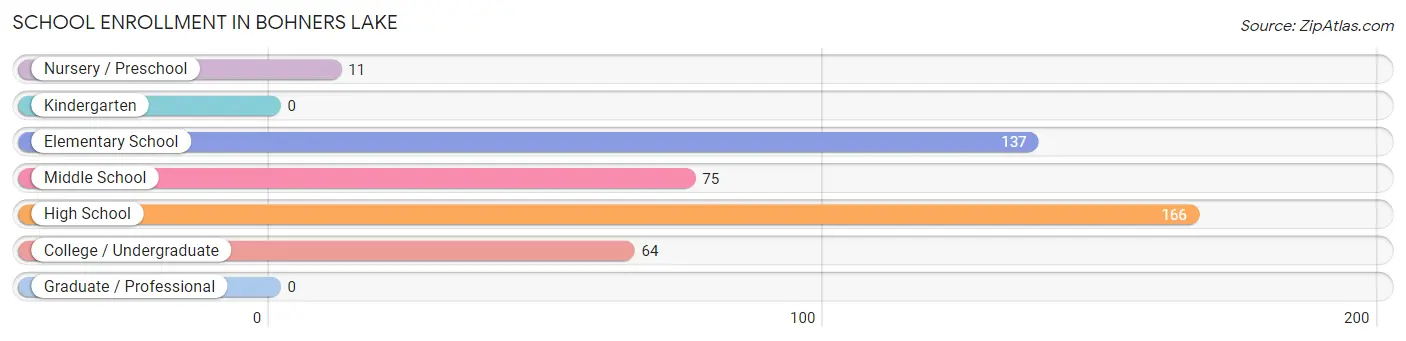
| School Level | # Students | % Students |
| Nursery / Preschool | 11 | 2.4% |
| Kindergarten | 0 | 0.0% |
| Elementary School | 137 | 30.2% |
| Middle School | 75 | 16.6% |
| High School | 166 | 36.6% |
| College / Undergraduate | 64 | 14.1% |
| Graduate / Professional | 0 | 0.0% |
| Total | 453 | 100.0% |
School Enrollment by Age by Funding Source in Bohners Lake
Out of a total of 453 students who are enrolled in schools in Bohners Lake, 45 (9.9%) attend a private institution, while the remaining 408 (90.1%) are enrolled in public schools. The age group of 18 to 19 year olds has the highest likelihood of being enrolled in private schools, with 10 (100.0% in the age bracket) enrolled. Conversely, the age group of 20 to 24 year olds has the lowest likelihood of being enrolled in a private school, with 19 (100.0% in the age bracket) attending a public institution.
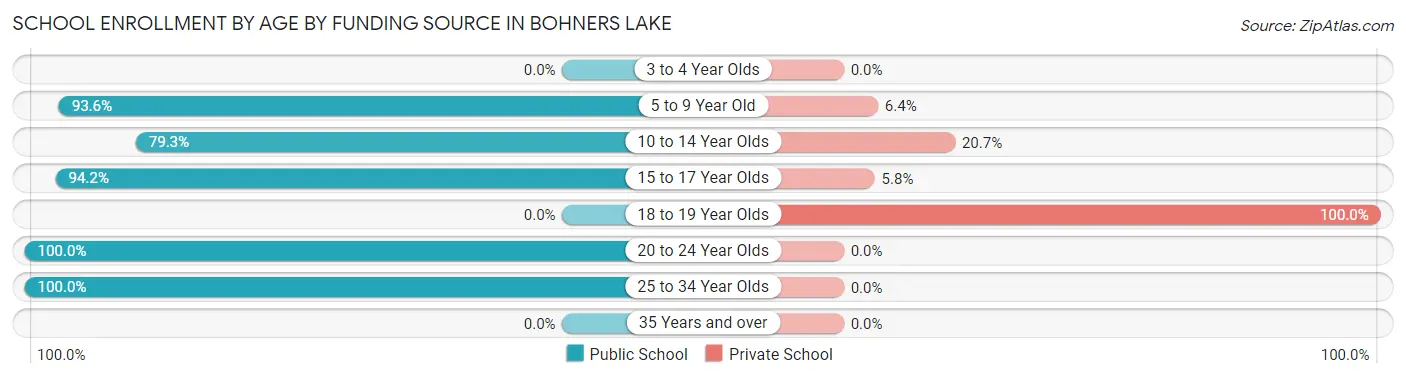
| Age Bracket | Public School | Private School |
| 3 to 4 Year Olds | 0 (0.0%) | 0 (0.0%) |
| 5 to 9 Year Old | 132 (93.6%) | 9 (6.4%) |
| 10 to 14 Year Olds | 65 (79.3%) | 17 (20.7%) |
| 15 to 17 Year Olds | 147 (94.2%) | 9 (5.8%) |
| 18 to 19 Year Olds | 0 (0.0%) | 10 (100.0%) |
| 20 to 24 Year Olds | 19 (100.0%) | 0 (0.0%) |
| 25 to 34 Year Olds | 45 (100.0%) | 0 (0.0%) |
| 35 Years and over | 0 (0.0%) | 0 (0.0%) |
| Total | 408 (90.1%) | 45 (9.9%) |
Educational Attainment by Field of Study in Bohners Lake
Education (157 | 42.8%), engineering (44 | 12.0%), visual & performing arts (33 | 9.0%), physical & health sciences (28 | 7.6%), and liberal arts & history (28 | 7.6%) are the most common fields of study among 367 individuals in Bohners Lake who have obtained a bachelor's degree or higher.
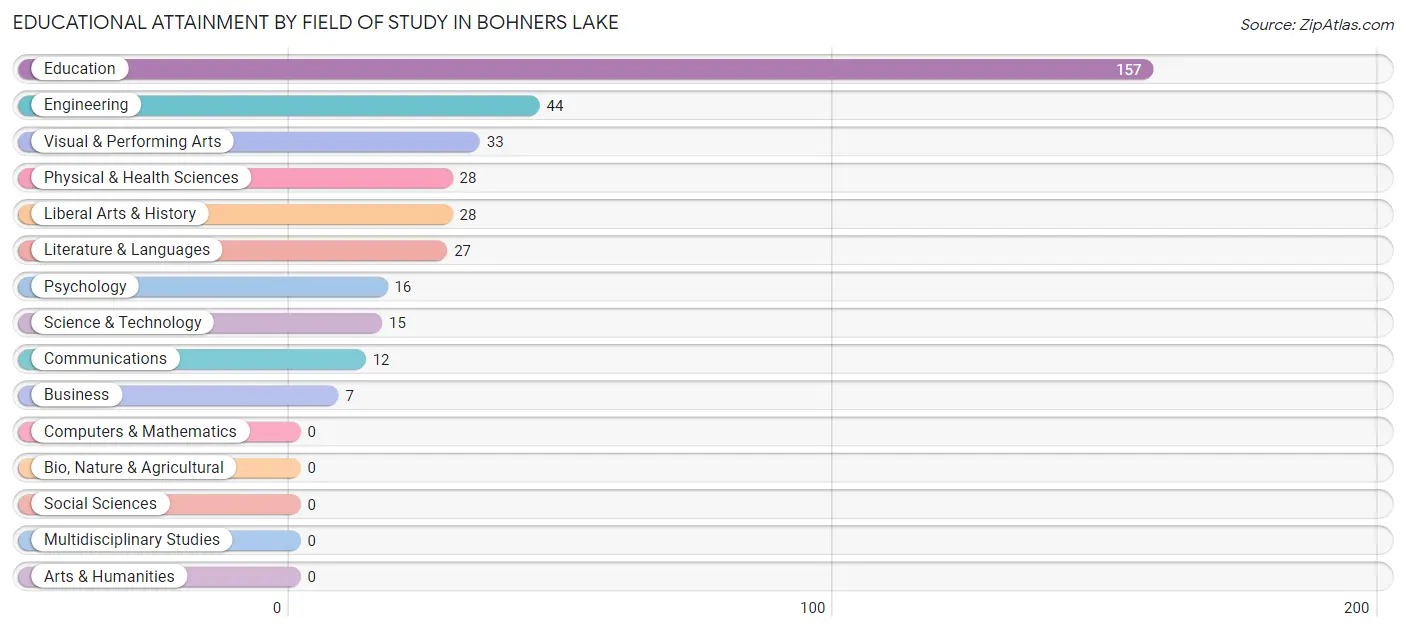
| Field of Study | # Graduates | % Graduates |
| Computers & Mathematics | 0 | 0.0% |
| Bio, Nature & Agricultural | 0 | 0.0% |
| Physical & Health Sciences | 28 | 7.6% |
| Psychology | 16 | 4.4% |
| Social Sciences | 0 | 0.0% |
| Engineering | 44 | 12.0% |
| Multidisciplinary Studies | 0 | 0.0% |
| Science & Technology | 15 | 4.1% |
| Business | 7 | 1.9% |
| Education | 157 | 42.8% |
| Literature & Languages | 27 | 7.4% |
| Liberal Arts & History | 28 | 7.6% |
| Visual & Performing Arts | 33 | 9.0% |
| Communications | 12 | 3.3% |
| Arts & Humanities | 0 | 0.0% |
| Total | 367 | 100.0% |
Transportation & Commute in Bohners Lake
Vehicle Availability by Sex in Bohners Lake
The most prevalent vehicle ownership categories in Bohners Lake are males with 2 vehicles (213, accounting for 29.3%) and females with 2 vehicles (176, making up 50.8%).
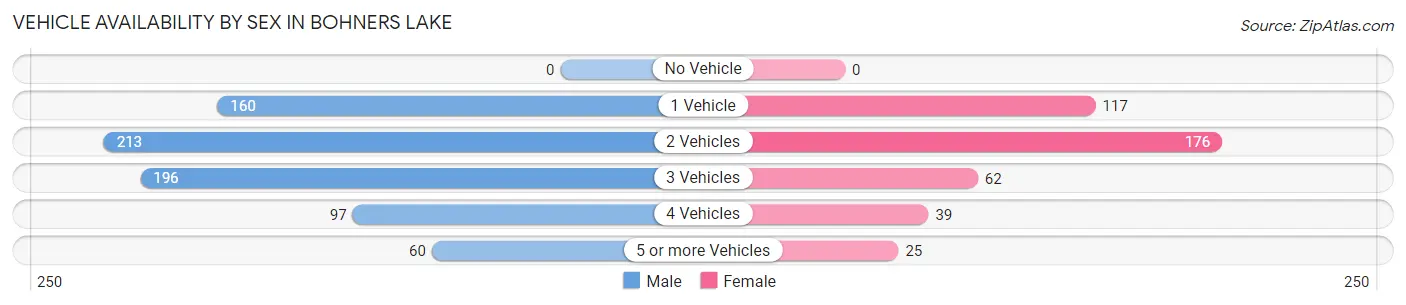
| Vehicles Available | Male | Female |
| No Vehicle | 0 (0.0%) | 0 (0.0%) |
| 1 Vehicle | 160 (22.0%) | 117 (27.9%) |
| 2 Vehicles | 213 (29.3%) | 176 (42.0%) |
| 3 Vehicles | 196 (27.0%) | 62 (14.8%) |
| 4 Vehicles | 97 (13.4%) | 39 (9.3%) |
| 5 or more Vehicles | 60 (8.3%) | 25 (6.0%) |
| Total | 726 (100.0%) | 419 (100.0%) |
Commute Time in Bohners Lake
The most frequently occuring commute durations in Bohners Lake are 10 to 14 minutes (403 commuters, 37.0%), 20 to 24 minutes (175 commuters, 16.1%), and 15 to 19 minutes (110 commuters, 10.1%).
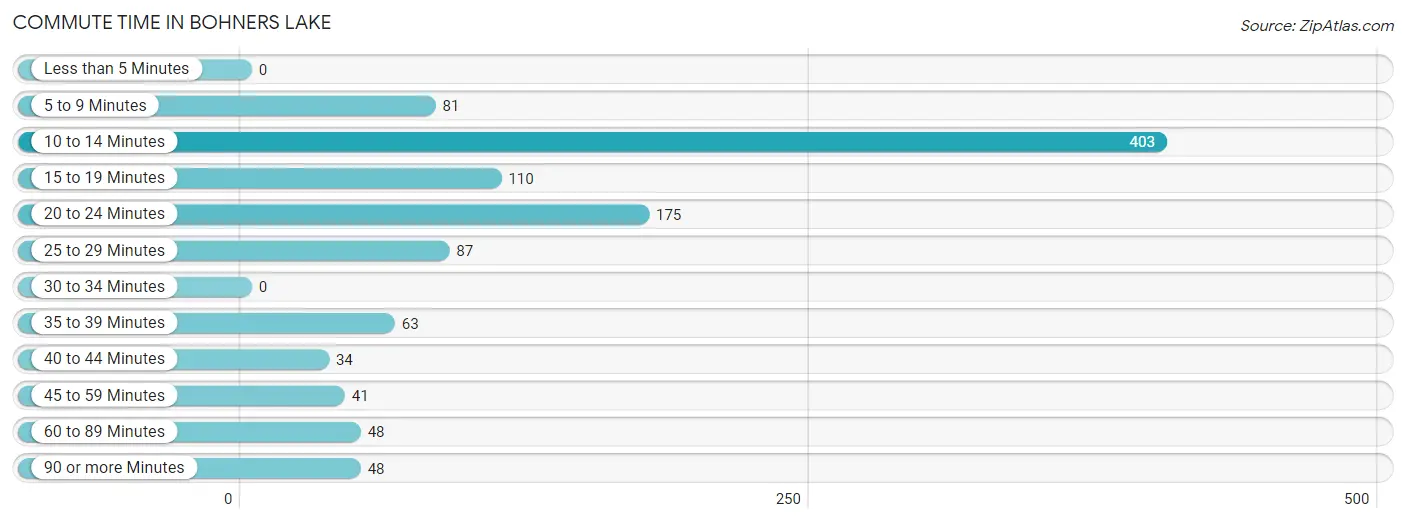
| Commute Time | # Commuters | % Commuters |
| Less than 5 Minutes | 0 | 0.0% |
| 5 to 9 Minutes | 81 | 7.4% |
| 10 to 14 Minutes | 403 | 37.0% |
| 15 to 19 Minutes | 110 | 10.1% |
| 20 to 24 Minutes | 175 | 16.1% |
| 25 to 29 Minutes | 87 | 8.0% |
| 30 to 34 Minutes | 0 | 0.0% |
| 35 to 39 Minutes | 63 | 5.8% |
| 40 to 44 Minutes | 34 | 3.1% |
| 45 to 59 Minutes | 41 | 3.8% |
| 60 to 89 Minutes | 48 | 4.4% |
| 90 or more Minutes | 48 | 4.4% |
Commute Time by Sex in Bohners Lake
The most common commute times in Bohners Lake are 10 to 14 minutes (284 commuters, 40.1%) for males and 10 to 14 minutes (119 commuters, 31.2%) for females.
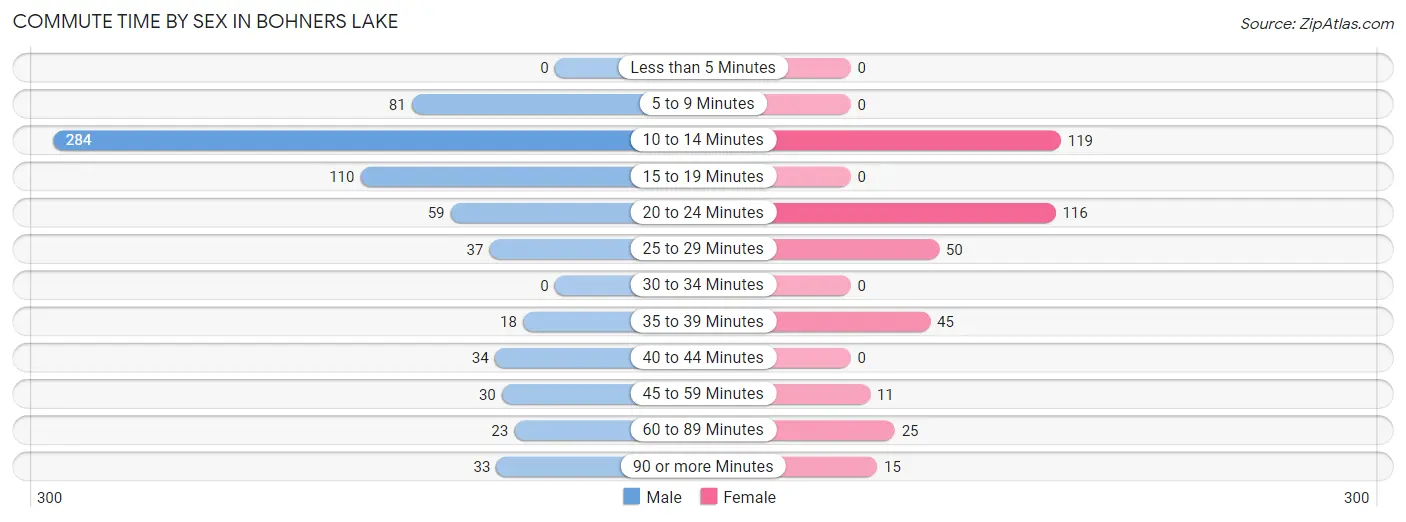
| Commute Time | Male | Female |
| Less than 5 Minutes | 0 (0.0%) | 0 (0.0%) |
| 5 to 9 Minutes | 81 (11.4%) | 0 (0.0%) |
| 10 to 14 Minutes | 284 (40.1%) | 119 (31.2%) |
| 15 to 19 Minutes | 110 (15.5%) | 0 (0.0%) |
| 20 to 24 Minutes | 59 (8.3%) | 116 (30.4%) |
| 25 to 29 Minutes | 37 (5.2%) | 50 (13.1%) |
| 30 to 34 Minutes | 0 (0.0%) | 0 (0.0%) |
| 35 to 39 Minutes | 18 (2.5%) | 45 (11.8%) |
| 40 to 44 Minutes | 34 (4.8%) | 0 (0.0%) |
| 45 to 59 Minutes | 30 (4.2%) | 11 (2.9%) |
| 60 to 89 Minutes | 23 (3.2%) | 25 (6.6%) |
| 90 or more Minutes | 33 (4.6%) | 15 (3.9%) |
Time of Departure to Work by Sex in Bohners Lake
The most frequent times of departure to work in Bohners Lake are 7:30 AM to 7:59 AM (120, 16.9%) for males and 12:00 AM to 4:59 AM (104, 27.3%) for females.
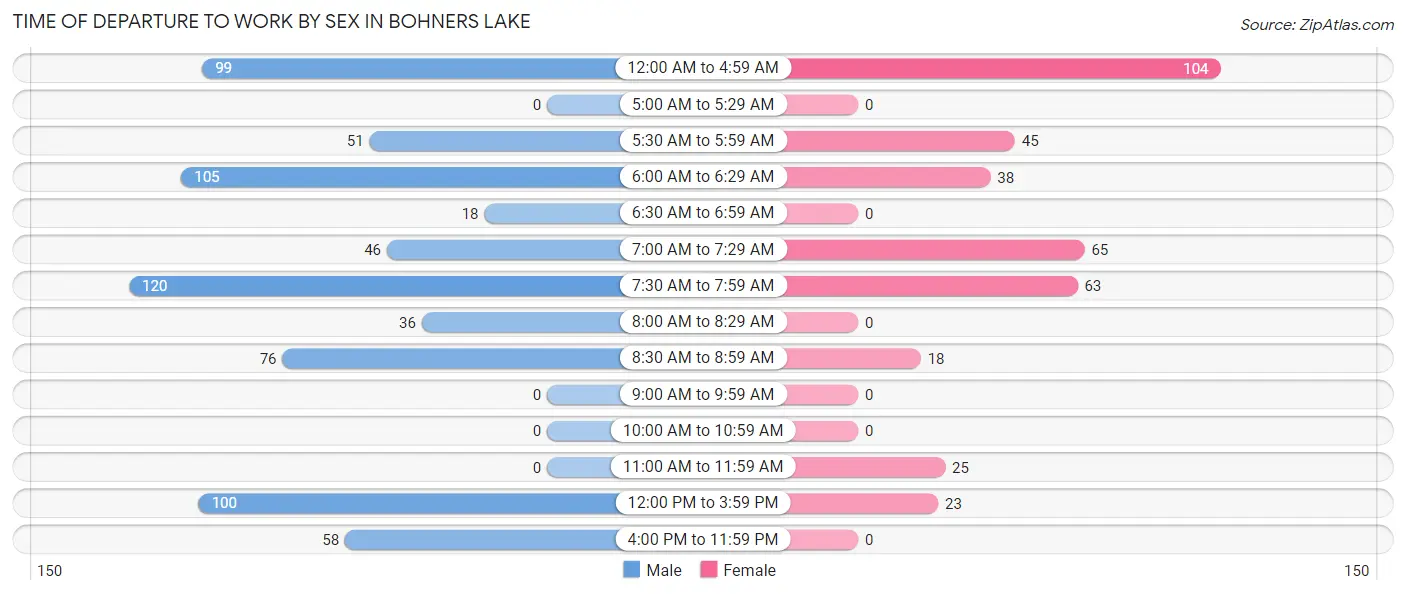
| Time of Departure | Male | Female |
| 12:00 AM to 4:59 AM | 99 (14.0%) | 104 (27.3%) |
| 5:00 AM to 5:29 AM | 0 (0.0%) | 0 (0.0%) |
| 5:30 AM to 5:59 AM | 51 (7.2%) | 45 (11.8%) |
| 6:00 AM to 6:29 AM | 105 (14.8%) | 38 (10.0%) |
| 6:30 AM to 6:59 AM | 18 (2.5%) | 0 (0.0%) |
| 7:00 AM to 7:29 AM | 46 (6.5%) | 65 (17.1%) |
| 7:30 AM to 7:59 AM | 120 (16.9%) | 63 (16.5%) |
| 8:00 AM to 8:29 AM | 36 (5.1%) | 0 (0.0%) |
| 8:30 AM to 8:59 AM | 76 (10.7%) | 18 (4.7%) |
| 9:00 AM to 9:59 AM | 0 (0.0%) | 0 (0.0%) |
| 10:00 AM to 10:59 AM | 0 (0.0%) | 0 (0.0%) |
| 11:00 AM to 11:59 AM | 0 (0.0%) | 25 (6.6%) |
| 12:00 PM to 3:59 PM | 100 (14.1%) | 23 (6.0%) |
| 4:00 PM to 11:59 PM | 58 (8.2%) | 0 (0.0%) |
| Total | 709 (100.0%) | 381 (100.0%) |
Housing Occupancy in Bohners Lake
Occupancy by Ownership in Bohners Lake
Of the total 1,000 dwellings in Bohners Lake, owner-occupied units account for 854 (85.4%), while renter-occupied units make up 146 (14.6%).
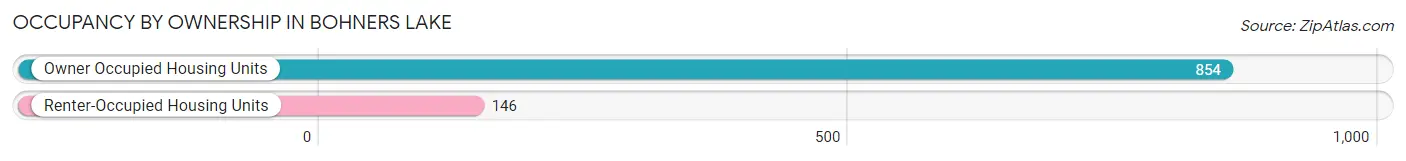
| Occupancy | # Housing Units | % Housing Units |
| Owner Occupied Housing Units | 854 | 85.4% |
| Renter-Occupied Housing Units | 146 | 14.6% |
| Total Occupied Housing Units | 1,000 | 100.0% |
Occupancy by Household Size in Bohners Lake
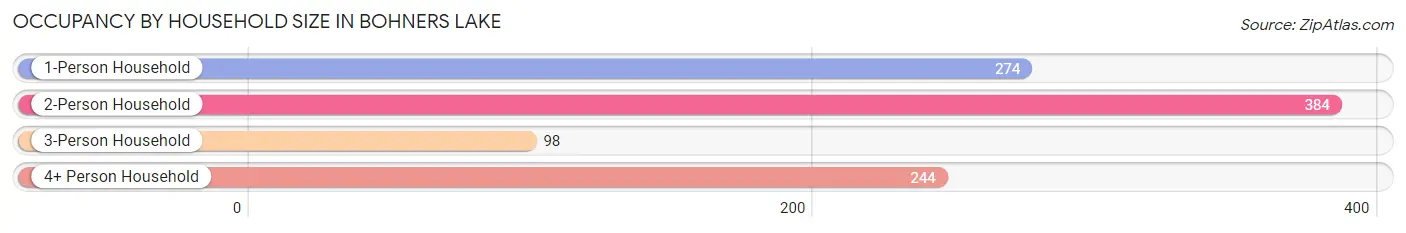
| Household Size | # Housing Units | % Housing Units |
| 1-Person Household | 274 | 27.4% |
| 2-Person Household | 384 | 38.4% |
| 3-Person Household | 98 | 9.8% |
| 4+ Person Household | 244 | 24.4% |
| Total Housing Units | 1,000 | 100.0% |
Occupancy by Ownership by Household Size in Bohners Lake
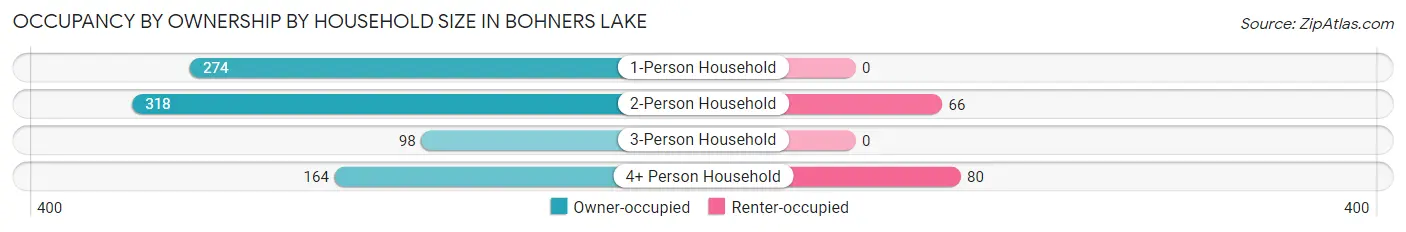
| Household Size | Owner-occupied | Renter-occupied |
| 1-Person Household | 274 (100.0%) | 0 (0.0%) |
| 2-Person Household | 318 (82.8%) | 66 (17.2%) |
| 3-Person Household | 98 (100.0%) | 0 (0.0%) |
| 4+ Person Household | 164 (67.2%) | 80 (32.8%) |
| Total Housing Units | 854 (85.4%) | 146 (14.6%) |
Occupancy by Educational Attainment in Bohners Lake
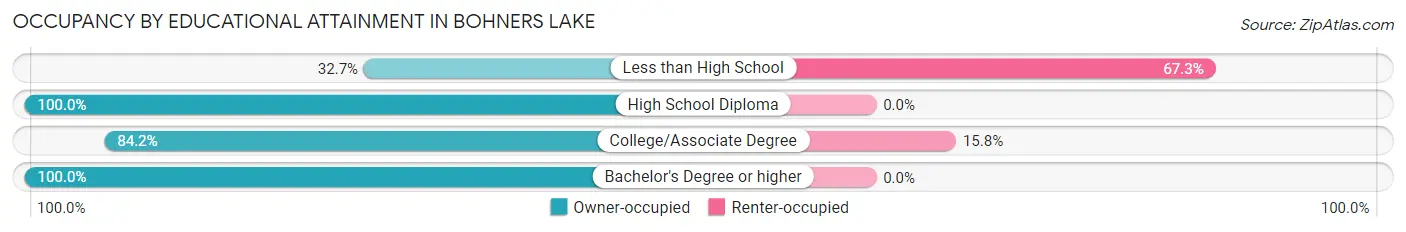
| Household Size | Owner-occupied | Renter-occupied |
| Less than High School | 36 (32.7%) | 74 (67.3%) |
| High School Diploma | 216 (100.0%) | 0 (0.0%) |
| College/Associate Degree | 383 (84.2%) | 72 (15.8%) |
| Bachelor's Degree or higher | 219 (100.0%) | 0 (0.0%) |
Occupancy by Age of Householder in Bohners Lake
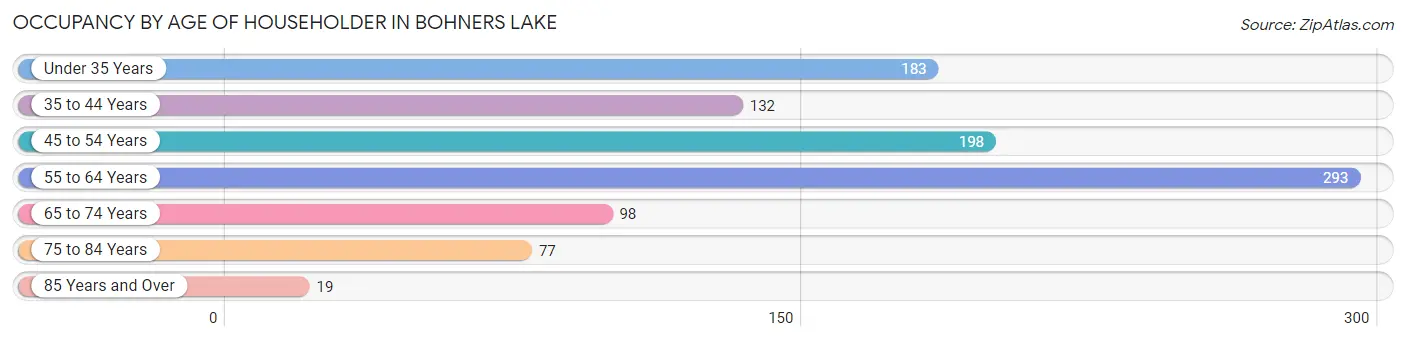
| Age Bracket | # Households | % Households |
| Under 35 Years | 183 | 18.3% |
| 35 to 44 Years | 132 | 13.2% |
| 45 to 54 Years | 198 | 19.8% |
| 55 to 64 Years | 293 | 29.3% |
| 65 to 74 Years | 98 | 9.8% |
| 75 to 84 Years | 77 | 7.7% |
| 85 Years and Over | 19 | 1.9% |
| Total | 1,000 | 100.0% |
Housing Finances in Bohners Lake
Median Income by Occupancy in Bohners Lake
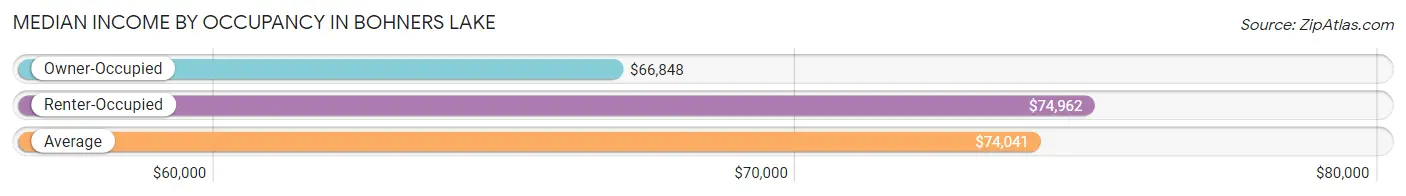
| Occupancy Type | # Households | Median Income |
| Owner-Occupied | 854 (85.4%) | $66,848 |
| Renter-Occupied | 146 (14.6%) | $74,962 |
| Average | 1,000 (100.0%) | $74,041 |
Occupancy by Householder Income Bracket in Bohners Lake
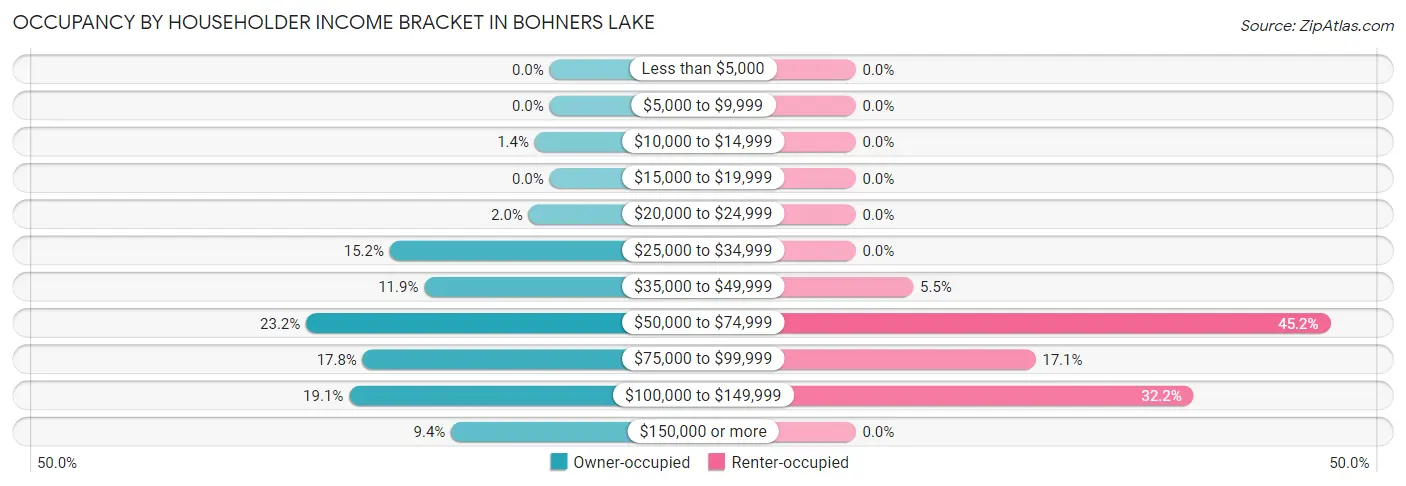
| Income Bracket | Owner-occupied | Renter-occupied |
| Less than $5,000 | 0 (0.0%) | 0 (0.0%) |
| $5,000 to $9,999 | 0 (0.0%) | 0 (0.0%) |
| $10,000 to $14,999 | 12 (1.4%) | 0 (0.0%) |
| $15,000 to $19,999 | 0 (0.0%) | 0 (0.0%) |
| $20,000 to $24,999 | 17 (2.0%) | 0 (0.0%) |
| $25,000 to $34,999 | 130 (15.2%) | 0 (0.0%) |
| $35,000 to $49,999 | 102 (11.9%) | 8 (5.5%) |
| $50,000 to $74,999 | 198 (23.2%) | 66 (45.2%) |
| $75,000 to $99,999 | 152 (17.8%) | 25 (17.1%) |
| $100,000 to $149,999 | 163 (19.1%) | 47 (32.2%) |
| $150,000 or more | 80 (9.4%) | 0 (0.0%) |
| Total | 854 (100.0%) | 146 (100.0%) |
Monthly Housing Cost Tiers in Bohners Lake
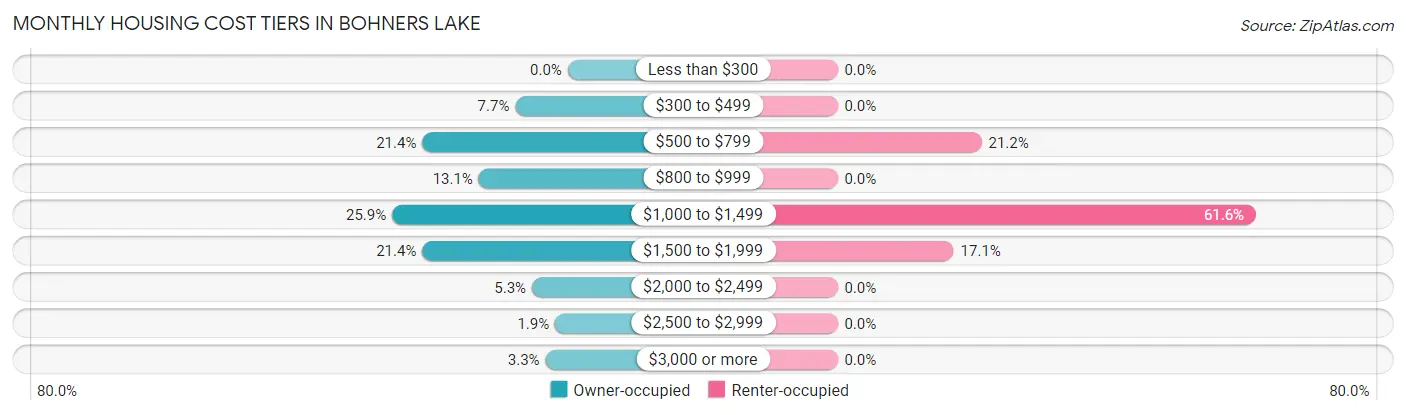
| Monthly Cost | Owner-occupied | Renter-occupied |
| Less than $300 | 0 (0.0%) | 0 (0.0%) |
| $300 to $499 | 66 (7.7%) | 0 (0.0%) |
| $500 to $799 | 183 (21.4%) | 31 (21.2%) |
| $800 to $999 | 112 (13.1%) | 0 (0.0%) |
| $1,000 to $1,499 | 221 (25.9%) | 90 (61.6%) |
| $1,500 to $1,999 | 183 (21.4%) | 25 (17.1%) |
| $2,000 to $2,499 | 45 (5.3%) | 0 (0.0%) |
| $2,500 to $2,999 | 16 (1.9%) | 0 (0.0%) |
| $3,000 or more | 28 (3.3%) | 0 (0.0%) |
| Total | 854 (100.0%) | 146 (100.0%) |
Physical Housing Characteristics in Bohners Lake
Housing Structures in Bohners Lake
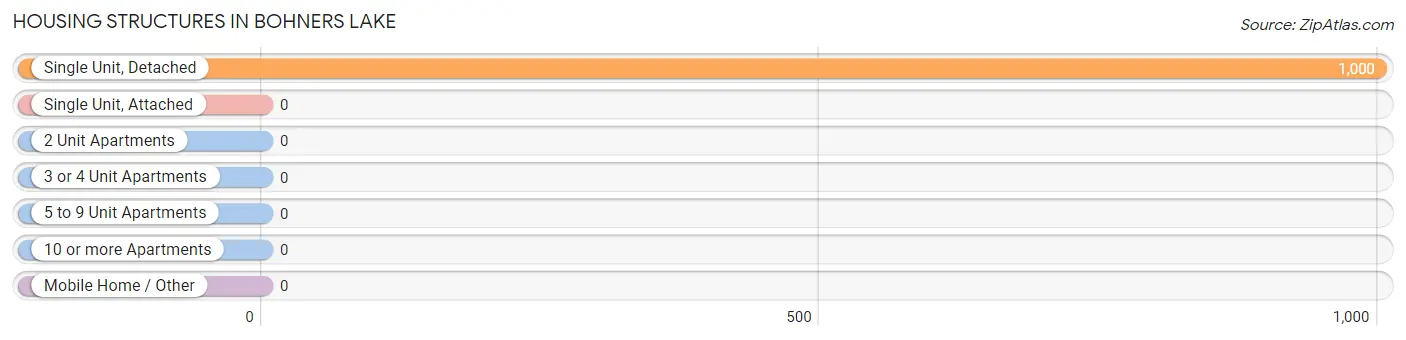
| Structure Type | # Housing Units | % Housing Units |
| Single Unit, Detached | 1,000 | 100.0% |
| Single Unit, Attached | 0 | 0.0% |
| 2 Unit Apartments | 0 | 0.0% |
| 3 or 4 Unit Apartments | 0 | 0.0% |
| 5 to 9 Unit Apartments | 0 | 0.0% |
| 10 or more Apartments | 0 | 0.0% |
| Mobile Home / Other | 0 | 0.0% |
| Total | 1,000 | 100.0% |
Housing Structures by Occupancy in Bohners Lake
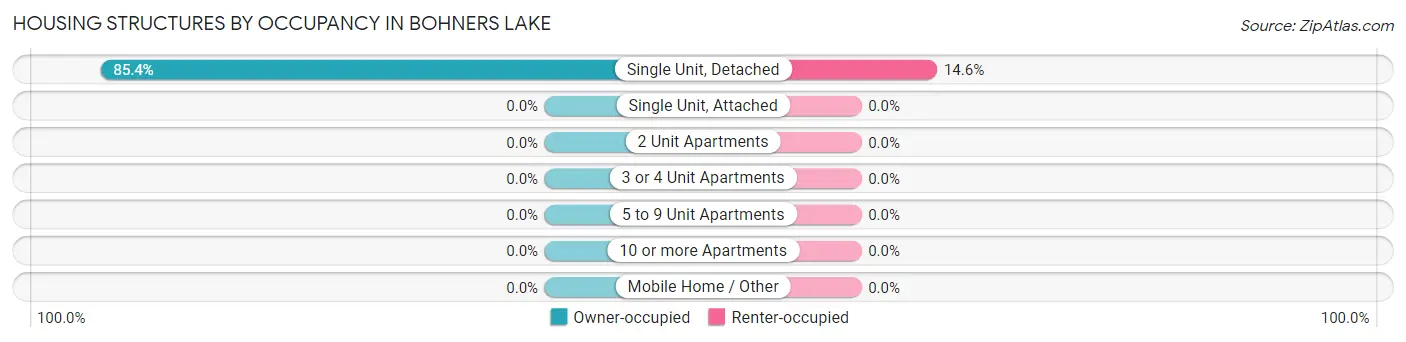
| Structure Type | Owner-occupied | Renter-occupied |
| Single Unit, Detached | 854 (85.4%) | 146 (14.6%) |
| Single Unit, Attached | 0 (0.0%) | 0 (0.0%) |
| 2 Unit Apartments | 0 (0.0%) | 0 (0.0%) |
| 3 or 4 Unit Apartments | 0 (0.0%) | 0 (0.0%) |
| 5 to 9 Unit Apartments | 0 (0.0%) | 0 (0.0%) |
| 10 or more Apartments | 0 (0.0%) | 0 (0.0%) |
| Mobile Home / Other | 0 (0.0%) | 0 (0.0%) |
| Total | 854 (85.4%) | 146 (14.6%) |
Housing Structures by Number of Rooms in Bohners Lake
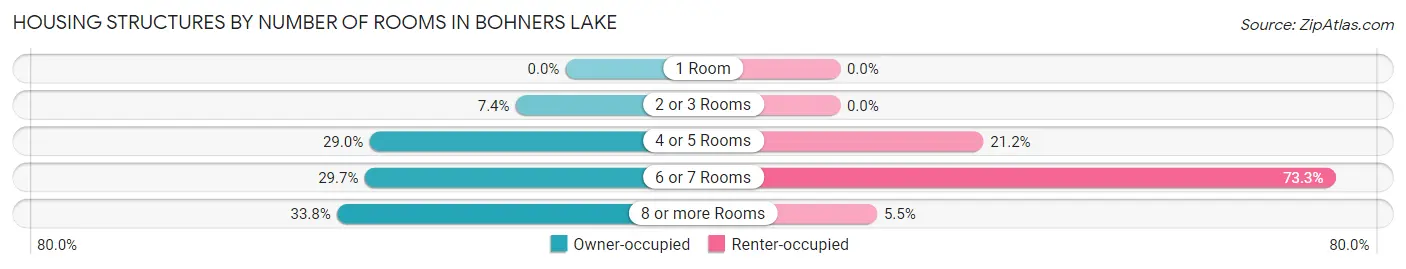
| Number of Rooms | Owner-occupied | Renter-occupied |
| 1 Room | 0 (0.0%) | 0 (0.0%) |
| 2 or 3 Rooms | 63 (7.4%) | 0 (0.0%) |
| 4 or 5 Rooms | 248 (29.0%) | 31 (21.2%) |
| 6 or 7 Rooms | 254 (29.7%) | 107 (73.3%) |
| 8 or more Rooms | 289 (33.8%) | 8 (5.5%) |
| Total | 854 (100.0%) | 146 (100.0%) |
Housing Structure by Heating Type in Bohners Lake
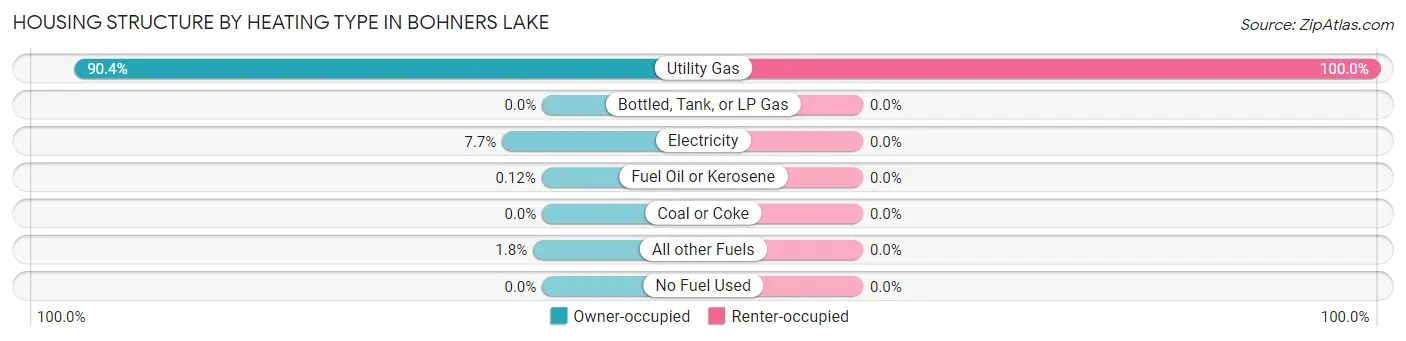
| Heating Type | Owner-occupied | Renter-occupied |
| Utility Gas | 772 (90.4%) | 146 (100.0%) |
| Bottled, Tank, or LP Gas | 0 (0.0%) | 0 (0.0%) |
| Electricity | 66 (7.7%) | 0 (0.0%) |
| Fuel Oil or Kerosene | 1 (0.1%) | 0 (0.0%) |
| Coal or Coke | 0 (0.0%) | 0 (0.0%) |
| All other Fuels | 15 (1.8%) | 0 (0.0%) |
| No Fuel Used | 0 (0.0%) | 0 (0.0%) |
| Total | 854 (100.0%) | 146 (100.0%) |
Household Vehicle Usage in Bohners Lake
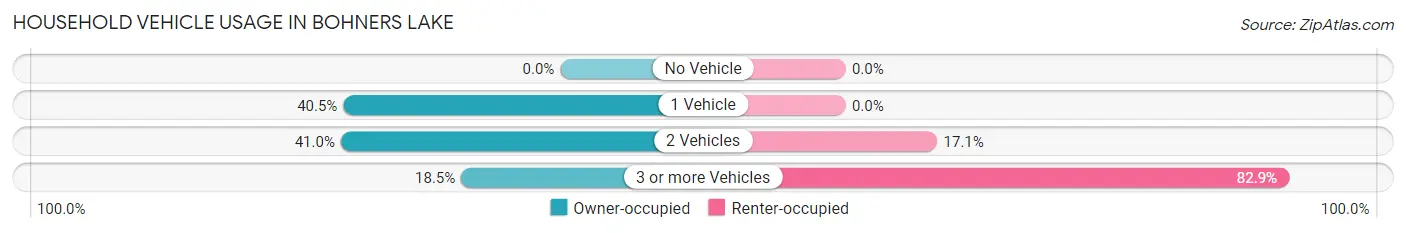
| Vehicles per Household | Owner-occupied | Renter-occupied |
| No Vehicle | 0 (0.0%) | 0 (0.0%) |
| 1 Vehicle | 346 (40.5%) | 0 (0.0%) |
| 2 Vehicles | 350 (41.0%) | 25 (17.1%) |
| 3 or more Vehicles | 158 (18.5%) | 121 (82.9%) |
| Total | 854 (100.0%) | 146 (100.0%) |
Real Estate & Mortgages in Bohners Lake
Real Estate and Mortgage Overview in Bohners Lake
| Characteristic | Without Mortgage | With Mortgage |
| Housing Units | 280 | 574 |
| Median Property Value | $200,000 | $223,800 |
| Median Household Income | - | - |
| Monthly Housing Costs | $578 | $28 |
| Real Estate Taxes | $2,627 | $0 |
Property Value by Mortgage Status in Bohners Lake
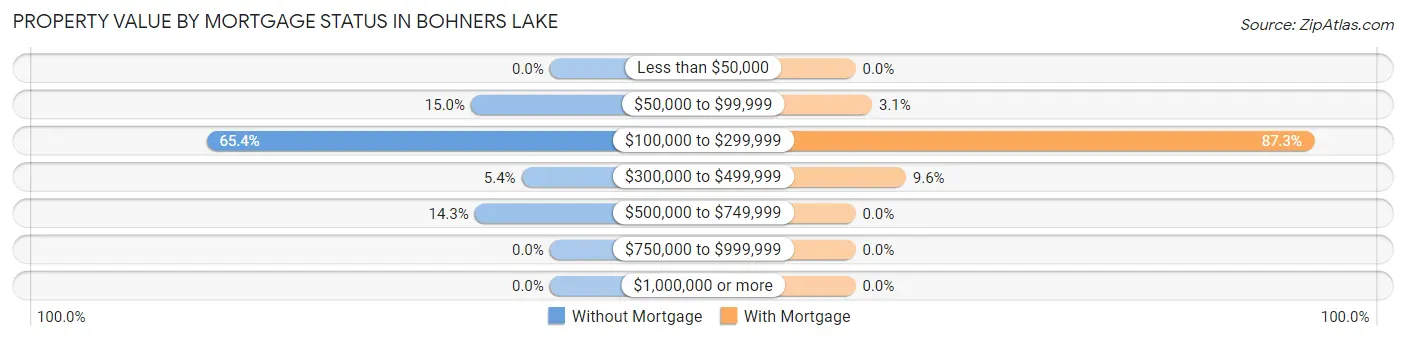
| Property Value | Without Mortgage | With Mortgage |
| Less than $50,000 | 0 (0.0%) | 0 (0.0%) |
| $50,000 to $99,999 | 42 (15.0%) | 18 (3.1%) |
| $100,000 to $299,999 | 183 (65.4%) | 501 (87.3%) |
| $300,000 to $499,999 | 15 (5.4%) | 55 (9.6%) |
| $500,000 to $749,999 | 40 (14.3%) | 0 (0.0%) |
| $750,000 to $999,999 | 0 (0.0%) | 0 (0.0%) |
| $1,000,000 or more | 0 (0.0%) | 0 (0.0%) |
| Total | 280 (100.0%) | 574 (100.0%) |
Household Income by Mortgage Status in Bohners Lake
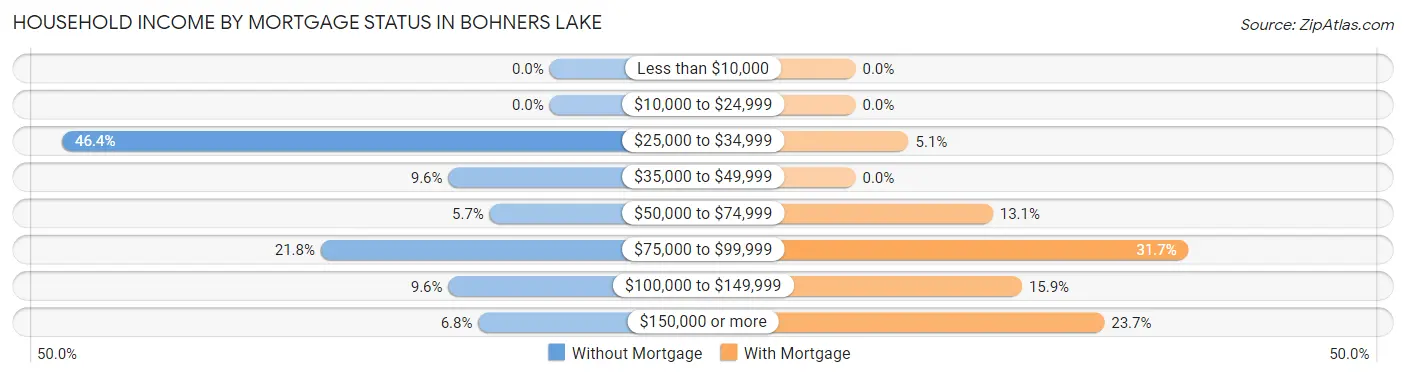
| Household Income | Without Mortgage | With Mortgage |
| Less than $10,000 | 0 (0.0%) | 0 (0.0%) |
| $10,000 to $24,999 | 0 (0.0%) | 0 (0.0%) |
| $25,000 to $34,999 | 130 (46.4%) | 29 (5.1%) |
| $35,000 to $49,999 | 27 (9.6%) | 0 (0.0%) |
| $50,000 to $74,999 | 16 (5.7%) | 75 (13.1%) |
| $75,000 to $99,999 | 61 (21.8%) | 182 (31.7%) |
| $100,000 to $149,999 | 27 (9.6%) | 91 (15.9%) |
| $150,000 or more | 19 (6.8%) | 136 (23.7%) |
| Total | 280 (100.0%) | 574 (100.0%) |
Property Value to Household Income Ratio in Bohners Lake
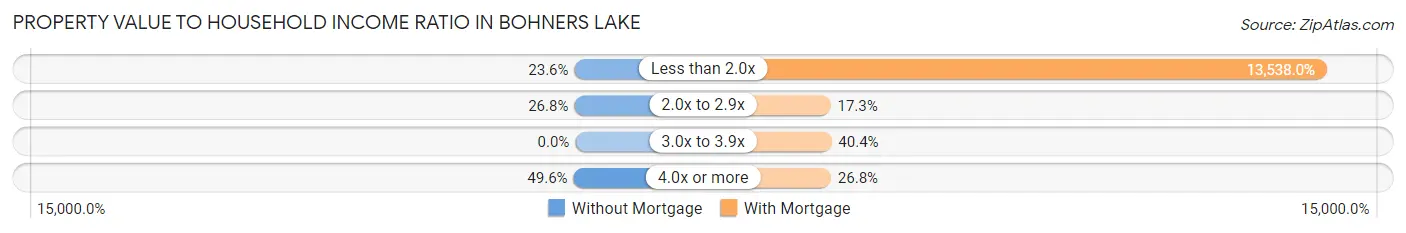
| Value-to-Income Ratio | Without Mortgage | With Mortgage |
| Less than 2.0x | 66 (23.6%) | 77,708 (13,538.0%) |
| 2.0x to 2.9x | 75 (26.8%) | 99 (17.2%) |
| 3.0x to 3.9x | 0 (0.0%) | 232 (40.4%) |
| 4.0x or more | 139 (49.6%) | 154 (26.8%) |
| Total | 280 (100.0%) | 574 (100.0%) |
Real Estate Taxes by Mortgage Status in Bohners Lake
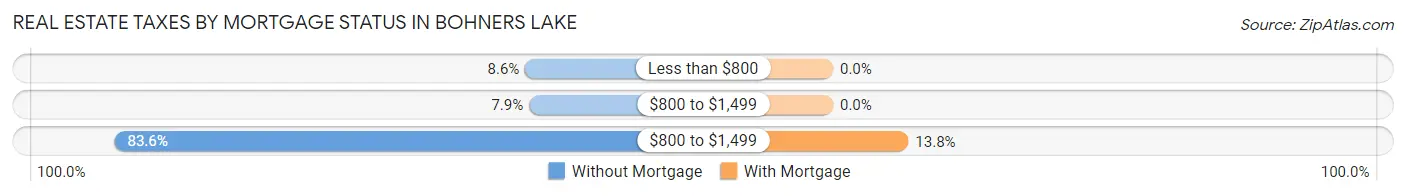
| Property Taxes | Without Mortgage | With Mortgage |
| Less than $800 | 24 (8.6%) | 0 (0.0%) |
| $800 to $1,499 | 22 (7.9%) | 0 (0.0%) |
| $800 to $1,499 | 234 (83.6%) | 79 (13.8%) |
| Total | 280 (100.0%) | 574 (100.0%) |
Health & Disability in Bohners Lake
Health Insurance Coverage by Age in Bohners Lake
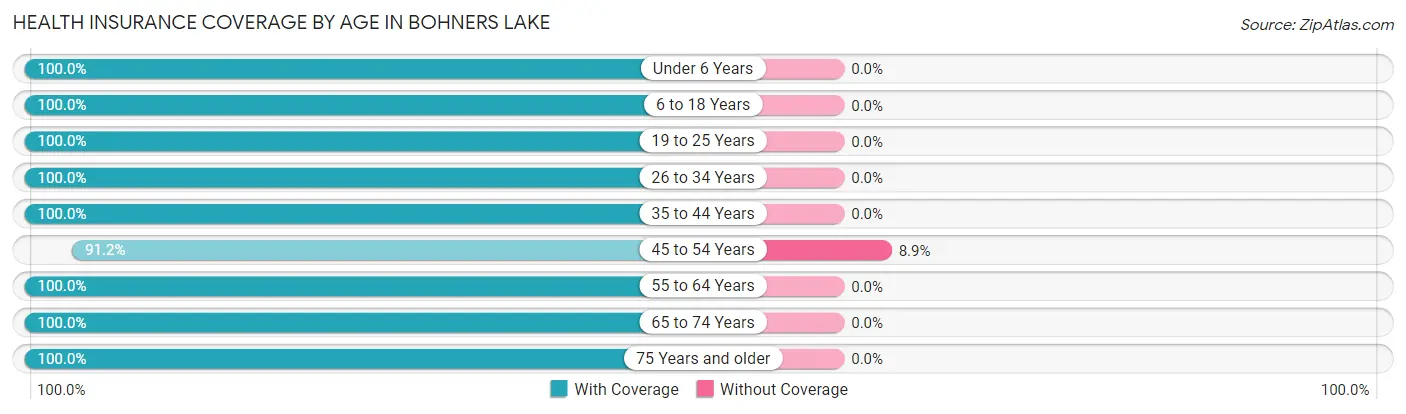
| Age Bracket | With Coverage | Without Coverage |
| Under 6 Years | 184 (100.0%) | 0 (0.0%) |
| 6 to 18 Years | 478 (100.0%) | 0 (0.0%) |
| 19 to 25 Years | 170 (100.0%) | 0 (0.0%) |
| 26 to 34 Years | 180 (100.0%) | 0 (0.0%) |
| 35 to 44 Years | 309 (100.0%) | 0 (0.0%) |
| 45 to 54 Years | 340 (91.1%) | 33 (8.8%) |
| 55 to 64 Years | 376 (100.0%) | 0 (0.0%) |
| 65 to 74 Years | 172 (100.0%) | 0 (0.0%) |
| 75 Years and older | 124 (100.0%) | 0 (0.0%) |
| Total | 2,333 (98.6%) | 33 (1.4%) |
Health Insurance Coverage by Citizenship Status in Bohners Lake
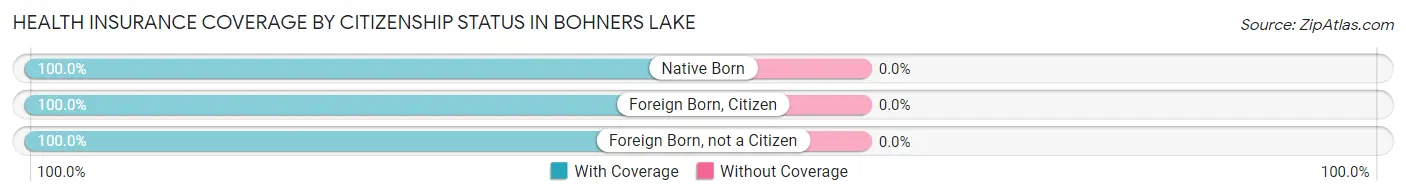
| Citizenship Status | With Coverage | Without Coverage |
| Native Born | 184 (100.0%) | 0 (0.0%) |
| Foreign Born, Citizen | 478 (100.0%) | 0 (0.0%) |
| Foreign Born, not a Citizen | 170 (100.0%) | 0 (0.0%) |
Health Insurance Coverage by Household Income in Bohners Lake
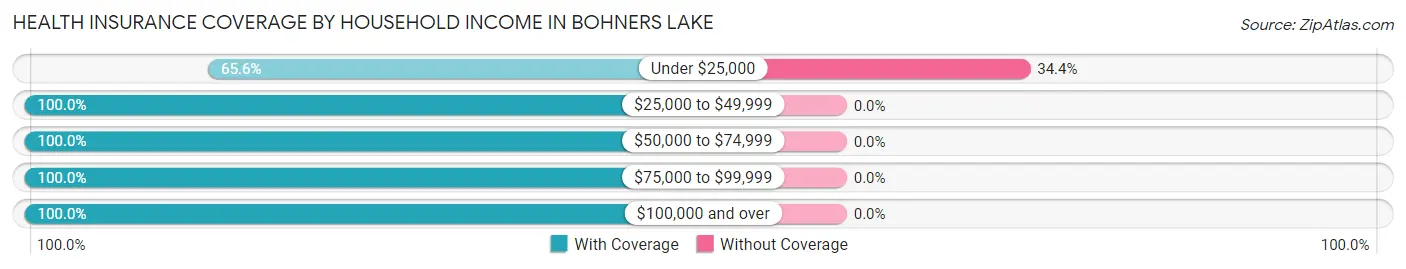
| Household Income | With Coverage | Without Coverage |
| Under $25,000 | 63 (65.6%) | 33 (34.4%) |
| $25,000 to $49,999 | 384 (100.0%) | 0 (0.0%) |
| $50,000 to $74,999 | 588 (100.0%) | 0 (0.0%) |
| $75,000 to $99,999 | 494 (100.0%) | 0 (0.0%) |
| $100,000 and over | 801 (100.0%) | 0 (0.0%) |
Public vs Private Health Insurance Coverage by Age in Bohners Lake
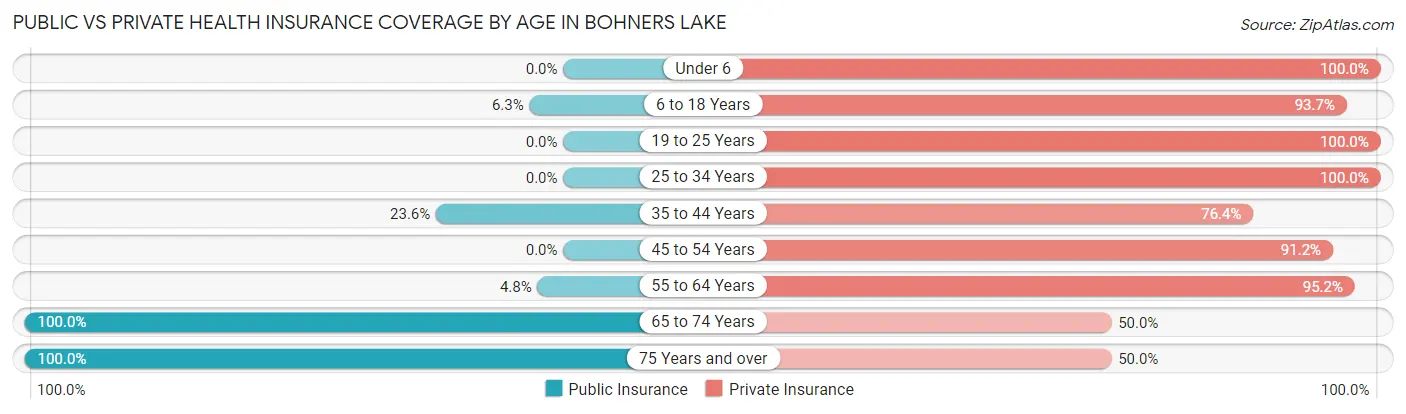
| Age Bracket | Public Insurance | Private Insurance |
| Under 6 | 0 (0.0%) | 184 (100.0%) |
| 6 to 18 Years | 30 (6.3%) | 448 (93.7%) |
| 19 to 25 Years | 0 (0.0%) | 170 (100.0%) |
| 25 to 34 Years | 0 (0.0%) | 180 (100.0%) |
| 35 to 44 Years | 73 (23.6%) | 236 (76.4%) |
| 45 to 54 Years | 0 (0.0%) | 340 (91.1%) |
| 55 to 64 Years | 18 (4.8%) | 358 (95.2%) |
| 65 to 74 Years | 172 (100.0%) | 86 (50.0%) |
| 75 Years and over | 124 (100.0%) | 62 (50.0%) |
| Total | 417 (17.6%) | 2,064 (87.2%) |
Disability Status by Sex by Age in Bohners Lake
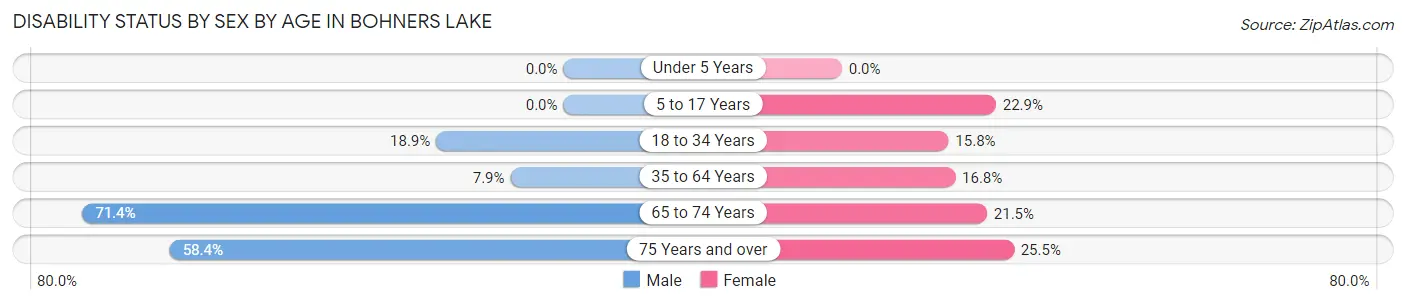
| Age Bracket | Male | Female |
| Under 5 Years | 0 (0.0%) | 0 (0.0%) |
| 5 to 17 Years | 0 (0.0%) | 51 (22.9%) |
| 18 to 34 Years | 58 (18.9%) | 19 (15.8%) |
| 35 to 64 Years | 44 (7.9%) | 84 (16.8%) |
| 65 to 74 Years | 30 (71.4%) | 28 (21.5%) |
| 75 Years and over | 45 (58.4%) | 12 (25.5%) |
Disability Class by Sex by Age in Bohners Lake
Disability Class: Hearing Difficulty
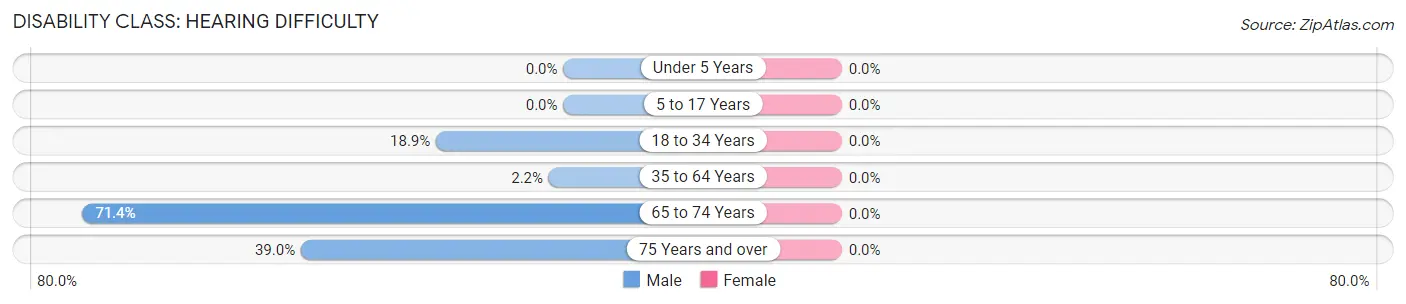
| Age Bracket | Male | Female |
| Under 5 Years | 0 (0.0%) | 0 (0.0%) |
| 5 to 17 Years | 0 (0.0%) | 0 (0.0%) |
| 18 to 34 Years | 58 (18.9%) | 0 (0.0%) |
| 35 to 64 Years | 12 (2.1%) | 0 (0.0%) |
| 65 to 74 Years | 30 (71.4%) | 0 (0.0%) |
| 75 Years and over | 30 (39.0%) | 0 (0.0%) |
Disability Class: Vision Difficulty
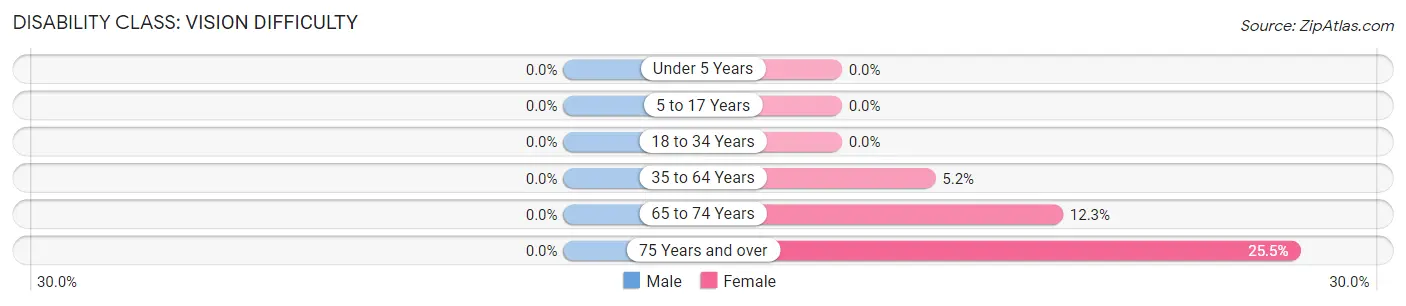
| Age Bracket | Male | Female |
| Under 5 Years | 0 (0.0%) | 0 (0.0%) |
| 5 to 17 Years | 0 (0.0%) | 0 (0.0%) |
| 18 to 34 Years | 0 (0.0%) | 0 (0.0%) |
| 35 to 64 Years | 0 (0.0%) | 26 (5.2%) |
| 65 to 74 Years | 0 (0.0%) | 16 (12.3%) |
| 75 Years and over | 0 (0.0%) | 12 (25.5%) |
Disability Class: Cognitive Difficulty
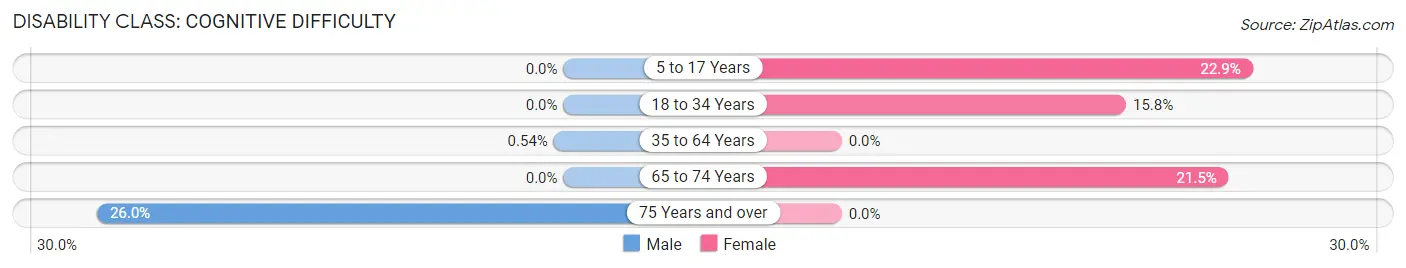
| Age Bracket | Male | Female |
| 5 to 17 Years | 0 (0.0%) | 51 (22.9%) |
| 18 to 34 Years | 0 (0.0%) | 19 (15.8%) |
| 35 to 64 Years | 3 (0.5%) | 0 (0.0%) |
| 65 to 74 Years | 0 (0.0%) | 28 (21.5%) |
| 75 Years and over | 20 (26.0%) | 0 (0.0%) |
Disability Class: Ambulatory Difficulty
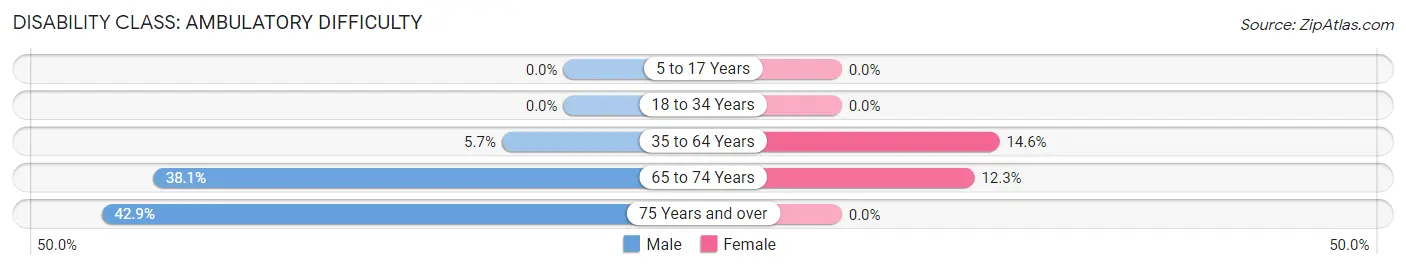
| Age Bracket | Male | Female |
| 5 to 17 Years | 0 (0.0%) | 0 (0.0%) |
| 18 to 34 Years | 0 (0.0%) | 0 (0.0%) |
| 35 to 64 Years | 32 (5.7%) | 73 (14.6%) |
| 65 to 74 Years | 16 (38.1%) | 16 (12.3%) |
| 75 Years and over | 33 (42.9%) | 0 (0.0%) |
Disability Class: Self-Care Difficulty
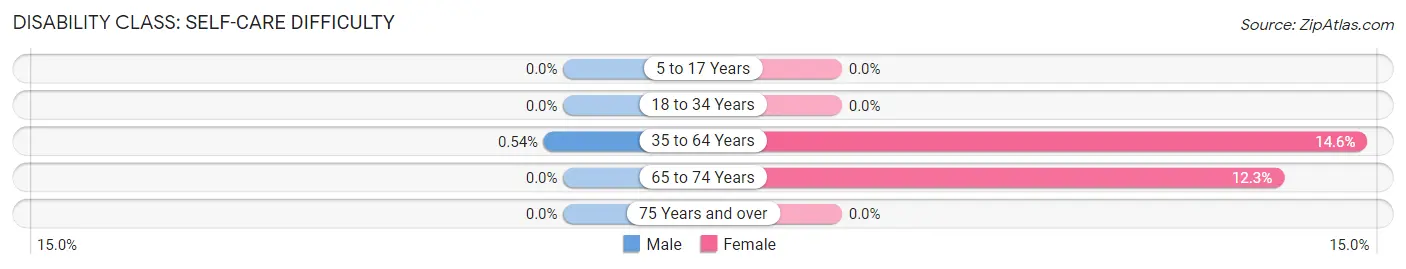
| Age Bracket | Male | Female |
| 5 to 17 Years | 0 (0.0%) | 0 (0.0%) |
| 18 to 34 Years | 0 (0.0%) | 0 (0.0%) |
| 35 to 64 Years | 3 (0.5%) | 73 (14.6%) |
| 65 to 74 Years | 0 (0.0%) | 16 (12.3%) |
| 75 Years and over | 0 (0.0%) | 0 (0.0%) |
Technology Access in Bohners Lake
Computing Device Access in Bohners Lake
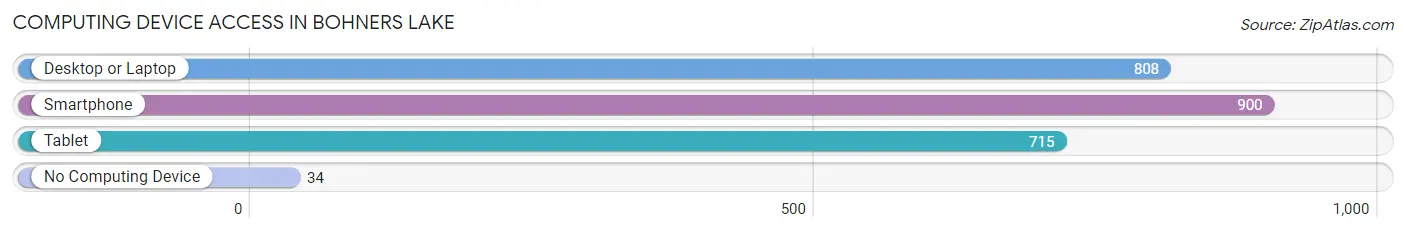
| Device Type | # Households | % Households |
| Desktop or Laptop | 808 | 80.8% |
| Smartphone | 900 | 90.0% |
| Tablet | 715 | 71.5% |
| No Computing Device | 34 | 3.4% |
| Total | 1,000 | 100.0% |
Internet Access in Bohners Lake
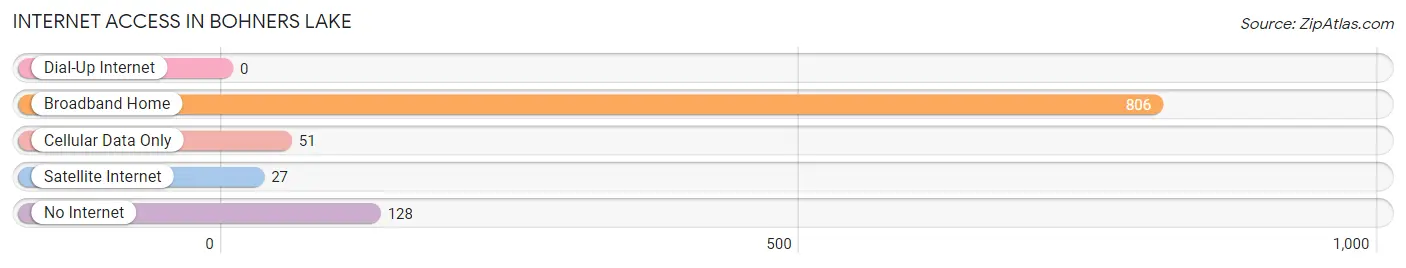
| Internet Type | # Households | % Households |
| Dial-Up Internet | 0 | 0.0% |
| Broadband Home | 806 | 80.6% |
| Cellular Data Only | 51 | 5.1% |
| Satellite Internet | 27 | 2.7% |
| No Internet | 128 | 12.8% |
| Total | 1,000 | 100.0% |
Bohners Lake Summary
Bohners Lake is a small unincorporated community located in Racine County, Wisconsin, United States. It is situated on the western shore of Bohners Lake, a natural lake of approximately 200 acres. The lake is a popular recreational destination for fishing, swimming, and boating.
History
The area around Bohners Lake was first settled in the early 1800s by German immigrants. The lake was named after one of the first settlers, John Bohners, who arrived in the area in 1845. Bohners Lake was originally known as Bohners Pond, and the surrounding area was known as Bohnersville.
In the late 1800s, the area around Bohners Lake began to develop as a resort destination. Several hotels and resorts were built on the lake, and the area became a popular destination for fishing, swimming, and boating.
In the early 1900s, the area around Bohners Lake began to be developed for residential use. The first homes were built in the 1920s, and the area has since grown to include several neighborhoods.
Geography
Bohners Lake is located in Racine County, Wisconsin, approximately 25 miles south of Milwaukee. The lake is situated on the western shore of Bohners Lake, a natural lake of approximately 200 acres. The lake is surrounded by wooded hills and is fed by several small streams.
The lake is a popular recreational destination for fishing, swimming, and boating. There are several public boat launches located around the lake, as well as several private marinas. The lake is also home to several species of fish, including largemouth bass, northern pike, walleye, and panfish.
Economy
The economy of Bohners Lake is largely based on tourism and recreation. The lake is a popular destination for fishing, swimming, and boating, and the area is home to several resorts and hotels.
The area is also home to several small businesses, including restaurants, convenience stores, and gas stations. The local economy is also supported by several small manufacturing companies.
Demographics
As of the 2010 census, the population of Bohners Lake was 1,845. The racial makeup of the town was 97.3% White, 0.7% African American, 0.3% Native American, 0.3% Asian, 0.2% from other races, and 1.2% from two or more races. Hispanic or Latino of any race were 1.2% of the population.
The median household income in Bohners Lake was $50,938, and the median family income was $60,938. The per capita income for the town was $25,938. About 4.3% of families and 5.7% of the population were below the poverty line, including 8.3% of those under age 18 and 4.3% of those age 65 or over.
Common Questions
What is Per Capita Income in Bohners Lake?
Per Capita income in Bohners Lake is $33,925.
What is the Median Family Income in Bohners Lake?
Median Family Income in Bohners Lake is $83,986.
What is the Median Household income in Bohners Lake?
Median Household Income in Bohners Lake is $74,041.
What is Income or Wage Gap in Bohners Lake?
Income or Wage Gap in Bohners Lake is 52.8%.
Women in Bohners Lake earn 47.2 cents for every dollar earned by a man.
What is Inequality or Gini Index in Bohners Lake?
Inequality or Gini Index in Bohners Lake is 0.29.
What is the Total Population of Bohners Lake?
Total Population of Bohners Lake is 2,415.
What is the Total Male Population of Bohners Lake?
Total Male Population of Bohners Lake is 1,360.
What is the Total Female Population of Bohners Lake?
Total Female Population of Bohners Lake is 1,055.
What is the Ratio of Males per 100 Females in Bohners Lake?
There are 128.91 Males per 100 Females in Bohners Lake.
What is the Ratio of Females per 100 Males in Bohners Lake?
There are 77.57 Females per 100 Males in Bohners Lake.
What is the Median Population Age in Bohners Lake?
Median Population Age in Bohners Lake is 39.6 Years.
What is the Average Family Size in Bohners Lake
Average Family Size in Bohners Lake is 3.0 People.
What is the Average Household Size in Bohners Lake
Average Household Size in Bohners Lake is 2.4 People.
How Large is the Labor Force in Bohners Lake?
There are 1,242 People in the Labor Forcein in Bohners Lake.
What is the Percentage of People in the Labor Force in Bohners Lake?
64.1% of People are in the Labor Force in Bohners Lake.
What is the Unemployment Rate in Bohners Lake?
Unemployment Rate in Bohners Lake is 7.7%.