Marshall, WI Map & Demographics
Marshall Map
Marshall Overview
$31,924
PER CAPITA INCOME
$81,667
AVG FAMILY INCOME
$79,308
AVG HOUSEHOLD INCOME
10.6%
WAGE / INCOME GAP [ % ]
89.4¢/ $1
WAGE / INCOME GAP [ $ ]
0.37
INEQUALITY / GINI INDEX
3,818
TOTAL POPULATION
1,937
MALE POPULATION
1,881
FEMALE POPULATION
102.98
MALES / 100 FEMALES
97.11
FEMALES / 100 MALES
36.0
MEDIAN AGE
2.9
AVG FAMILY SIZE
2.5
AVG HOUSEHOLD SIZE
2,484
LABOR FORCE [ PEOPLE ]
80.9%
PERCENT IN LABOR FORCE
3.9%
UNEMPLOYMENT RATE
Marshall Zip Codes
Marshall Area Codes
Income in Marshall
Income Overview in Marshall
Per Capita Income in Marshall is $31,924, while median incomes of families and households are $81,667 and $79,308 respectively.
| Characteristic | Number | Measure |
| Per Capita Income | 3,818 | $31,924 |
| Median Family Income | 1,042 | $81,667 |
| Mean Family Income | 1,042 | $80,191 |
| Median Household Income | 1,495 | $79,308 |
| Mean Household Income | 1,495 | $79,567 |
| Income Deficit | 1,042 | $0 |
| Wage / Income Gap (%) | 3,818 | 10.57% |
| Wage / Income Gap ($) | 3,818 | 89.43¢ per $1 |
| Gini / Inequality Index | 3,818 | 0.37 |
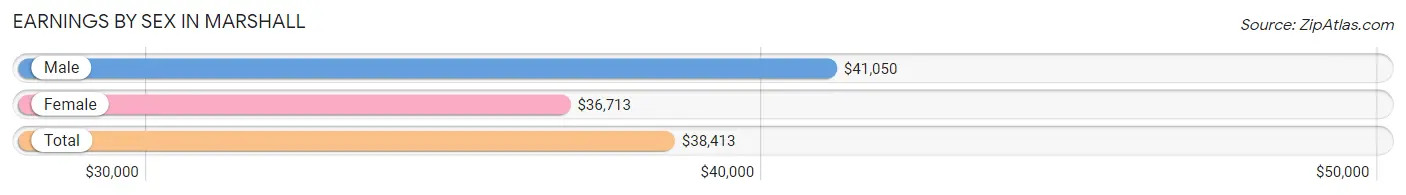
Earnings by Sex in Marshall
Average Earnings in Marshall are $38,413, $41,050 for men and $36,713 for women, a difference of 10.6%.
| Sex | Number | Average Earnings |
| Male | 1,318 (51.0%) | $41,050 |
| Female | 1,268 (49.0%) | $36,713 |
| Total | 2,586 (100.0%) | $38,413 |
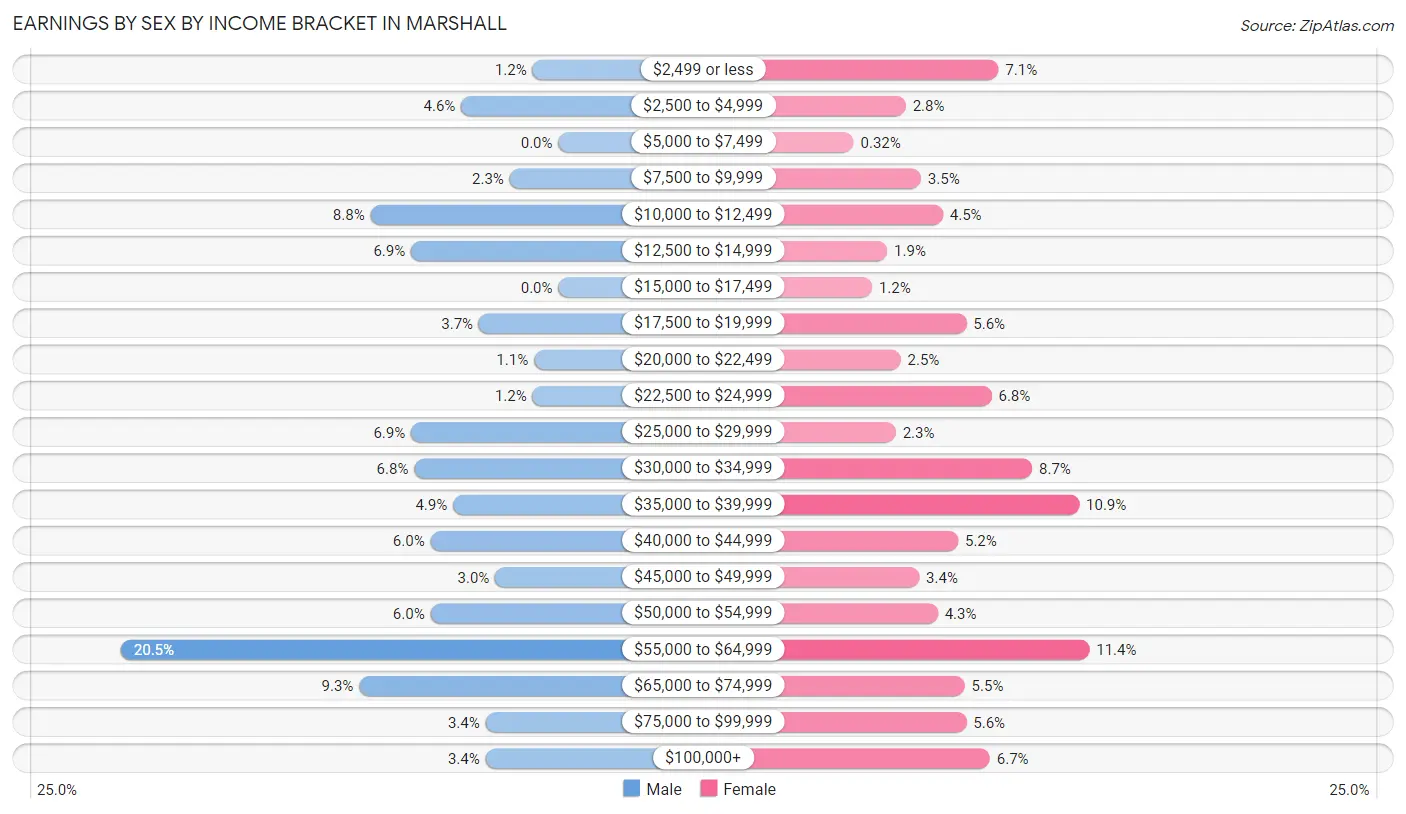
Earnings by Sex by Income Bracket in Marshall
The most common earnings brackets in Marshall are $55,000 to $64,999 for men (270 | 20.5%) and $55,000 to $64,999 for women (144 | 11.4%).
| Income | Male | Female |
| $2,499 or less | 16 (1.2%) | 90 (7.1%) |
| $2,500 to $4,999 | 60 (4.5%) | 35 (2.8%) |
| $5,000 to $7,499 | 0 (0.0%) | 4 (0.3%) |
| $7,500 to $9,999 | 30 (2.3%) | 44 (3.5%) |
| $10,000 to $12,499 | 116 (8.8%) | 57 (4.5%) |
| $12,500 to $14,999 | 91 (6.9%) | 24 (1.9%) |
| $15,000 to $17,499 | 0 (0.0%) | 15 (1.2%) |
| $17,500 to $19,999 | 49 (3.7%) | 71 (5.6%) |
| $20,000 to $22,499 | 15 (1.1%) | 32 (2.5%) |
| $22,500 to $24,999 | 16 (1.2%) | 86 (6.8%) |
| $25,000 to $29,999 | 91 (6.9%) | 29 (2.3%) |
| $30,000 to $34,999 | 89 (6.8%) | 110 (8.7%) |
| $35,000 to $39,999 | 65 (4.9%) | 138 (10.9%) |
| $40,000 to $44,999 | 79 (6.0%) | 66 (5.2%) |
| $45,000 to $49,999 | 39 (3.0%) | 43 (3.4%) |
| $50,000 to $54,999 | 79 (6.0%) | 54 (4.3%) |
| $55,000 to $64,999 | 270 (20.5%) | 144 (11.4%) |
| $65,000 to $74,999 | 123 (9.3%) | 70 (5.5%) |
| $75,000 to $99,999 | 45 (3.4%) | 71 (5.6%) |
| $100,000+ | 45 (3.4%) | 85 (6.7%) |
| Total | 1,318 (100.0%) | 1,268 (100.0%) |
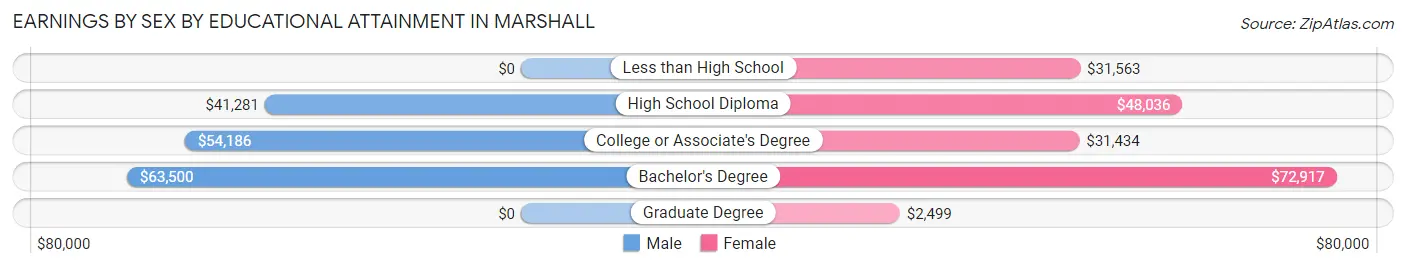
Earnings by Sex by Educational Attainment in Marshall
Average earnings in Marshall are $51,094 for men and $37,014 for women, a difference of 27.6%. Men with an educational attainment of bachelor's degree enjoy the highest average annual earnings of $63,500, while those with high school diploma education earn the least with $41,281. Women with an educational attainment of bachelor's degree earn the most with the average annual earnings of $72,917, while those with graduate degree education have the smallest earnings of $2,499.
| Educational Attainment | Male Income | Female Income |
| Less than High School | - | - |
| High School Diploma | $41,281 | $48,036 |
| College or Associate's Degree | $54,186 | $31,434 |
| Bachelor's Degree | $63,500 | $72,917 |
| Graduate Degree | - | - |
| Total | $51,094 | $37,014 |
Family Income in Marshall
Family Income Brackets in Marshall
According to the Marshall family income data, there are 316 families falling into the $100,000 to $149,999 income range, which is the most common income bracket and makes up 30.3% of all families.
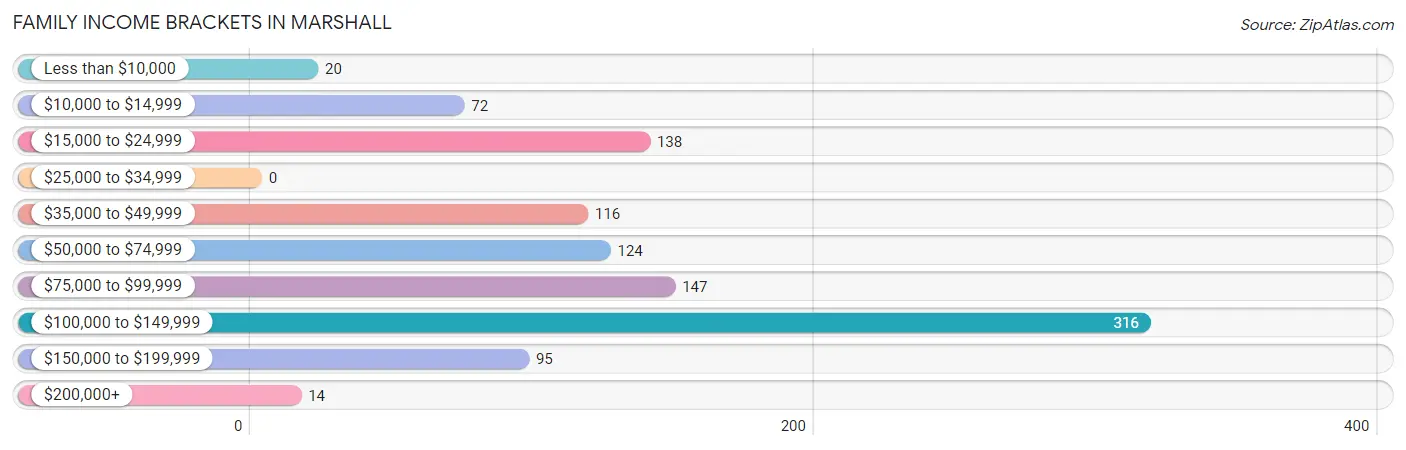
| Income Bracket | # Families | % Families |
| Less than $10,000 | 20 | 1.9% |
| $10,000 to $14,999 | 72 | 6.9% |
| $15,000 to $24,999 | 138 | 13.2% |
| $25,000 to $34,999 | 0 | 0.0% |
| $35,000 to $49,999 | 116 | 11.1% |
| $50,000 to $74,999 | 124 | 11.9% |
| $75,000 to $99,999 | 147 | 14.1% |
| $100,000 to $149,999 | 316 | 30.3% |
| $150,000 to $199,999 | 95 | 9.1% |
| $200,000+ | 14 | 1.3% |
Family Income by Famaliy Size in Marshall
4-person families (124 | 11.9%) account for the highest median family income in Marshall with $115,781 per family, while 2-person families (429 | 41.2%) have the highest median income of $40,875 per family member.
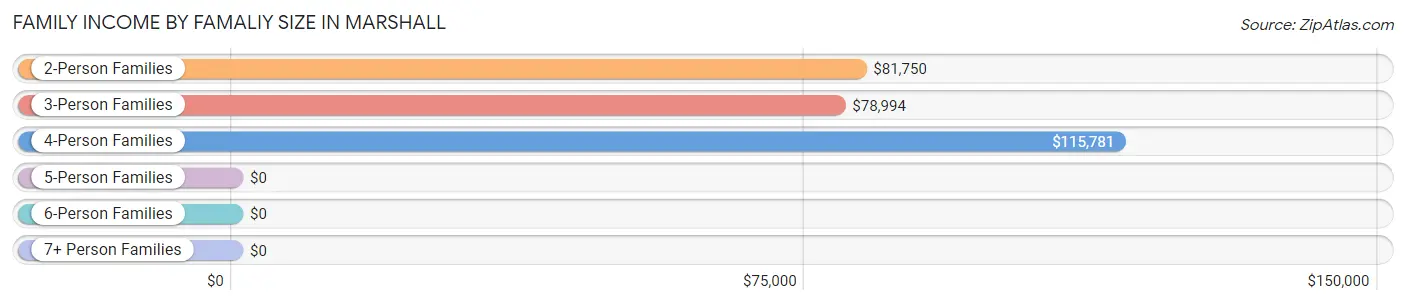
| Income Bracket | # Families | Median Income |
| 2-Person Families | 429 (41.2%) | $81,750 |
| 3-Person Families | 455 (43.7%) | $78,994 |
| 4-Person Families | 124 (11.9%) | $115,781 |
| 5-Person Families | 20 (1.9%) | $0 |
| 6-Person Families | 14 (1.3%) | $0 |
| 7+ Person Families | 0 (0.0%) | $0 |
| Total | 1,042 (100.0%) | $81,667 |
Family Income by Number of Earners in Marshall
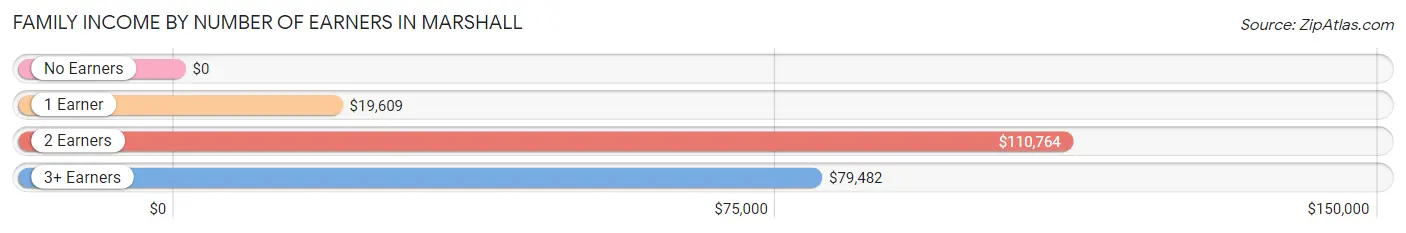
| Number of Earners | # Families | Median Income |
| No Earners | 48 (4.6%) | $0 |
| 1 Earner | 373 (35.8%) | $19,609 |
| 2 Earners | 490 (47.0%) | $110,764 |
| 3+ Earners | 131 (12.6%) | $79,482 |
| Total | 1,042 (100.0%) | $81,667 |
Household Income in Marshall
Household Income Brackets in Marshall
With 380 households falling in the category, the $100,000 to $149,999 income range is the most frequent in Marshall, accounting for 25.4% of all households. In contrast, only 25 households (1.7%) fall into the less than $10,000 income bracket, making it the least populous group.
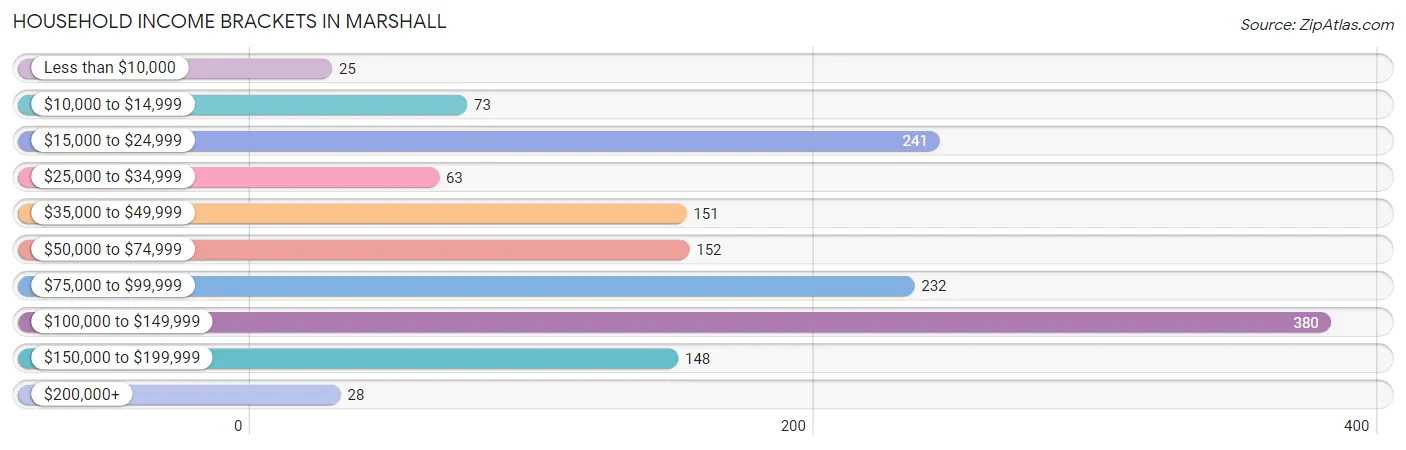
| Income Bracket | # Households | % Households |
| Less than $10,000 | 25 | 1.7% |
| $10,000 to $14,999 | 73 | 4.9% |
| $15,000 to $24,999 | 241 | 16.1% |
| $25,000 to $34,999 | 63 | 4.2% |
| $35,000 to $49,999 | 151 | 10.1% |
| $50,000 to $74,999 | 152 | 10.2% |
| $75,000 to $99,999 | 232 | 15.5% |
| $100,000 to $149,999 | 380 | 25.4% |
| $150,000 to $199,999 | 148 | 9.9% |
| $200,000+ | 28 | 1.9% |
Household Income by Householder Age in Marshall
The median household income in Marshall is $79,308, with the highest median household income of $97,174 found in the 25 to 44 years age bracket for the primary householder. A total of 616 households (41.2%) fall into this category. Meanwhile, the 15 to 24 years age bracket for the primary householder has the lowest median household income of $0, with 65 households (4.3%) in this group.
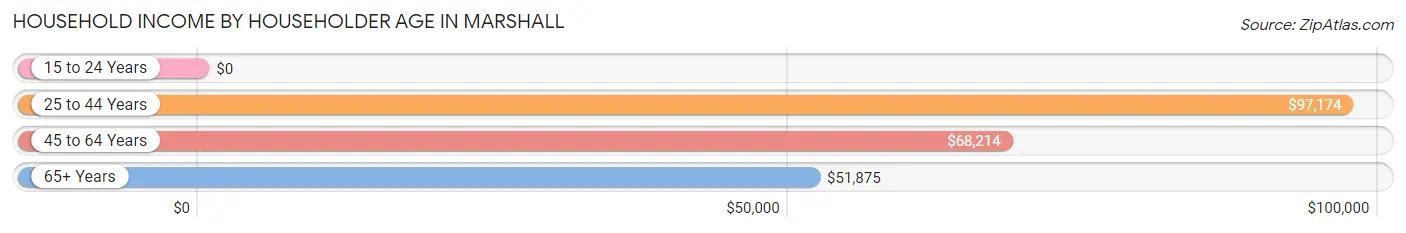
| Income Bracket | # Households | Median Income |
| 15 to 24 Years | 65 (4.3%) | $0 |
| 25 to 44 Years | 616 (41.2%) | $97,174 |
| 45 to 64 Years | 618 (41.3%) | $68,214 |
| 65+ Years | 196 (13.1%) | $51,875 |
| Total | 1,495 (100.0%) | $79,308 |
Poverty in Marshall
Income Below Poverty by Sex and Age in Marshall
With 9.0% poverty level for males and 17.6% for females among the residents of Marshall, 12 to 14 year old males and 6 to 11 year old females are the most vulnerable to poverty, with 54 males (77.1%) and 79 females (60.3%) in their respective age groups living below the poverty level.
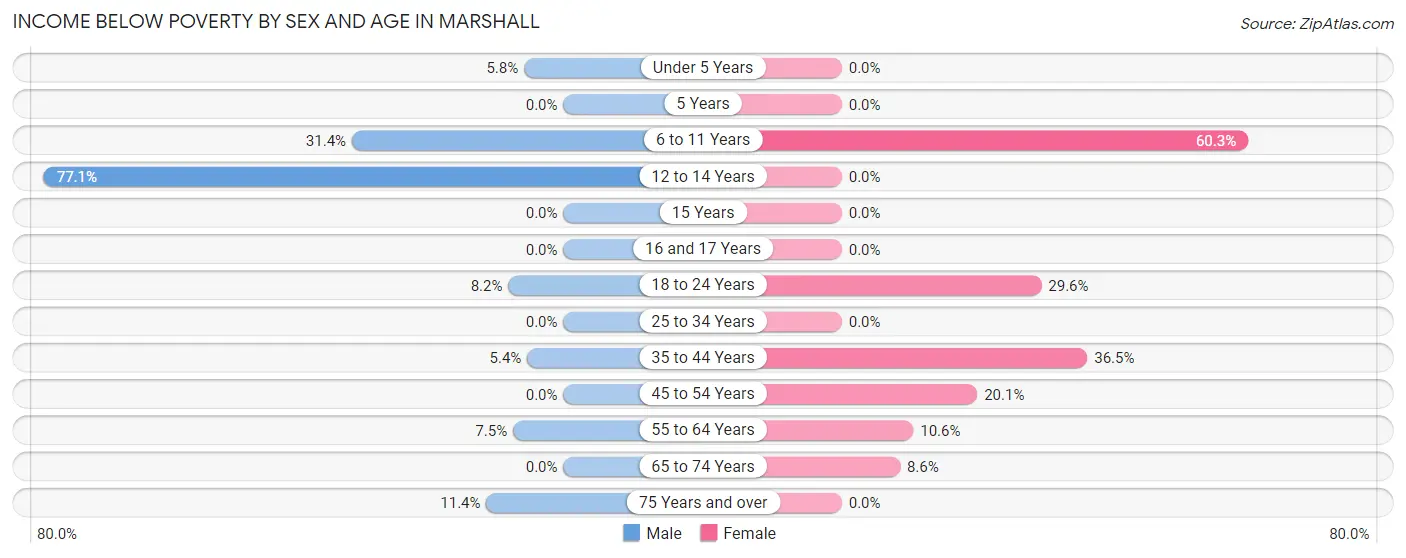
| Age Bracket | Male | Female |
| Under 5 Years | 12 (5.8%) | 0 (0.0%) |
| 5 Years | 0 (0.0%) | 0 (0.0%) |
| 6 to 11 Years | 54 (31.4%) | 79 (60.3%) |
| 12 to 14 Years | 54 (77.1%) | 0 (0.0%) |
| 15 Years | 0 (0.0%) | 0 (0.0%) |
| 16 and 17 Years | 0 (0.0%) | 0 (0.0%) |
| 18 to 24 Years | 17 (8.2%) | 32 (29.6%) |
| 25 to 34 Years | 0 (0.0%) | 0 (0.0%) |
| 35 to 44 Years | 16 (5.4%) | 101 (36.5%) |
| 45 to 54 Years | 0 (0.0%) | 74 (20.1%) |
| 55 to 64 Years | 16 (7.5%) | 29 (10.6%) |
| 65 to 74 Years | 0 (0.0%) | 14 (8.6%) |
| 75 Years and over | 4 (11.4%) | 0 (0.0%) |
| Total | 173 (9.0%) | 329 (17.6%) |
Income Above Poverty by Sex and Age in Marshall
According to the poverty statistics in Marshall, males aged 16 and 17 years and females aged under 5 years are the age groups that are most secure financially, with 100.0% of males and 100.0% of females in these age groups living above the poverty line.
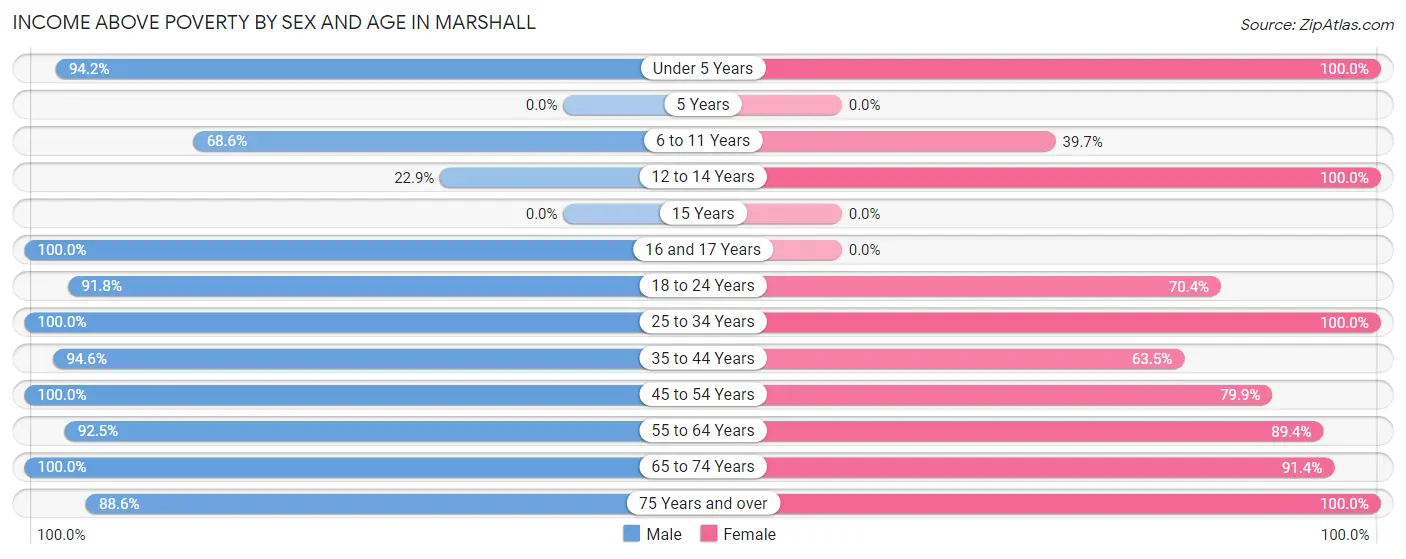
| Age Bracket | Male | Female |
| Under 5 Years | 194 (94.2%) | 111 (100.0%) |
| 5 Years | 0 (0.0%) | 0 (0.0%) |
| 6 to 11 Years | 118 (68.6%) | 52 (39.7%) |
| 12 to 14 Years | 16 (22.9%) | 58 (100.0%) |
| 15 Years | 0 (0.0%) | 0 (0.0%) |
| 16 and 17 Years | 35 (100.0%) | 0 (0.0%) |
| 18 to 24 Years | 191 (91.8%) | 76 (70.4%) |
| 25 to 34 Years | 363 (100.0%) | 347 (100.0%) |
| 35 to 44 Years | 282 (94.6%) | 176 (63.5%) |
| 45 to 54 Years | 220 (100.0%) | 294 (79.9%) |
| 55 to 64 Years | 198 (92.5%) | 244 (89.4%) |
| 65 to 74 Years | 105 (100.0%) | 148 (91.4%) |
| 75 Years and over | 31 (88.6%) | 34 (100.0%) |
| Total | 1,753 (91.0%) | 1,540 (82.4%) |
Income Below Poverty Among Married-Couple Families in Marshall
The poverty statistics for married-couple families in Marshall show that 9.2% or 72 of the total 781 families live below the poverty line. Families with no children have the highest poverty rate of 15.8%, comprising of 72 families. On the other hand, families with 1 or 2 children have the lowest poverty rate of 0.0%, which includes 0 families.
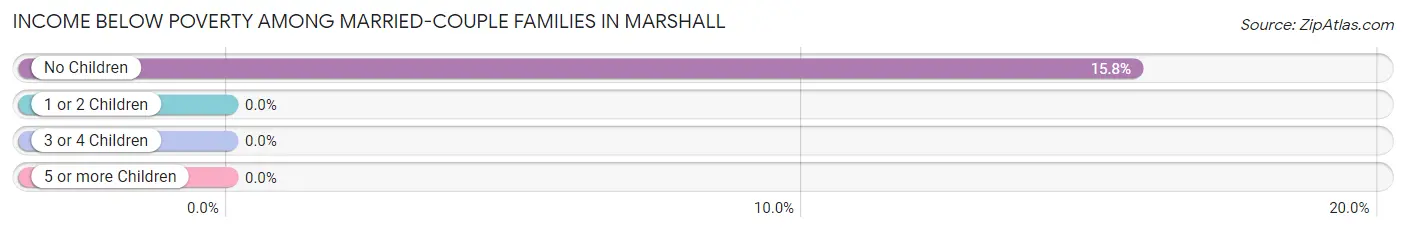
| Children | Above Poverty | Below Poverty |
| No Children | 385 (84.3%) | 72 (15.8%) |
| 1 or 2 Children | 304 (100.0%) | 0 (0.0%) |
| 3 or 4 Children | 20 (100.0%) | 0 (0.0%) |
| 5 or more Children | 0 (0.0%) | 0 (0.0%) |
| Total | 709 (90.8%) | 72 (9.2%) |
Income Below Poverty Among Single-Parent Households in Marshall
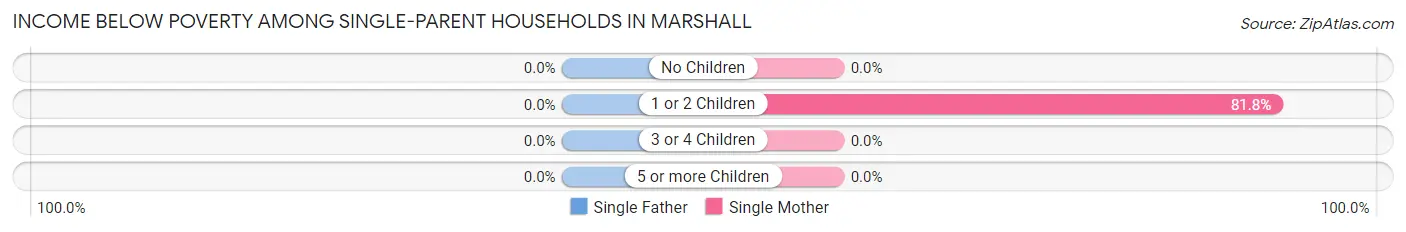
| Children | Single Father | Single Mother |
| No Children | 0 (0.0%) | 0 (0.0%) |
| 1 or 2 Children | 0 (0.0%) | 117 (81.8%) |
| 3 or 4 Children | 0 (0.0%) | 0 (0.0%) |
| 5 or more Children | 0 (0.0%) | 0 (0.0%) |
| Total | 0 (0.0%) | 117 (44.8%) |
Income Below Poverty Among Married-Couple vs Single-Parent Households in Marshall
The poverty data for Marshall shows that 72 of the married-couple family households (9.2%) and 117 of the single-parent households (44.8%) are living below the poverty level. Within the married-couple family households, those with no children have the highest poverty rate, with 72 households (15.8%) falling below the poverty line. Among the single-parent households, those with 1 or 2 children have the highest poverty rate, with 117 household (81.8%) living below poverty.
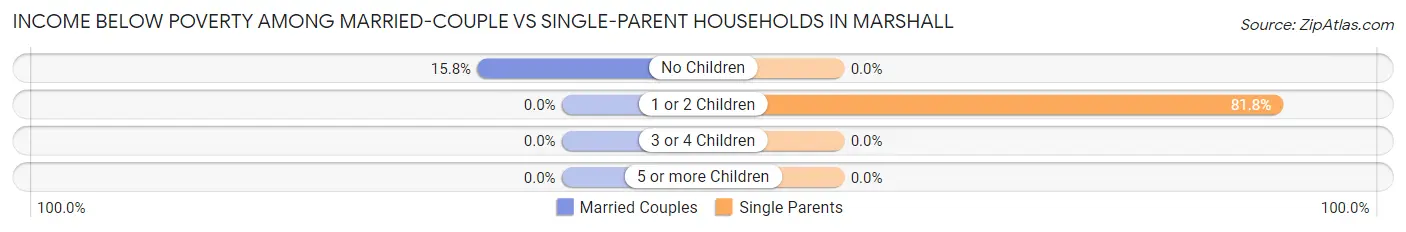
| Children | Married-Couple Families | Single-Parent Households |
| No Children | 72 (15.8%) | 0 (0.0%) |
| 1 or 2 Children | 0 (0.0%) | 117 (81.8%) |
| 3 or 4 Children | 0 (0.0%) | 0 (0.0%) |
| 5 or more Children | 0 (0.0%) | 0 (0.0%) |
| Total | 72 (9.2%) | 117 (44.8%) |
Race in Marshall
The most populous races in Marshall are White / Caucasian (3,232 | 84.7%), Hispanic or Latino (458 | 12.0%), and Asian (190 | 5.0%).
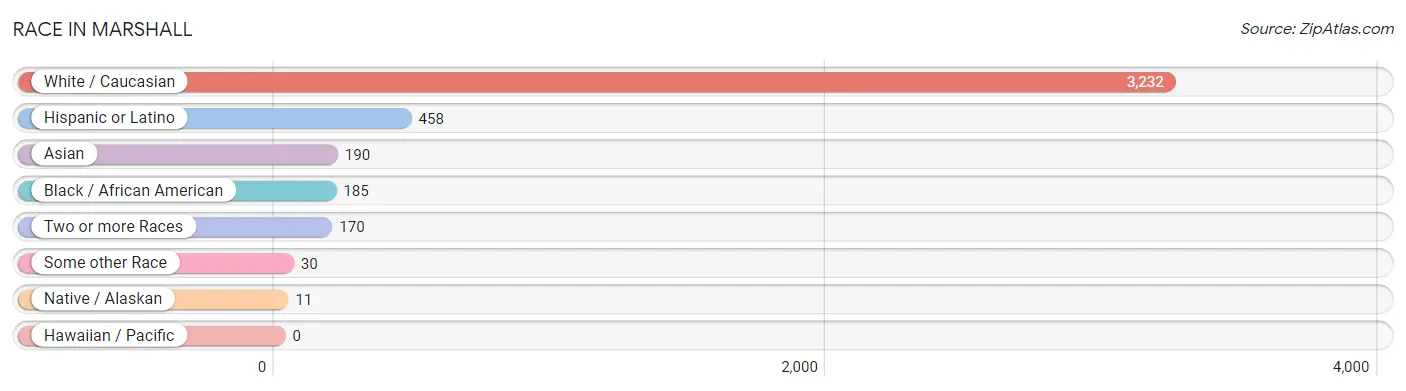
| Race | # Population | % Population |
| Asian | 190 | 5.0% |
| Black / African American | 185 | 4.9% |
| Hawaiian / Pacific | 0 | 0.0% |
| Hispanic or Latino | 458 | 12.0% |
| Native / Alaskan | 11 | 0.3% |
| White / Caucasian | 3,232 | 84.7% |
| Two or more Races | 170 | 4.4% |
| Some other Race | 30 | 0.8% |
| Total | 3,818 | 100.0% |
Ancestry in Marshall
The most populous ancestries reported in Marshall are German (1,394 | 36.5%), Irish (669 | 17.5%), Norwegian (447 | 11.7%), American (183 | 4.8%), and Mexican (174 | 4.6%), together accounting for 75.1% of all Marshall residents.
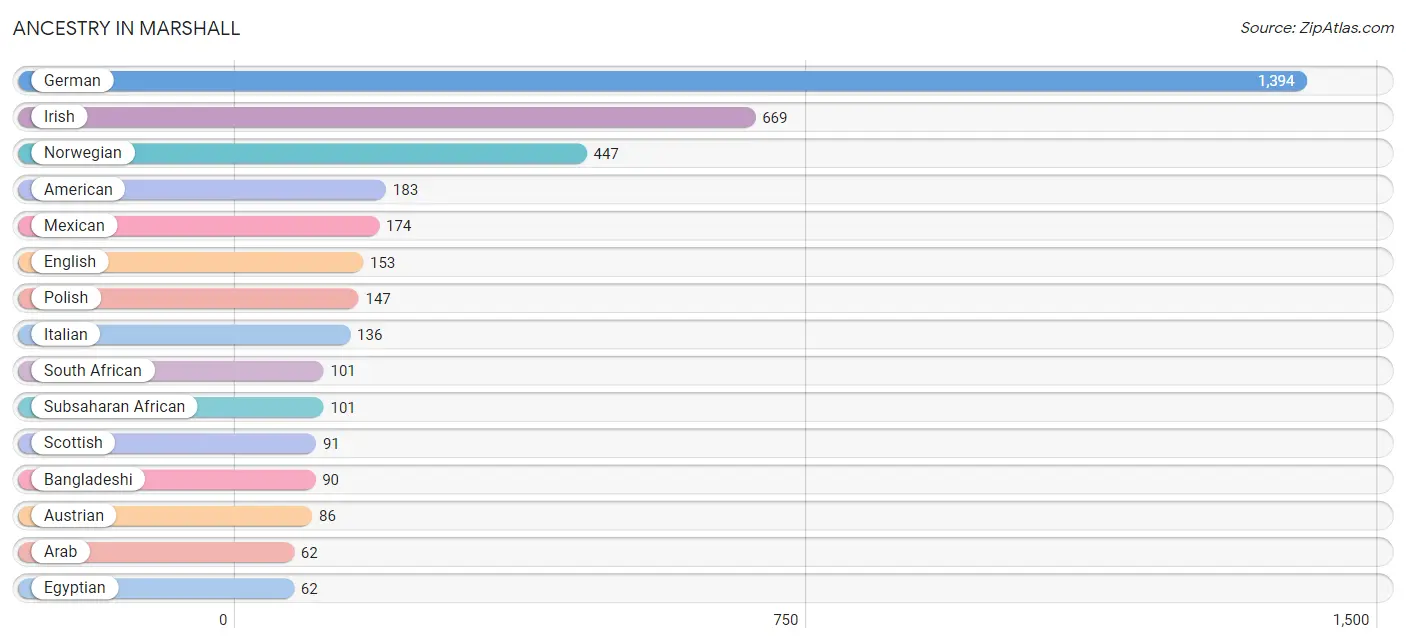
| Ancestry | # Population | % Population |
| American | 183 | 4.8% |
| Arab | 62 | 1.6% |
| Austrian | 86 | 2.2% |
| Bangladeshi | 90 | 2.4% |
| Belgian | 18 | 0.5% |
| Burmese | 13 | 0.3% |
| Dutch | 30 | 0.8% |
| Egyptian | 62 | 1.6% |
| English | 153 | 4.0% |
| Finnish | 14 | 0.4% |
| French | 33 | 0.9% |
| French Canadian | 42 | 1.1% |
| German | 1,394 | 36.5% |
| Irish | 669 | 17.5% |
| Italian | 136 | 3.6% |
| Malaysian | 14 | 0.4% |
| Mexican | 174 | 4.6% |
| Northern European | 28 | 0.7% |
| Norwegian | 447 | 11.7% |
| Polish | 147 | 3.8% |
| Puerto Rican | 12 | 0.3% |
| Russian | 30 | 0.8% |
| Scotch-Irish | 61 | 1.6% |
| Scottish | 91 | 2.4% |
| Slovak | 15 | 0.4% |
| South African | 101 | 2.6% |
| Sri Lankan | 27 | 0.7% |
| Subsaharan African | 101 | 2.6% |
| Swedish | 49 | 1.3% | View All 29 Rows |
Immigrants in Marshall
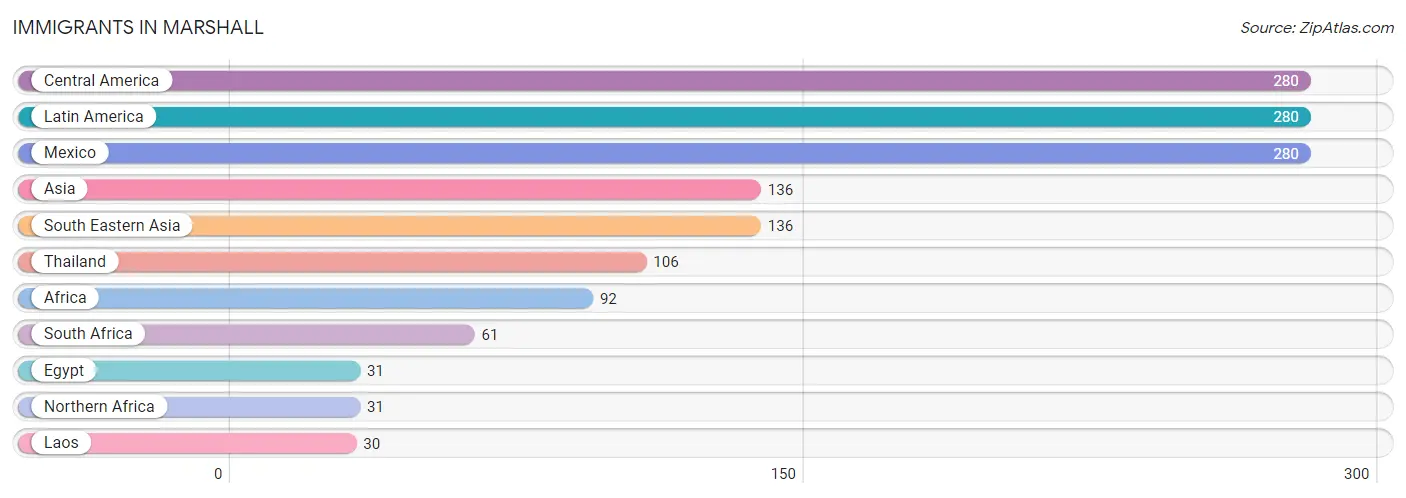
The most numerous immigrant groups reported in Marshall came from Central America (280 | 7.3%), Latin America (280 | 7.3%), Mexico (280 | 7.3%), Asia (136 | 3.6%), and South Eastern Asia (136 | 3.6%), together accounting for 29.1% of all Marshall residents.
| Immigration Origin | # Population | % Population |
| Africa | 92 | 2.4% |
| Asia | 136 | 3.6% |
| Central America | 280 | 7.3% |
| Egypt | 31 | 0.8% |
| Laos | 30 | 0.8% |
| Latin America | 280 | 7.3% |
| Mexico | 280 | 7.3% |
| Northern Africa | 31 | 0.8% |
| South Africa | 61 | 1.6% |
| South Eastern Asia | 136 | 3.6% |
| Thailand | 106 | 2.8% | View All 11 Rows |
Sex and Age in Marshall
Sex and Age in Marshall
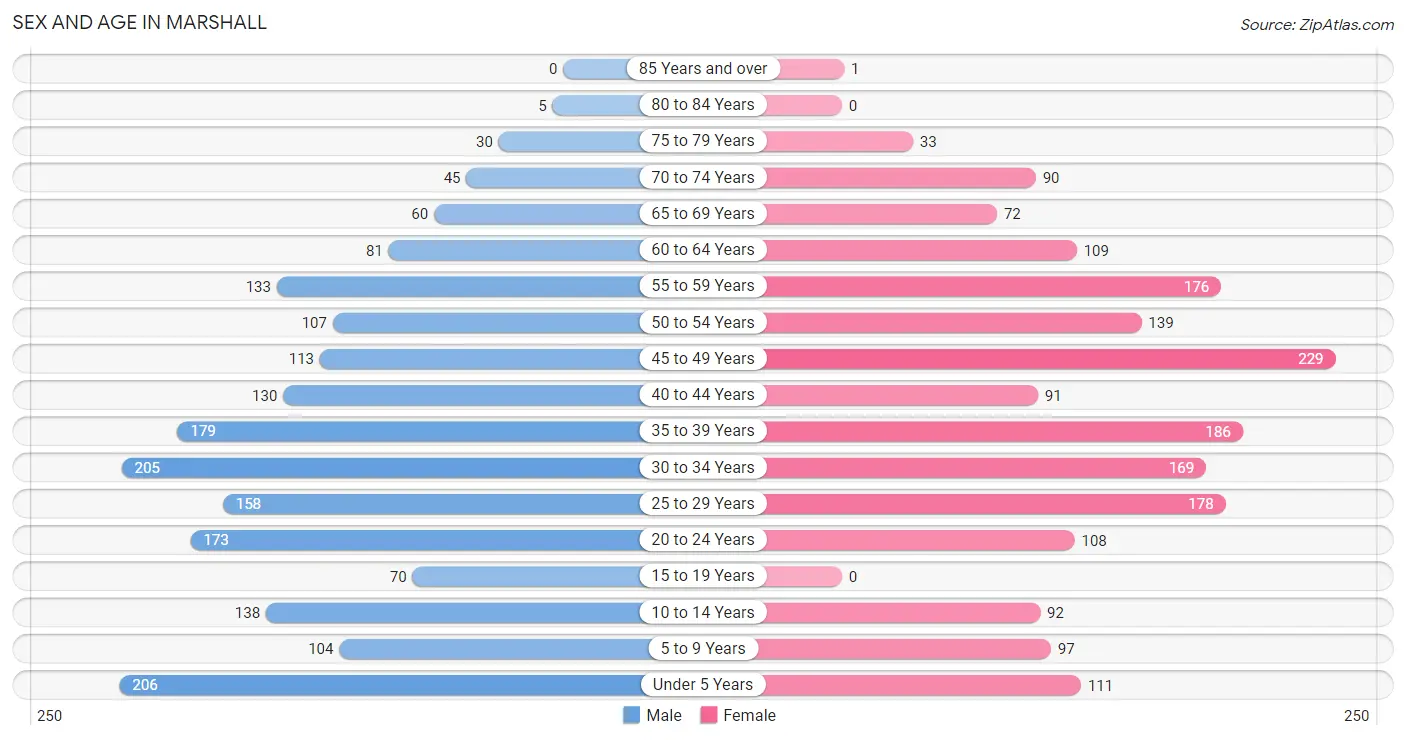
The most populous age groups in Marshall are Under 5 Years (206 | 10.6%) for men and 45 to 49 Years (229 | 12.2%) for women.
| Age Bracket | Male | Female |
| Under 5 Years | 206 (10.6%) | 111 (5.9%) |
| 5 to 9 Years | 104 (5.4%) | 97 (5.2%) |
| 10 to 14 Years | 138 (7.1%) | 92 (4.9%) |
| 15 to 19 Years | 70 (3.6%) | 0 (0.0%) |
| 20 to 24 Years | 173 (8.9%) | 108 (5.7%) |
| 25 to 29 Years | 158 (8.2%) | 178 (9.5%) |
| 30 to 34 Years | 205 (10.6%) | 169 (9.0%) |
| 35 to 39 Years | 179 (9.2%) | 186 (9.9%) |
| 40 to 44 Years | 130 (6.7%) | 91 (4.8%) |
| 45 to 49 Years | 113 (5.8%) | 229 (12.2%) |
| 50 to 54 Years | 107 (5.5%) | 139 (7.4%) |
| 55 to 59 Years | 133 (6.9%) | 176 (9.4%) |
| 60 to 64 Years | 81 (4.2%) | 109 (5.8%) |
| 65 to 69 Years | 60 (3.1%) | 72 (3.8%) |
| 70 to 74 Years | 45 (2.3%) | 90 (4.8%) |
| 75 to 79 Years | 30 (1.5%) | 33 (1.8%) |
| 80 to 84 Years | 5 (0.3%) | 0 (0.0%) |
| 85 Years and over | 0 (0.0%) | 1 (0.1%) |
| Total | 1,937 (100.0%) | 1,881 (100.0%) |
Families and Households in Marshall
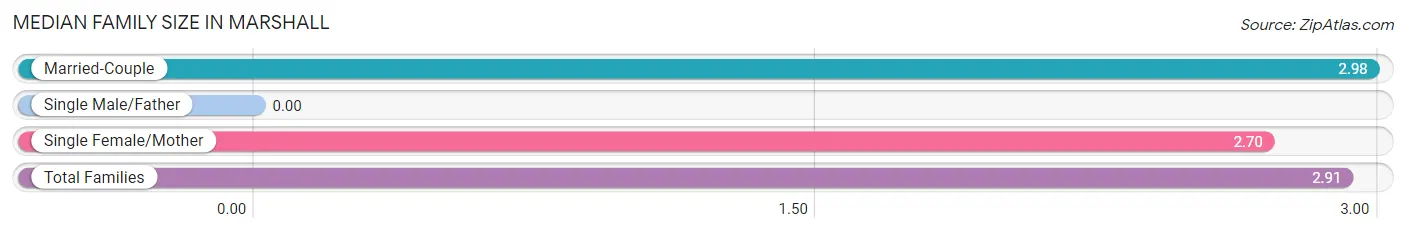
Median Family Size in Marshall
| Family Type | # Families | Family Size |
| Married-Couple | 781 (75.0%) | 2.98 |
| Single Male/Father | 0 (0.0%) | - |
| Single Female/Mother | 261 (25.1%) | 2.70 |
| Total Families | 1,042 (100.0%) | 2.91 |
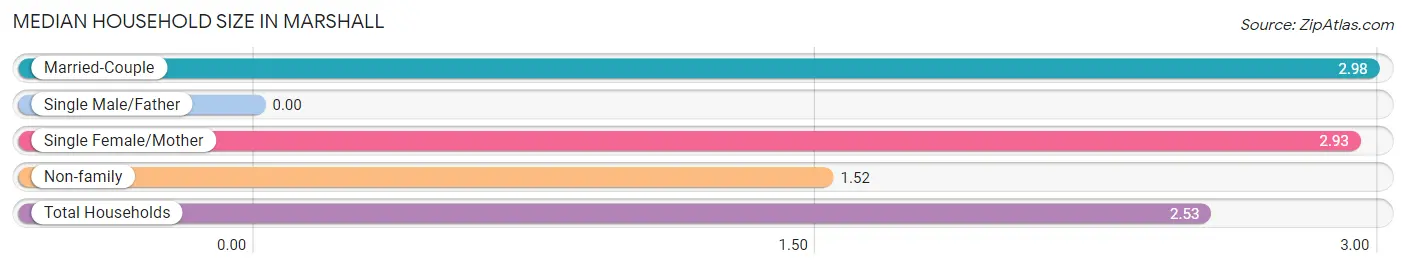
Median Household Size in Marshall
| Household Type | # Households | Household Size |
| Married-Couple | 781 (52.2%) | 2.98 |
| Single Male/Father | 0 (0.0%) | - |
| Single Female/Mother | 261 (17.5%) | 2.93 |
| Non-family | 453 (30.3%) | 1.52 |
| Total Households | 1,495 (100.0%) | 2.53 |
Household Size by Marriage Status in Marshall
Out of a total of 1,495 households in Marshall, 1,042 (69.7%) are family households, while 453 (30.3%) are nonfamily households. The most numerous type of family households are 3-person households, comprising 518, and the most common type of nonfamily households are 1-person households, comprising 219.
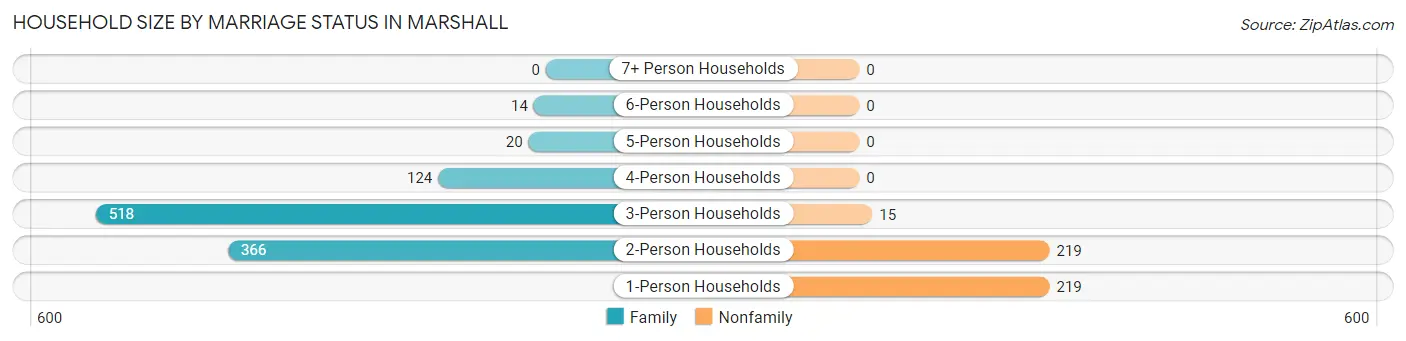
| Household Size | Family Households | Nonfamily Households |
| 1-Person Households | - | 219 (14.6%) |
| 2-Person Households | 366 (24.5%) | 219 (14.6%) |
| 3-Person Households | 518 (34.6%) | 15 (1.0%) |
| 4-Person Households | 124 (8.3%) | 0 (0.0%) |
| 5-Person Households | 20 (1.3%) | 0 (0.0%) |
| 6-Person Households | 14 (0.9%) | 0 (0.0%) |
| 7+ Person Households | 0 (0.0%) | 0 (0.0%) |
| Total | 1,042 (69.7%) | 453 (30.3%) |
Female Fertility in Marshall
Fertility by Age in Marshall
Average fertility rate in Marshall is 76.0 births per 1,000 women. Women in the age bracket of 20 to 34 years have the highest fertility rate with 130.0 births per 1,000 women. Women in the age bracket of 20 to 34 years acount for 80.8% of all women with births.
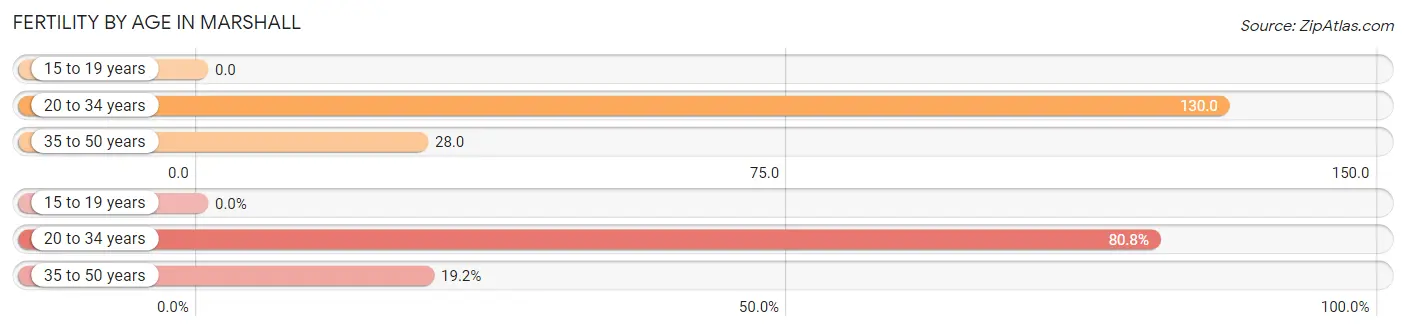
| Age Bracket | Women with Births | Births / 1,000 Women |
| 15 to 19 years | 0 (0.0%) | 0.0 |
| 20 to 34 years | 59 (80.8%) | 130.0 |
| 35 to 50 years | 14 (19.2%) | 28.0 |
| Total | 73 (100.0%) | 76.0 |
Fertility by Age by Marriage Status in Marshall
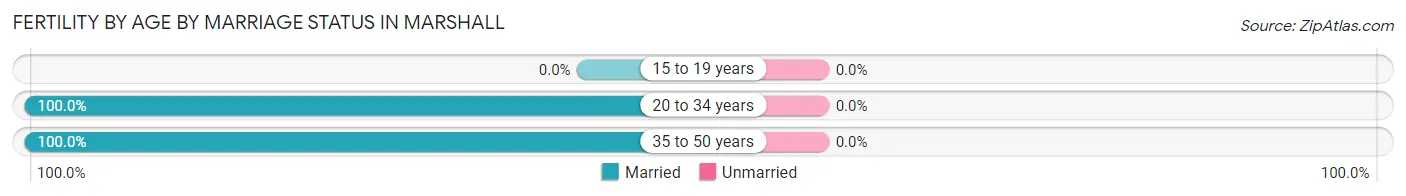
| Age Bracket | Married | Unmarried |
| 15 to 19 years | 0 (0.0%) | 0 (0.0%) |
| 20 to 34 years | 59 (100.0%) | 0 (0.0%) |
| 35 to 50 years | 14 (100.0%) | 0 (0.0%) |
| Total | 73 (100.0%) | 0 (0.0%) |
Fertility by Education in Marshall
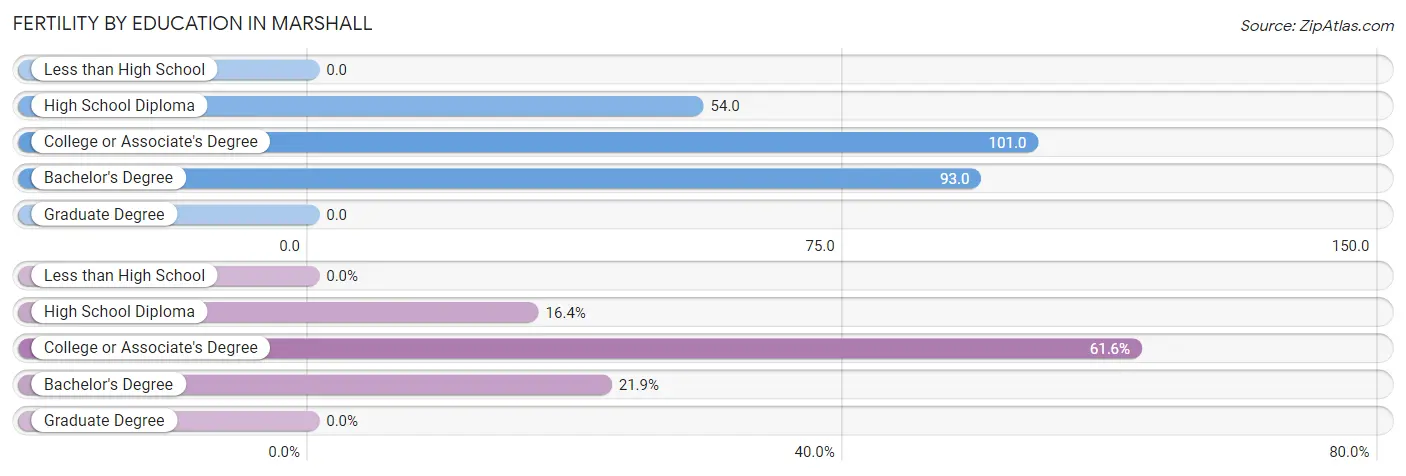
| Educational Attainment | Women with Births | Births / 1,000 Women |
| Less than High School | 0 (0.0%) | 0.0 |
| High School Diploma | 12 (16.4%) | 54.0 |
| College or Associate's Degree | 45 (61.6%) | 101.0 |
| Bachelor's Degree | 16 (21.9%) | 93.0 |
| Graduate Degree | 0 (0.0%) | 0.0 |
| Total | 73 (100.0%) | 76.0 |
Fertility by Education by Marriage Status in Marshall
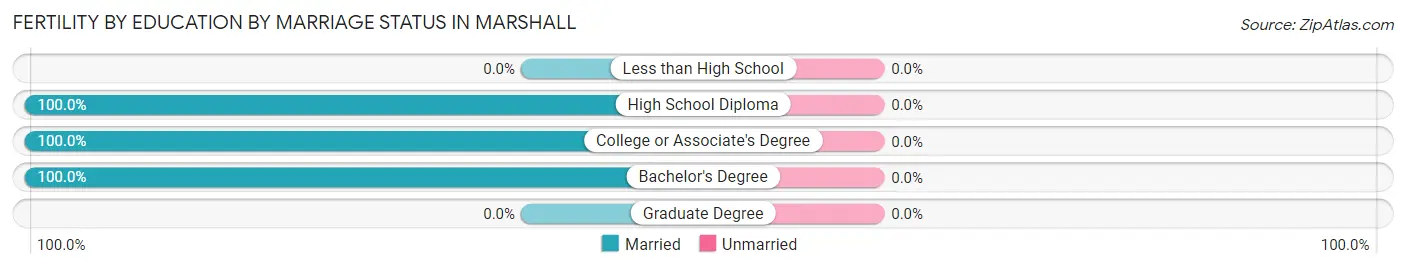
| Educational Attainment | Married | Unmarried |
| Less than High School | 0 (0.0%) | 0 (0.0%) |
| High School Diploma | 12 (100.0%) | 0 (0.0%) |
| College or Associate's Degree | 45 (100.0%) | 0 (0.0%) |
| Bachelor's Degree | 16 (100.0%) | 0 (0.0%) |
| Graduate Degree | 0 (0.0%) | 0 (0.0%) |
| Total | 73 (100.0%) | 0 (0.0%) |
Employment Characteristics in Marshall
Employment by Class of Employer in Marshall
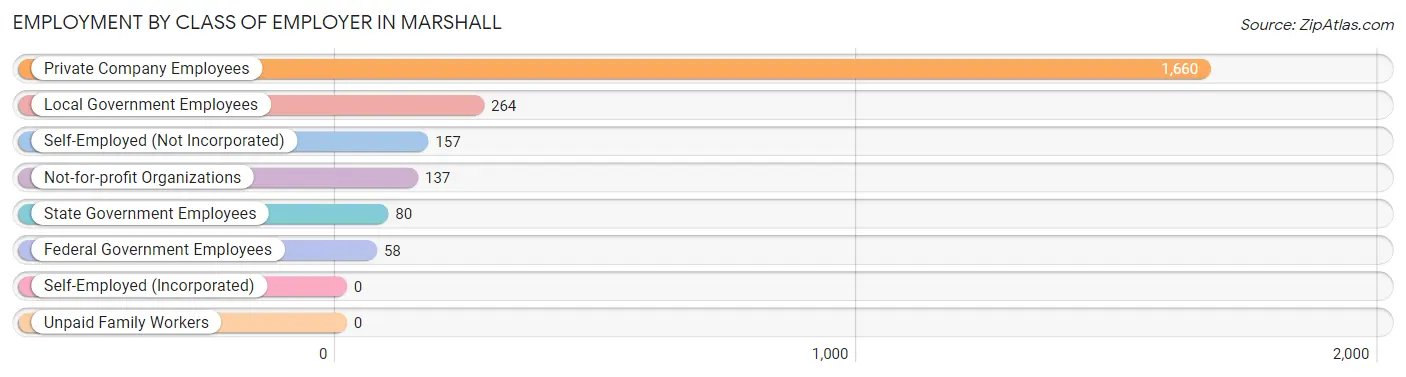
Among the 2,356 employed individuals in Marshall, private company employees (1,660 | 70.5%), local government employees (264 | 11.2%), and self-employed (not incorporated) (157 | 6.7%) make up the most common classes of employment.
| Employer Class | # Employees | % Employees |
| Private Company Employees | 1,660 | 70.5% |
| Self-Employed (Incorporated) | 0 | 0.0% |
| Self-Employed (Not Incorporated) | 157 | 6.7% |
| Not-for-profit Organizations | 137 | 5.8% |
| Local Government Employees | 264 | 11.2% |
| State Government Employees | 80 | 3.4% |
| Federal Government Employees | 58 | 2.5% |
| Unpaid Family Workers | 0 | 0.0% |
| Total | 2,356 | 100.0% |
Employment Status by Age in Marshall
According to the labor force statistics for Marshall, out of the total population over 16 years of age (3,070), 80.9% or 2,484 individuals are in the labor force, with 3.9% or 97 of them unemployed. The age group with the highest labor force participation rate is 20 to 24 years, with 100.0% or 281 individuals in the labor force. Within the labor force, the 20 to 24 years age range has the highest percentage of unemployed individuals, with 23.8% or 67 of them being unemployed.
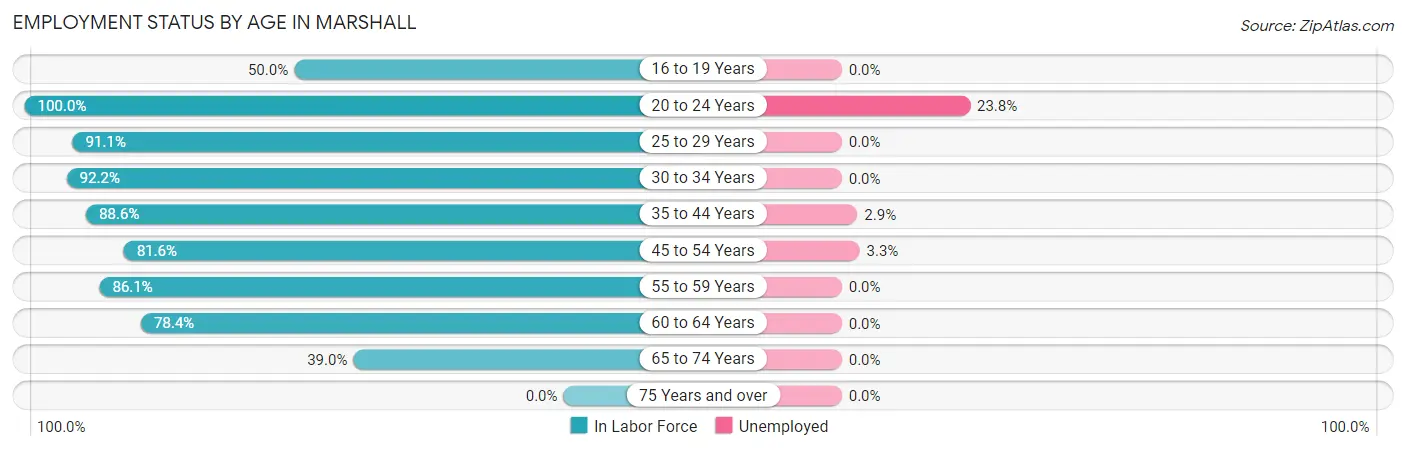
| Age Bracket | In Labor Force | Unemployed |
| 16 to 19 Years | 35 (50.0%) | 0 (0.0%) |
| 20 to 24 Years | 281 (100.0%) | 67 (23.8%) |
| 25 to 29 Years | 306 (91.1%) | 0 (0.0%) |
| 30 to 34 Years | 345 (92.2%) | 0 (0.0%) |
| 35 to 44 Years | 519 (88.6%) | 15 (2.9%) |
| 45 to 54 Years | 480 (81.6%) | 16 (3.3%) |
| 55 to 59 Years | 266 (86.1%) | 0 (0.0%) |
| 60 to 64 Years | 149 (78.4%) | 0 (0.0%) |
| 65 to 74 Years | 104 (39.0%) | 0 (0.0%) |
| 75 Years and over | 0 (0.0%) | 0 (0.0%) |
| Total | 2,484 (80.9%) | 97 (3.9%) |
Employment Status by Educational Attainment in Marshall
According to labor force statistics for Marshall, 86.7% of individuals (2,066) out of the total population between 25 and 64 years of age (2,383) are in the labor force, with 1.5% or 31 of them being unemployed. The group with the highest labor force participation rate are those with the educational attainment of bachelor's degree or higher, with 96.8% or 491 individuals in the labor force. Within the labor force, individuals with bachelor's degree or higher education have the highest percentage of unemployment, with 3.3% or 16 of them being unemployed.
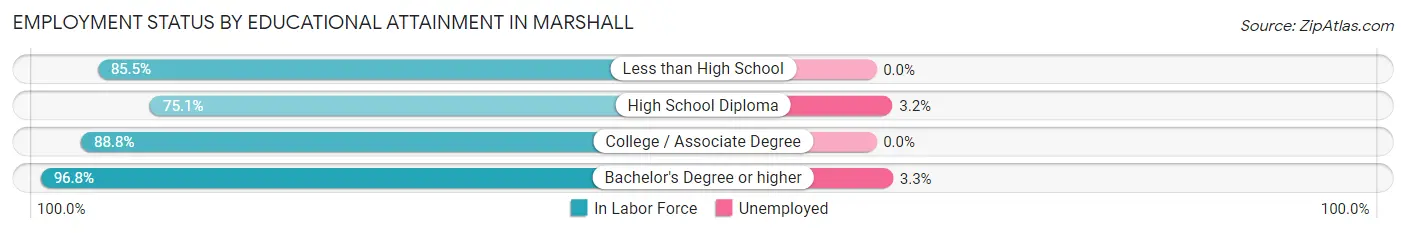
| Educational Attainment | In Labor Force | Unemployed |
| Less than High School | 165 (85.5%) | 0 (0.0%) |
| High School Diploma | 470 (75.1%) | 20 (3.2%) |
| College / Associate Degree | 939 (88.8%) | 0 (0.0%) |
| Bachelor's Degree or higher | 491 (96.8%) | 17 (3.3%) |
| Total | 2,066 (86.7%) | 36 (1.5%) |
Employment Occupations by Sex in Marshall
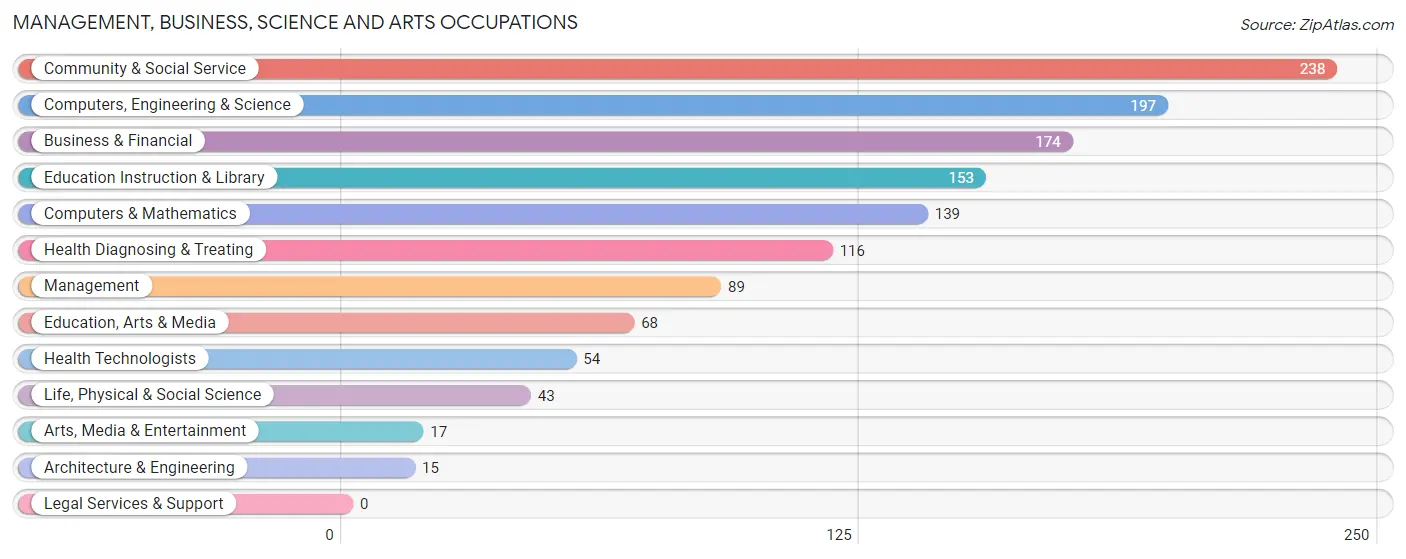
Management, Business, Science and Arts Occupations
The most common Management, Business, Science and Arts occupations in Marshall are Community & Social Service (238 | 10.0%), Computers, Engineering & Science (197 | 8.3%), Business & Financial (174 | 7.3%), Education Instruction & Library (153 | 6.4%), and Computers & Mathematics (139 | 5.8%).
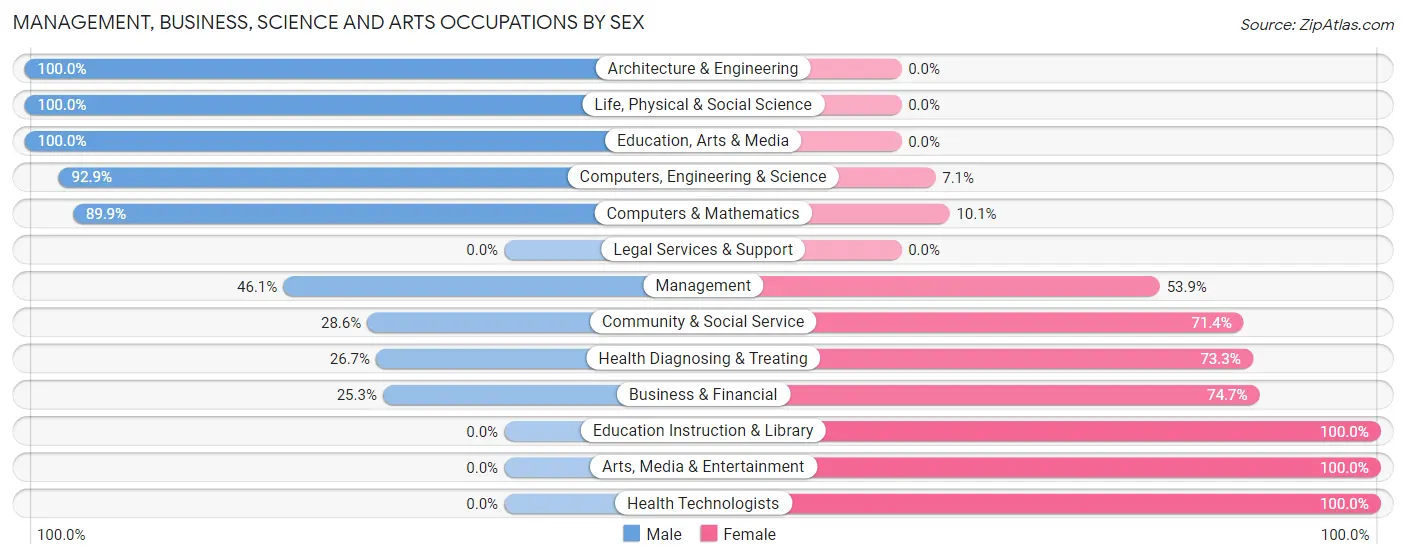
Management, Business, Science and Arts Occupations by Sex
Within the Management, Business, Science and Arts occupations in Marshall, the most male-oriented occupations are Architecture & Engineering (100.0%), Life, Physical & Social Science (100.0%), and Education, Arts & Media (100.0%), while the most female-oriented occupations are Education Instruction & Library (100.0%), Arts, Media & Entertainment (100.0%), and Health Technologists (100.0%).
| Occupation | Male | Female |
| Management | 41 (46.1%) | 48 (53.9%) |
| Business & Financial | 44 (25.3%) | 130 (74.7%) |
| Computers, Engineering & Science | 183 (92.9%) | 14 (7.1%) |
| Computers & Mathematics | 125 (89.9%) | 14 (10.1%) |
| Architecture & Engineering | 15 (100.0%) | 0 (0.0%) |
| Life, Physical & Social Science | 43 (100.0%) | 0 (0.0%) |
| Community & Social Service | 68 (28.6%) | 170 (71.4%) |
| Education, Arts & Media | 68 (100.0%) | 0 (0.0%) |
| Legal Services & Support | 0 (0.0%) | 0 (0.0%) |
| Education Instruction & Library | 0 (0.0%) | 153 (100.0%) |
| Arts, Media & Entertainment | 0 (0.0%) | 17 (100.0%) |
| Health Diagnosing & Treating | 31 (26.7%) | 85 (73.3%) |
| Health Technologists | 0 (0.0%) | 54 (100.0%) |
| Total (Category) | 367 (45.1%) | 447 (54.9%) |
| Total (Overall) | 1,227 (51.4%) | 1,160 (48.6%) |
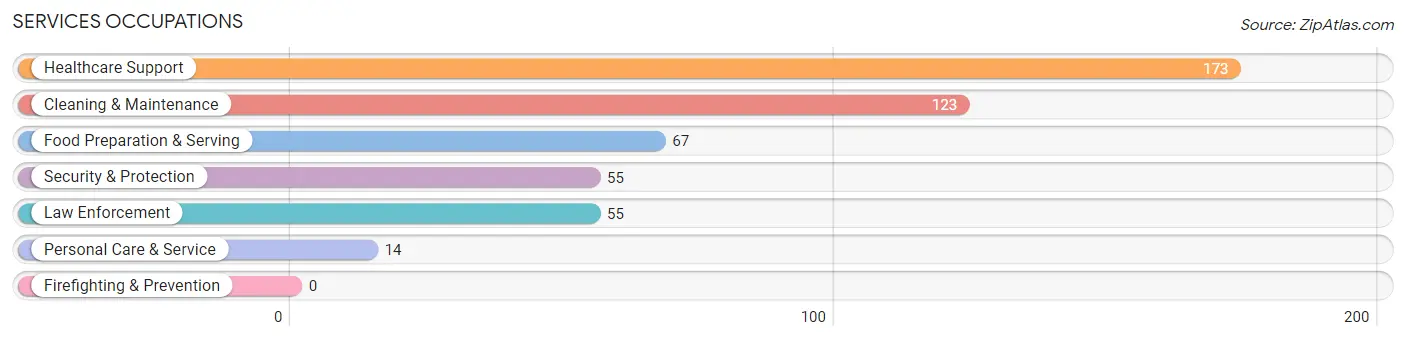
Services Occupations
The most common Services occupations in Marshall are Healthcare Support (173 | 7.2%), Cleaning & Maintenance (123 | 5.1%), Food Preparation & Serving (67 | 2.8%), Security & Protection (55 | 2.3%), and Law Enforcement (55 | 2.3%).
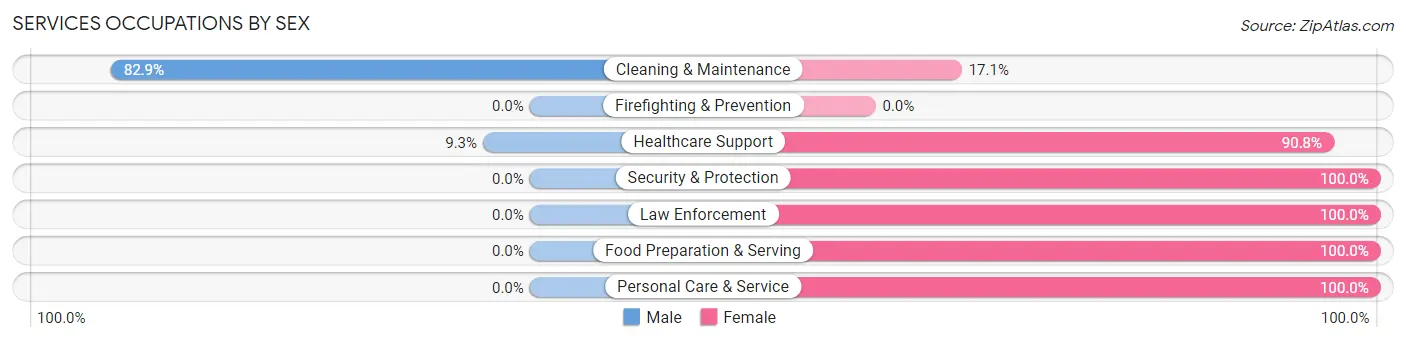
Services Occupations by Sex
Within the Services occupations in Marshall, the most male-oriented occupations are Cleaning & Maintenance (82.9%), and Healthcare Support (9.2%), while the most female-oriented occupations are Security & Protection (100.0%), Law Enforcement (100.0%), and Food Preparation & Serving (100.0%).
| Occupation | Male | Female |
| Healthcare Support | 16 (9.2%) | 157 (90.7%) |
| Security & Protection | 0 (0.0%) | 55 (100.0%) |
| Firefighting & Prevention | 0 (0.0%) | 0 (0.0%) |
| Law Enforcement | 0 (0.0%) | 55 (100.0%) |
| Food Preparation & Serving | 0 (0.0%) | 67 (100.0%) |
| Cleaning & Maintenance | 102 (82.9%) | 21 (17.1%) |
| Personal Care & Service | 0 (0.0%) | 14 (100.0%) |
| Total (Category) | 118 (27.3%) | 314 (72.7%) |
| Total (Overall) | 1,227 (51.4%) | 1,160 (48.6%) |
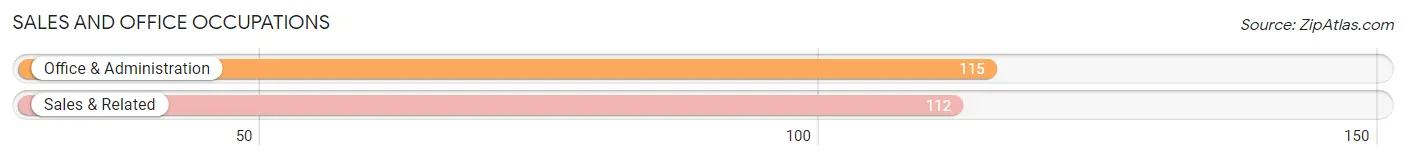
Sales and Office Occupations
The most common Sales and Office occupations in Marshall are Office & Administration (115 | 4.8%), and Sales & Related (112 | 4.7%).
Sales and Office Occupations by Sex
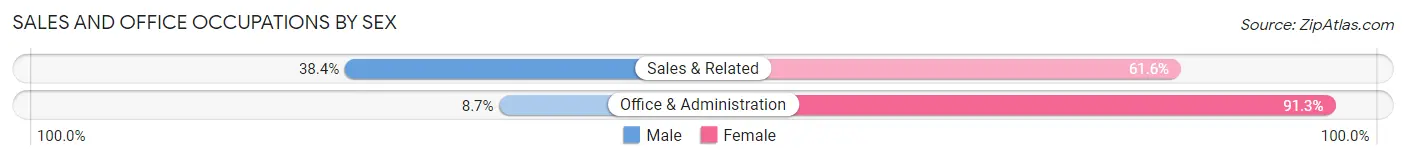
| Occupation | Male | Female |
| Sales & Related | 43 (38.4%) | 69 (61.6%) |
| Office & Administration | 10 (8.7%) | 105 (91.3%) |
| Total (Category) | 53 (23.4%) | 174 (76.6%) |
| Total (Overall) | 1,227 (51.4%) | 1,160 (48.6%) |
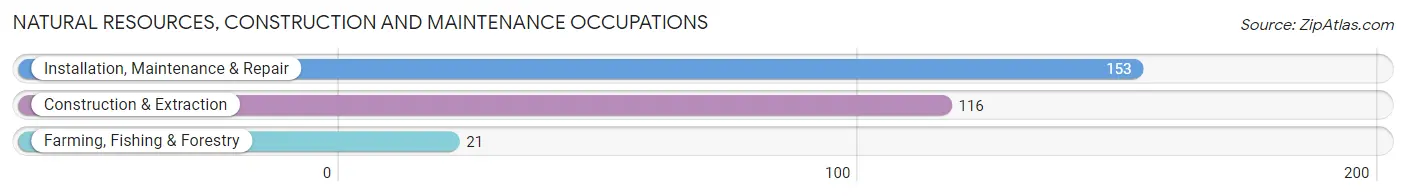
Natural Resources, Construction and Maintenance Occupations
The most common Natural Resources, Construction and Maintenance occupations in Marshall are Installation, Maintenance & Repair (153 | 6.4%), Construction & Extraction (116 | 4.9%), and Farming, Fishing & Forestry (21 | 0.9%).
Natural Resources, Construction and Maintenance Occupations by Sex
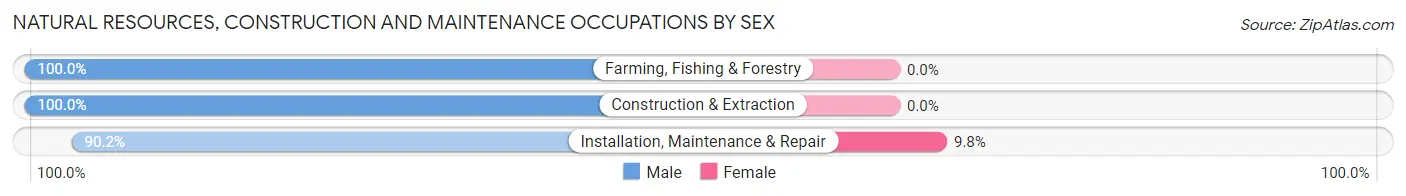
| Occupation | Male | Female |
| Farming, Fishing & Forestry | 21 (100.0%) | 0 (0.0%) |
| Construction & Extraction | 116 (100.0%) | 0 (0.0%) |
| Installation, Maintenance & Repair | 138 (90.2%) | 15 (9.8%) |
| Total (Category) | 275 (94.8%) | 15 (5.2%) |
| Total (Overall) | 1,227 (51.4%) | 1,160 (48.6%) |
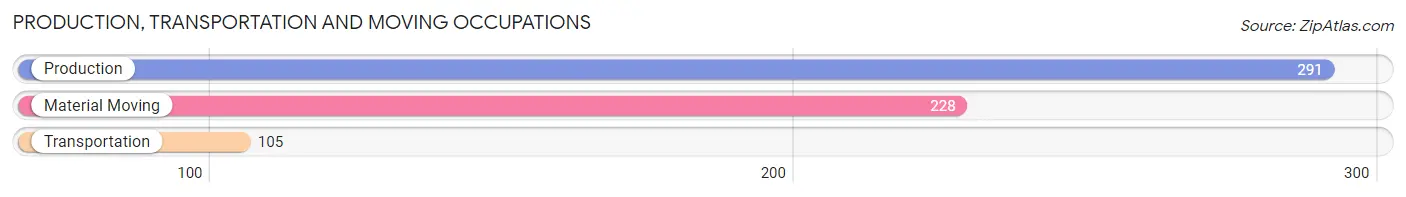
Production, Transportation and Moving Occupations
The most common Production, Transportation and Moving occupations in Marshall are Production (291 | 12.2%), Material Moving (228 | 9.6%), and Transportation (105 | 4.4%).
Production, Transportation and Moving Occupations by Sex
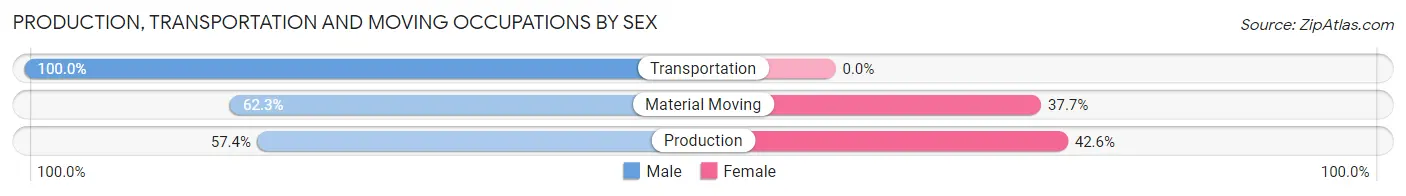
| Occupation | Male | Female |
| Production | 167 (57.4%) | 124 (42.6%) |
| Transportation | 105 (100.0%) | 0 (0.0%) |
| Material Moving | 142 (62.3%) | 86 (37.7%) |
| Total (Category) | 414 (66.3%) | 210 (33.7%) |
| Total (Overall) | 1,227 (51.4%) | 1,160 (48.6%) |
Employment Industries by Sex in Marshall
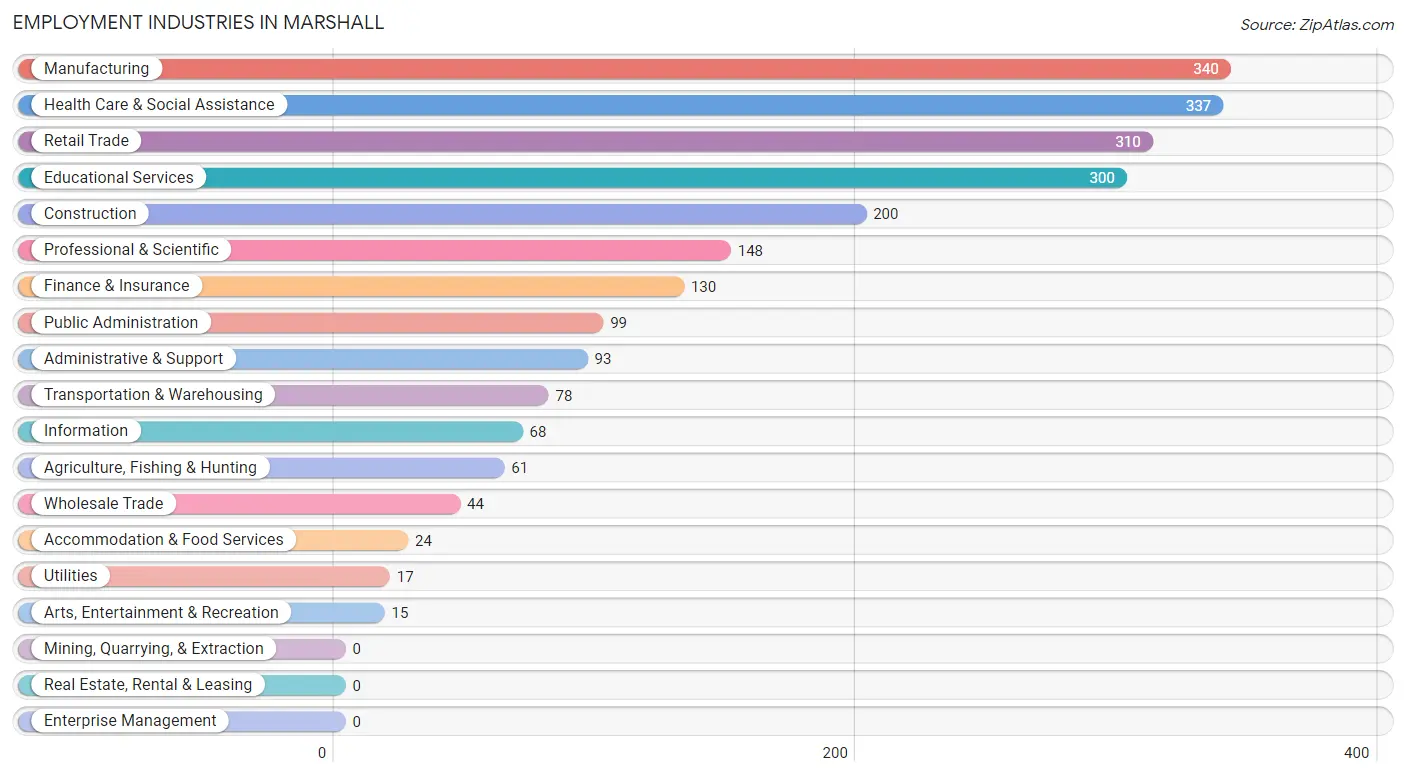
Employment Industries in Marshall
The major employment industries in Marshall include Manufacturing (340 | 14.2%), Health Care & Social Assistance (337 | 14.1%), Retail Trade (310 | 13.0%), Educational Services (300 | 12.6%), and Construction (200 | 8.4%).
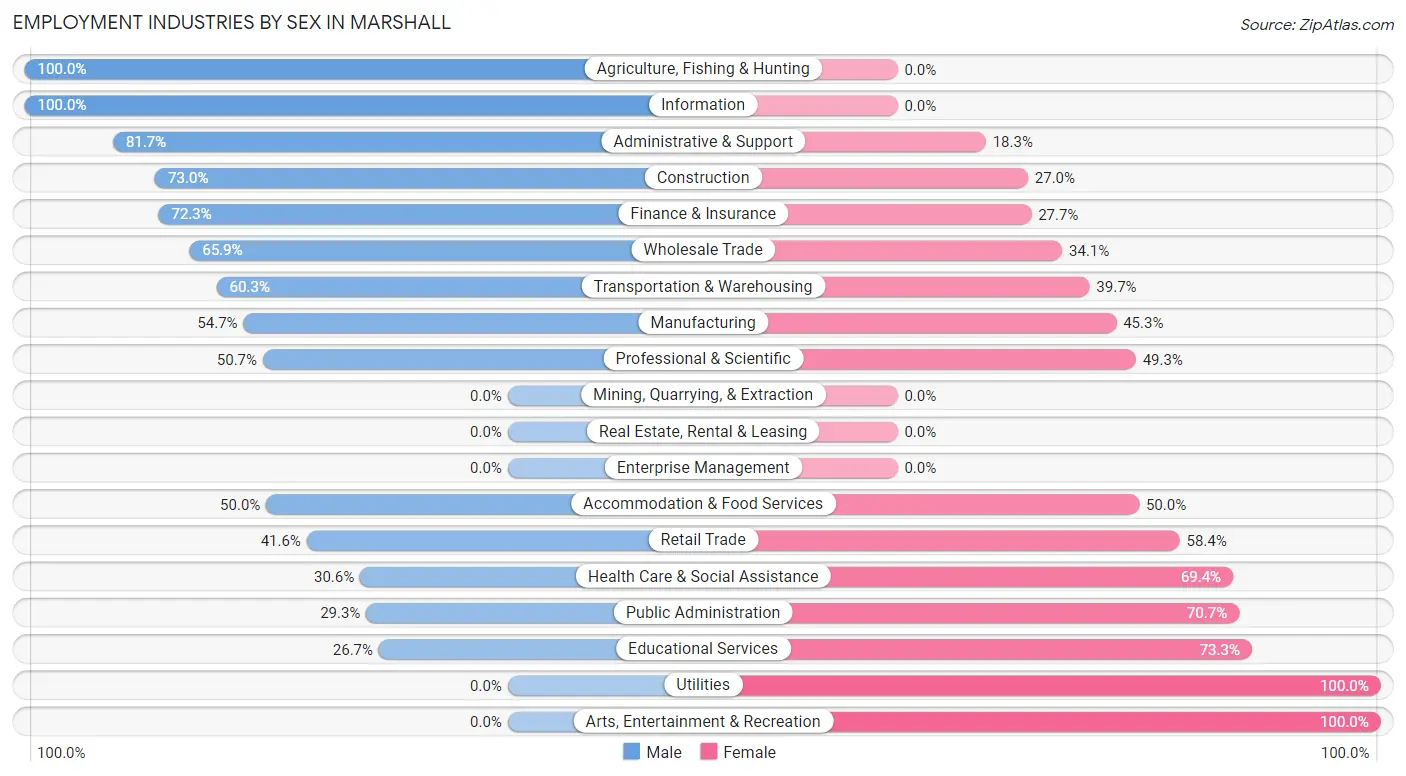
Employment Industries by Sex in Marshall
The Marshall industries that see more men than women are Agriculture, Fishing & Hunting (100.0%), Information (100.0%), and Administrative & Support (81.7%), whereas the industries that tend to have a higher number of women are Utilities (100.0%), Arts, Entertainment & Recreation (100.0%), and Educational Services (73.3%).
| Industry | Male | Female |
| Agriculture, Fishing & Hunting | 61 (100.0%) | 0 (0.0%) |
| Mining, Quarrying, & Extraction | 0 (0.0%) | 0 (0.0%) |
| Construction | 146 (73.0%) | 54 (27.0%) |
| Manufacturing | 186 (54.7%) | 154 (45.3%) |
| Wholesale Trade | 29 (65.9%) | 15 (34.1%) |
| Retail Trade | 129 (41.6%) | 181 (58.4%) |
| Transportation & Warehousing | 47 (60.3%) | 31 (39.7%) |
| Utilities | 0 (0.0%) | 17 (100.0%) |
| Information | 68 (100.0%) | 0 (0.0%) |
| Finance & Insurance | 94 (72.3%) | 36 (27.7%) |
| Real Estate, Rental & Leasing | 0 (0.0%) | 0 (0.0%) |
| Professional & Scientific | 75 (50.7%) | 73 (49.3%) |
| Enterprise Management | 0 (0.0%) | 0 (0.0%) |
| Administrative & Support | 76 (81.7%) | 17 (18.3%) |
| Educational Services | 80 (26.7%) | 220 (73.3%) |
| Health Care & Social Assistance | 103 (30.6%) | 234 (69.4%) |
| Arts, Entertainment & Recreation | 0 (0.0%) | 15 (100.0%) |
| Accommodation & Food Services | 12 (50.0%) | 12 (50.0%) |
| Public Administration | 29 (29.3%) | 70 (70.7%) |
| Total | 1,227 (51.4%) | 1,160 (48.6%) |
Education in Marshall
School Enrollment in Marshall
The most common levels of schooling among the 805 students in Marshall are college / undergraduate (238 | 29.6%), elementary school (214 | 26.6%), and middle school (165 | 20.5%).
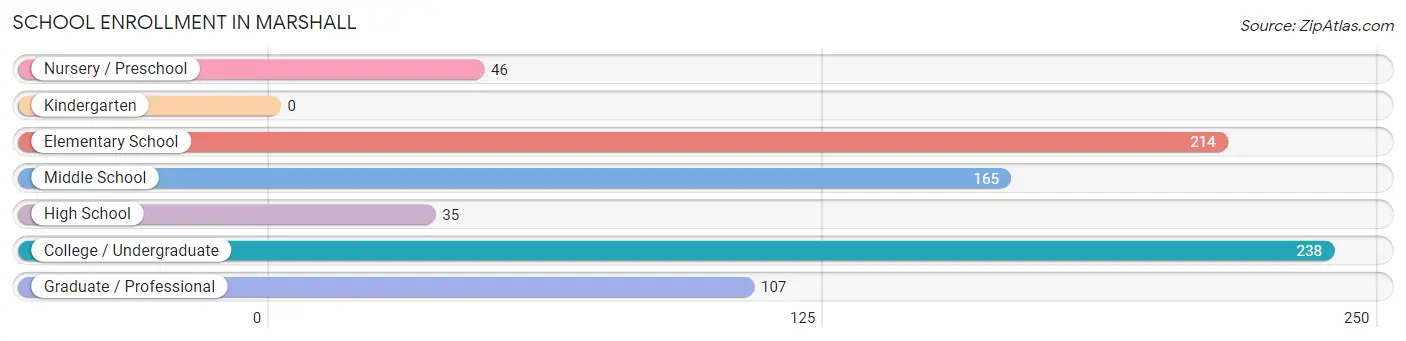
| School Level | # Students | % Students |
| Nursery / Preschool | 46 | 5.7% |
| Kindergarten | 0 | 0.0% |
| Elementary School | 214 | 26.6% |
| Middle School | 165 | 20.5% |
| High School | 35 | 4.3% |
| College / Undergraduate | 238 | 29.6% |
| Graduate / Professional | 107 | 13.3% |
| Total | 805 | 100.0% |
School Enrollment by Age by Funding Source in Marshall
Out of a total of 805 students who are enrolled in schools in Marshall, 154 (19.1%) attend a private institution, while the remaining 651 (80.9%) are enrolled in public schools. The age group of 25 to 34 year olds has the highest likelihood of being enrolled in private schools, with 61 (46.6% in the age bracket) enrolled. Conversely, the age group of 15 to 17 year olds has the lowest likelihood of being enrolled in a private school, with 35 (100.0% in the age bracket) attending a public institution.
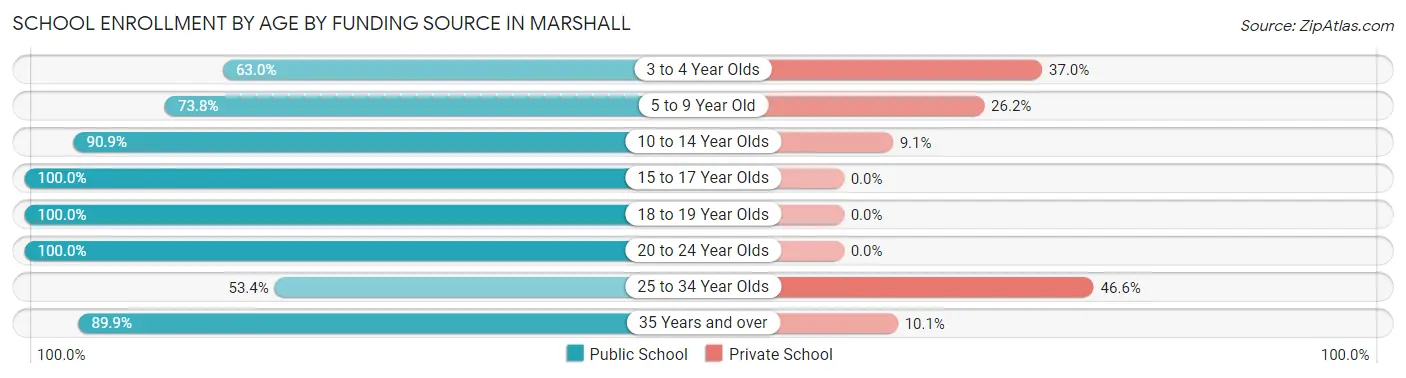
| Age Bracket | Public School | Private School |
| 3 to 4 Year Olds | 29 (63.0%) | 17 (37.0%) |
| 5 to 9 Year Old | 110 (73.8%) | 39 (26.2%) |
| 10 to 14 Year Olds | 209 (90.9%) | 21 (9.1%) |
| 15 to 17 Year Olds | 35 (100.0%) | 0 (0.0%) |
| 18 to 19 Year Olds | 35 (100.0%) | 0 (0.0%) |
| 20 to 24 Year Olds | 20 (100.0%) | 0 (0.0%) |
| 25 to 34 Year Olds | 70 (53.4%) | 61 (46.6%) |
| 35 Years and over | 143 (89.9%) | 16 (10.1%) |
| Total | 651 (80.9%) | 154 (19.1%) |
Educational Attainment by Field of Study in Marshall
Business (167 | 25.8%), education (139 | 21.4%), arts & humanities (60 | 9.3%), computers & mathematics (54 | 8.3%), and psychology (52 | 8.0%) are the most common fields of study among 648 individuals in Marshall who have obtained a bachelor's degree or higher.
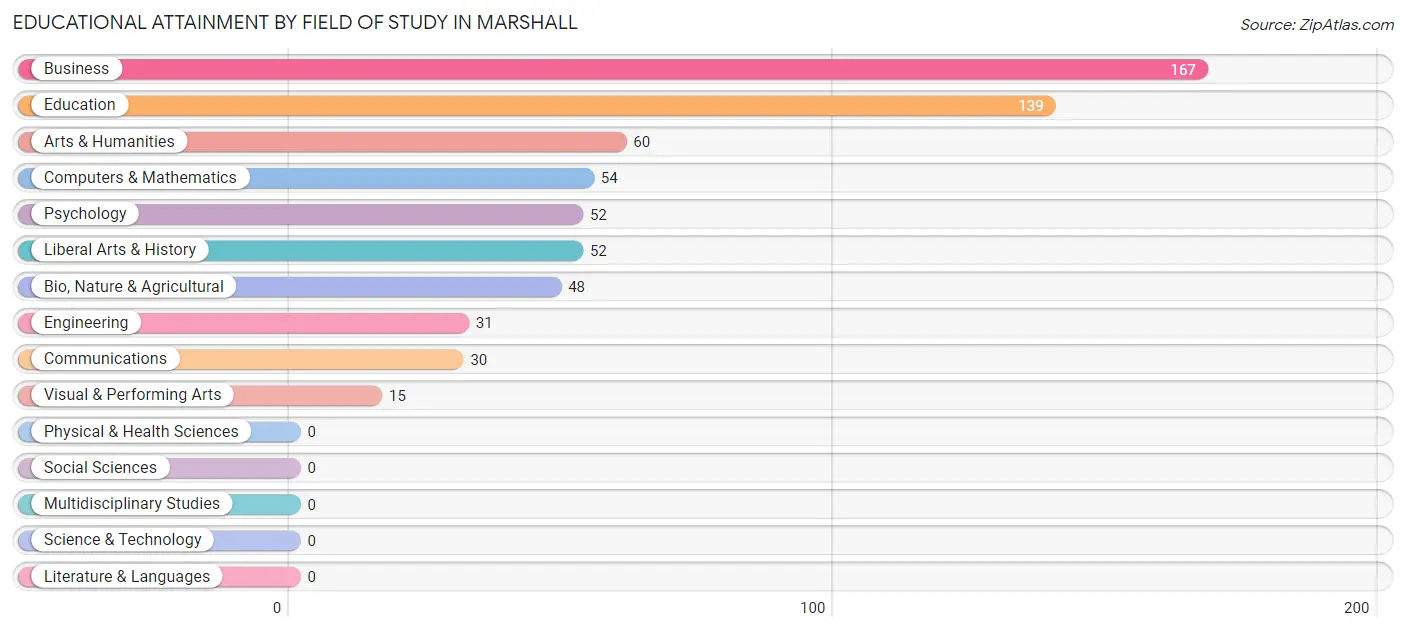
| Field of Study | # Graduates | % Graduates |
| Computers & Mathematics | 54 | 8.3% |
| Bio, Nature & Agricultural | 48 | 7.4% |
| Physical & Health Sciences | 0 | 0.0% |
| Psychology | 52 | 8.0% |
| Social Sciences | 0 | 0.0% |
| Engineering | 31 | 4.8% |
| Multidisciplinary Studies | 0 | 0.0% |
| Science & Technology | 0 | 0.0% |
| Business | 167 | 25.8% |
| Education | 139 | 21.4% |
| Literature & Languages | 0 | 0.0% |
| Liberal Arts & History | 52 | 8.0% |
| Visual & Performing Arts | 15 | 2.3% |
| Communications | 30 | 4.6% |
| Arts & Humanities | 60 | 9.3% |
| Total | 648 | 100.0% |
Transportation & Commute in Marshall
Vehicle Availability by Sex in Marshall
The most prevalent vehicle ownership categories in Marshall are males with 2 vehicles (579, accounting for 47.2%) and females with 2 vehicles (604, making up 51.6%).
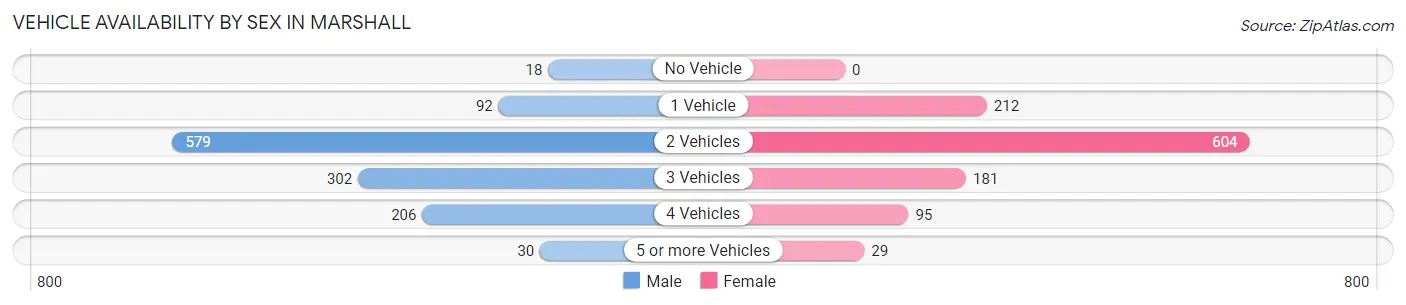
| Vehicles Available | Male | Female |
| No Vehicle | 18 (1.5%) | 0 (0.0%) |
| 1 Vehicle | 92 (7.5%) | 212 (18.9%) |
| 2 Vehicles | 579 (47.2%) | 604 (53.9%) |
| 3 Vehicles | 302 (24.6%) | 181 (16.2%) |
| 4 Vehicles | 206 (16.8%) | 95 (8.5%) |
| 5 or more Vehicles | 30 (2.4%) | 29 (2.6%) |
| Total | 1,227 (100.0%) | 1,121 (100.0%) |
Commute Time in Marshall
The most frequently occuring commute durations in Marshall are 30 to 34 minutes (402 commuters, 19.1%), 20 to 24 minutes (284 commuters, 13.5%), and 10 to 14 minutes (273 commuters, 13.0%).
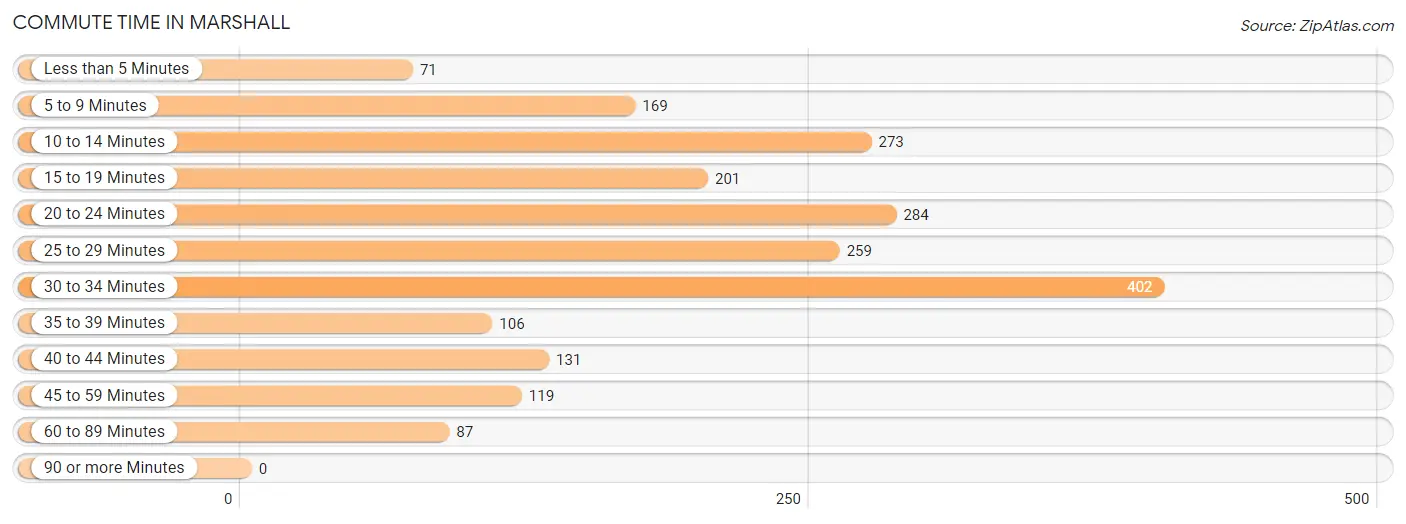
| Commute Time | # Commuters | % Commuters |
| Less than 5 Minutes | 71 | 3.4% |
| 5 to 9 Minutes | 169 | 8.0% |
| 10 to 14 Minutes | 273 | 13.0% |
| 15 to 19 Minutes | 201 | 9.6% |
| 20 to 24 Minutes | 284 | 13.5% |
| 25 to 29 Minutes | 259 | 12.3% |
| 30 to 34 Minutes | 402 | 19.1% |
| 35 to 39 Minutes | 106 | 5.0% |
| 40 to 44 Minutes | 131 | 6.2% |
| 45 to 59 Minutes | 119 | 5.7% |
| 60 to 89 Minutes | 87 | 4.1% |
| 90 or more Minutes | 0 | 0.0% |
Commute Time by Sex in Marshall
The most common commute times in Marshall are 15 to 19 minutes (201 commuters, 18.6%) for males and 30 to 34 minutes (257 commuters, 25.2%) for females.
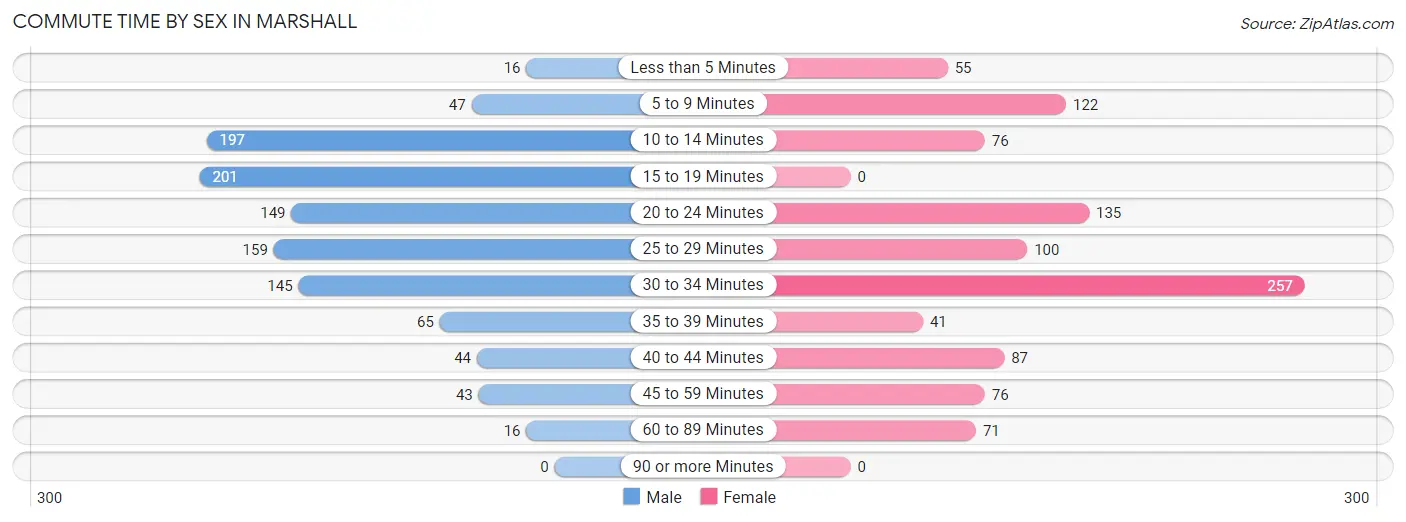
| Commute Time | Male | Female |
| Less than 5 Minutes | 16 (1.5%) | 55 (5.4%) |
| 5 to 9 Minutes | 47 (4.3%) | 122 (12.0%) |
| 10 to 14 Minutes | 197 (18.2%) | 76 (7.4%) |
| 15 to 19 Minutes | 201 (18.6%) | 0 (0.0%) |
| 20 to 24 Minutes | 149 (13.8%) | 135 (13.2%) |
| 25 to 29 Minutes | 159 (14.7%) | 100 (9.8%) |
| 30 to 34 Minutes | 145 (13.4%) | 257 (25.2%) |
| 35 to 39 Minutes | 65 (6.0%) | 41 (4.0%) |
| 40 to 44 Minutes | 44 (4.1%) | 87 (8.5%) |
| 45 to 59 Minutes | 43 (4.0%) | 76 (7.4%) |
| 60 to 89 Minutes | 16 (1.5%) | 71 (7.0%) |
| 90 or more Minutes | 0 (0.0%) | 0 (0.0%) |
Time of Departure to Work by Sex in Marshall
The most frequent times of departure to work in Marshall are 6:30 AM to 6:59 AM (203, 18.8%) for males and 4:00 PM to 11:59 PM (218, 21.4%) for females.
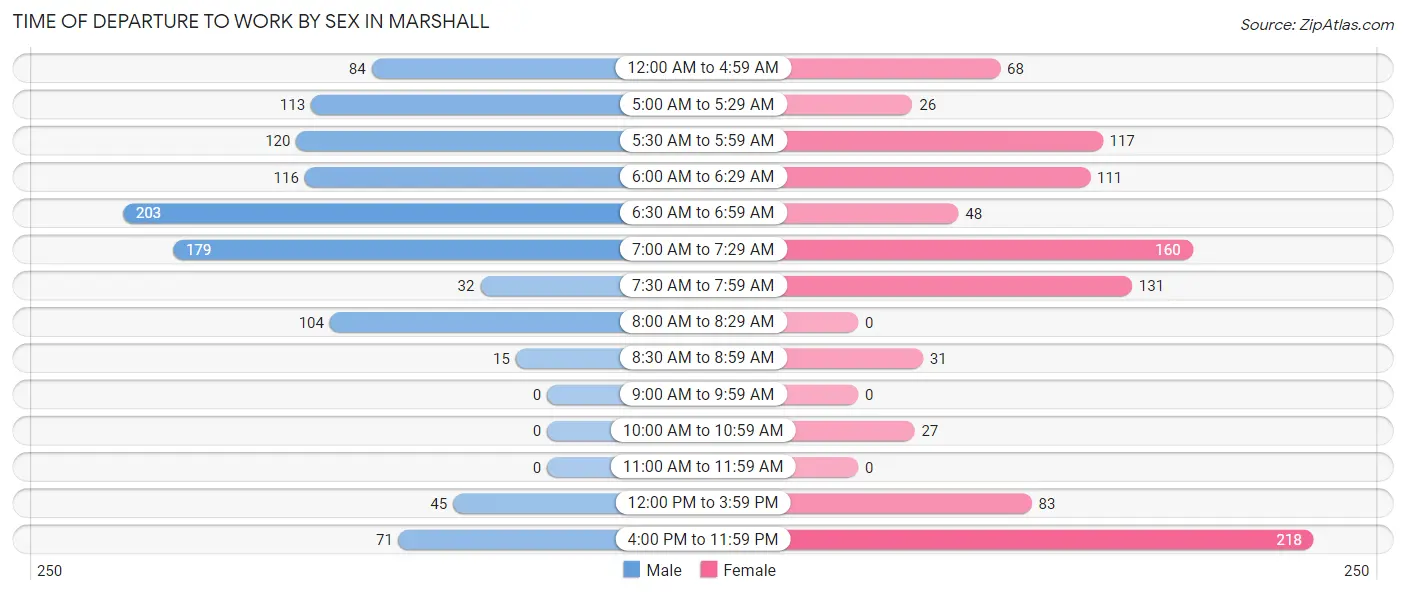
| Time of Departure | Male | Female |
| 12:00 AM to 4:59 AM | 84 (7.8%) | 68 (6.7%) |
| 5:00 AM to 5:29 AM | 113 (10.4%) | 26 (2.5%) |
| 5:30 AM to 5:59 AM | 120 (11.1%) | 117 (11.5%) |
| 6:00 AM to 6:29 AM | 116 (10.7%) | 111 (10.9%) |
| 6:30 AM to 6:59 AM | 203 (18.8%) | 48 (4.7%) |
| 7:00 AM to 7:29 AM | 179 (16.5%) | 160 (15.7%) |
| 7:30 AM to 7:59 AM | 32 (3.0%) | 131 (12.8%) |
| 8:00 AM to 8:29 AM | 104 (9.6%) | 0 (0.0%) |
| 8:30 AM to 8:59 AM | 15 (1.4%) | 31 (3.0%) |
| 9:00 AM to 9:59 AM | 0 (0.0%) | 0 (0.0%) |
| 10:00 AM to 10:59 AM | 0 (0.0%) | 27 (2.6%) |
| 11:00 AM to 11:59 AM | 0 (0.0%) | 0 (0.0%) |
| 12:00 PM to 3:59 PM | 45 (4.2%) | 83 (8.1%) |
| 4:00 PM to 11:59 PM | 71 (6.6%) | 218 (21.4%) |
| Total | 1,082 (100.0%) | 1,020 (100.0%) |
Housing Occupancy in Marshall
Occupancy by Ownership in Marshall
Of the total 1,495 dwellings in Marshall, owner-occupied units account for 996 (66.6%), while renter-occupied units make up 499 (33.4%).
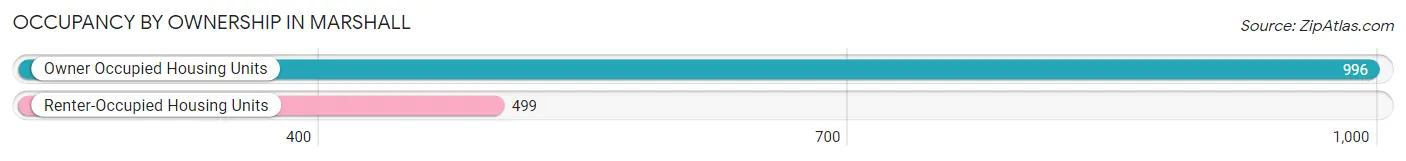
| Occupancy | # Housing Units | % Housing Units |
| Owner Occupied Housing Units | 996 | 66.6% |
| Renter-Occupied Housing Units | 499 | 33.4% |
| Total Occupied Housing Units | 1,495 | 100.0% |
Occupancy by Household Size in Marshall
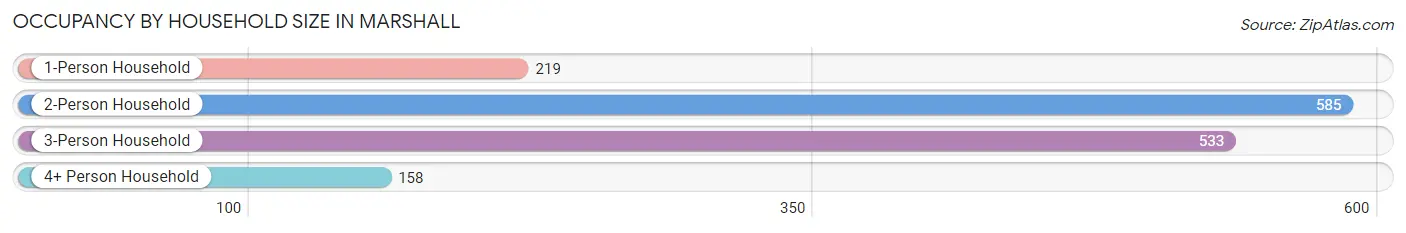
| Household Size | # Housing Units | % Housing Units |
| 1-Person Household | 219 | 14.6% |
| 2-Person Household | 585 | 39.1% |
| 3-Person Household | 533 | 35.6% |
| 4+ Person Household | 158 | 10.6% |
| Total Housing Units | 1,495 | 100.0% |
Occupancy by Ownership by Household Size in Marshall
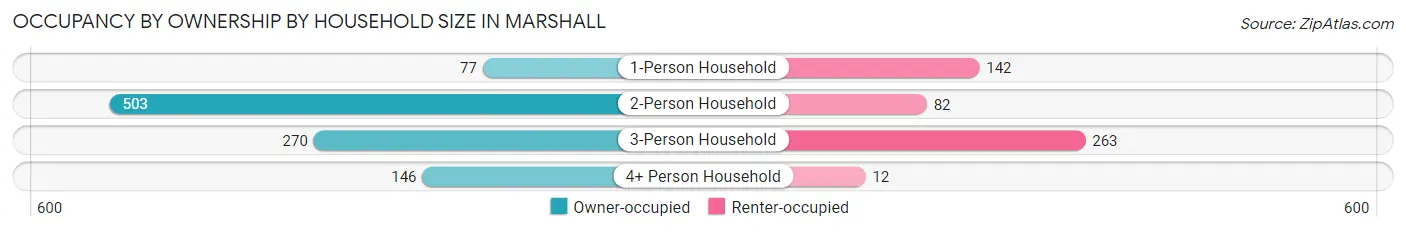
| Household Size | Owner-occupied | Renter-occupied |
| 1-Person Household | 77 (35.2%) | 142 (64.8%) |
| 2-Person Household | 503 (86.0%) | 82 (14.0%) |
| 3-Person Household | 270 (50.7%) | 263 (49.3%) |
| 4+ Person Household | 146 (92.4%) | 12 (7.6%) |
| Total Housing Units | 996 (66.6%) | 499 (33.4%) |
Occupancy by Educational Attainment in Marshall
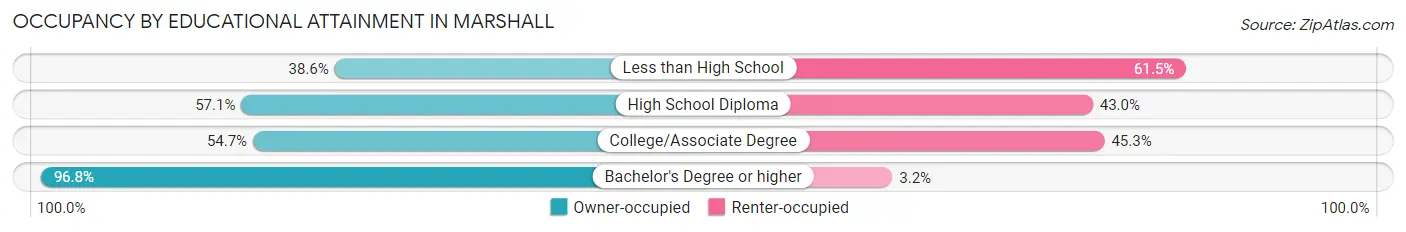
| Household Size | Owner-occupied | Renter-occupied |
| Less than High School | 32 (38.6%) | 51 (61.5%) |
| High School Diploma | 170 (57.1%) | 128 (42.9%) |
| College/Associate Degree | 370 (54.7%) | 306 (45.3%) |
| Bachelor's Degree or higher | 424 (96.8%) | 14 (3.2%) |
Occupancy by Age of Householder in Marshall
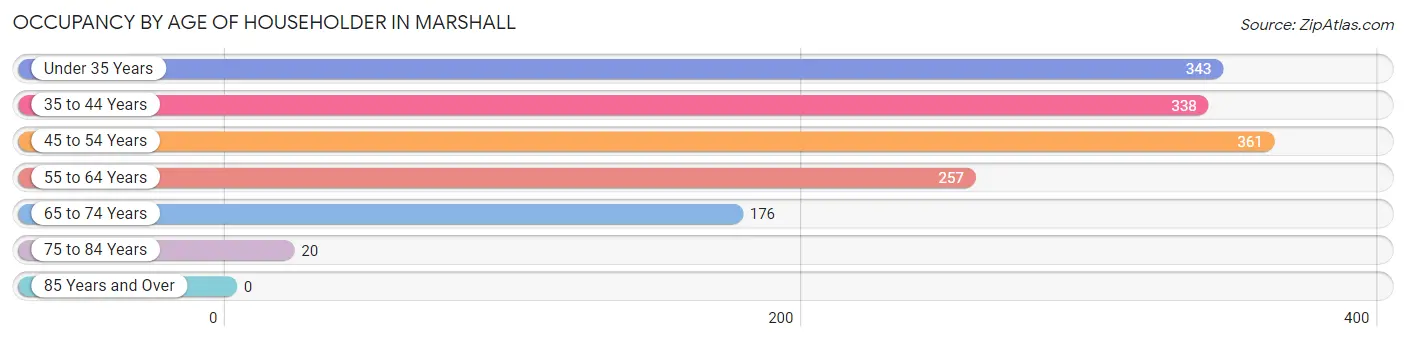
| Age Bracket | # Households | % Households |
| Under 35 Years | 343 | 22.9% |
| 35 to 44 Years | 338 | 22.6% |
| 45 to 54 Years | 361 | 24.1% |
| 55 to 64 Years | 257 | 17.2% |
| 65 to 74 Years | 176 | 11.8% |
| 75 to 84 Years | 20 | 1.3% |
| 85 Years and Over | 0 | 0.0% |
| Total | 1,495 | 100.0% |
Housing Finances in Marshall
Median Income by Occupancy in Marshall
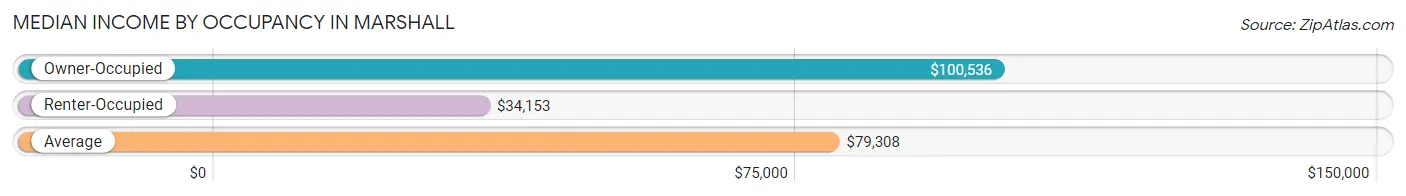
| Occupancy Type | # Households | Median Income |
| Owner-Occupied | 996 (66.6%) | $100,536 |
| Renter-Occupied | 499 (33.4%) | $34,153 |
| Average | 1,495 (100.0%) | $79,308 |
Occupancy by Householder Income Bracket in Marshall
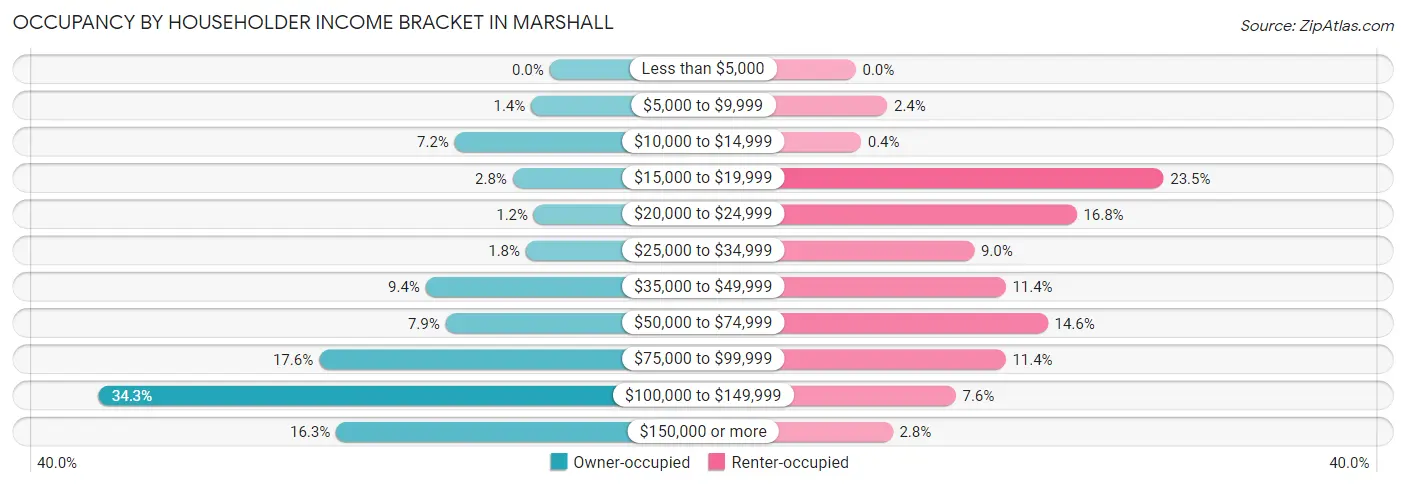
| Income Bracket | Owner-occupied | Renter-occupied |
| Less than $5,000 | 0 (0.0%) | 0 (0.0%) |
| $5,000 to $9,999 | 14 (1.4%) | 12 (2.4%) |
| $10,000 to $14,999 | 72 (7.2%) | 2 (0.4%) |
| $15,000 to $19,999 | 28 (2.8%) | 117 (23.4%) |
| $20,000 to $24,999 | 12 (1.2%) | 84 (16.8%) |
| $25,000 to $34,999 | 18 (1.8%) | 45 (9.0%) |
| $35,000 to $49,999 | 94 (9.4%) | 57 (11.4%) |
| $50,000 to $74,999 | 79 (7.9%) | 73 (14.6%) |
| $75,000 to $99,999 | 175 (17.6%) | 57 (11.4%) |
| $100,000 to $149,999 | 342 (34.3%) | 38 (7.6%) |
| $150,000 or more | 162 (16.3%) | 14 (2.8%) |
| Total | 996 (100.0%) | 499 (100.0%) |
Monthly Housing Cost Tiers in Marshall
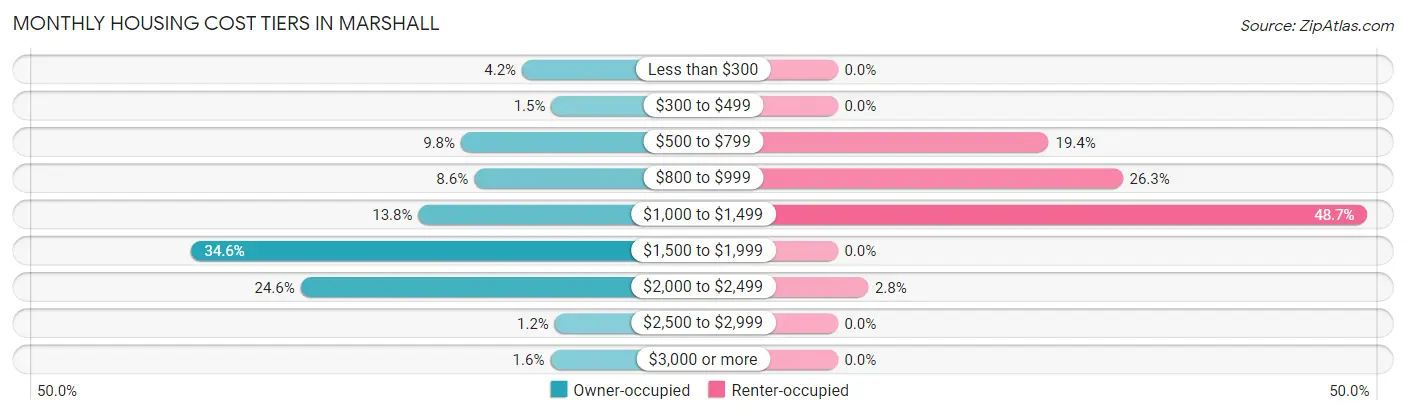
| Monthly Cost | Owner-occupied | Renter-occupied |
| Less than $300 | 42 (4.2%) | 0 (0.0%) |
| $300 to $499 | 15 (1.5%) | 0 (0.0%) |
| $500 to $799 | 98 (9.8%) | 97 (19.4%) |
| $800 to $999 | 86 (8.6%) | 131 (26.3%) |
| $1,000 to $1,499 | 137 (13.8%) | 243 (48.7%) |
| $1,500 to $1,999 | 345 (34.6%) | 0 (0.0%) |
| $2,000 to $2,499 | 245 (24.6%) | 14 (2.8%) |
| $2,500 to $2,999 | 12 (1.2%) | 0 (0.0%) |
| $3,000 or more | 16 (1.6%) | 0 (0.0%) |
| Total | 996 (100.0%) | 499 (100.0%) |
Physical Housing Characteristics in Marshall
Housing Structures in Marshall
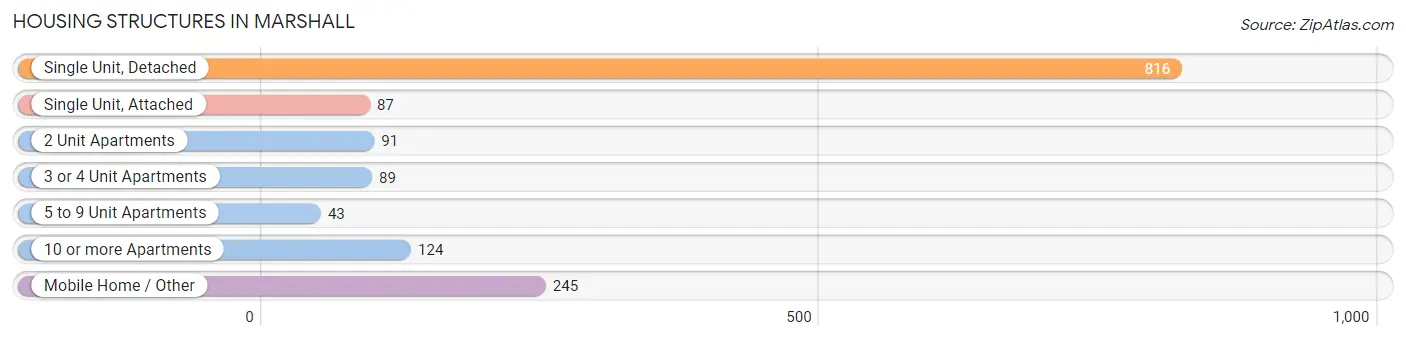
| Structure Type | # Housing Units | % Housing Units |
| Single Unit, Detached | 816 | 54.6% |
| Single Unit, Attached | 87 | 5.8% |
| 2 Unit Apartments | 91 | 6.1% |
| 3 or 4 Unit Apartments | 89 | 5.9% |
| 5 to 9 Unit Apartments | 43 | 2.9% |
| 10 or more Apartments | 124 | 8.3% |
| Mobile Home / Other | 245 | 16.4% |
| Total | 1,495 | 100.0% |
Housing Structures by Occupancy in Marshall
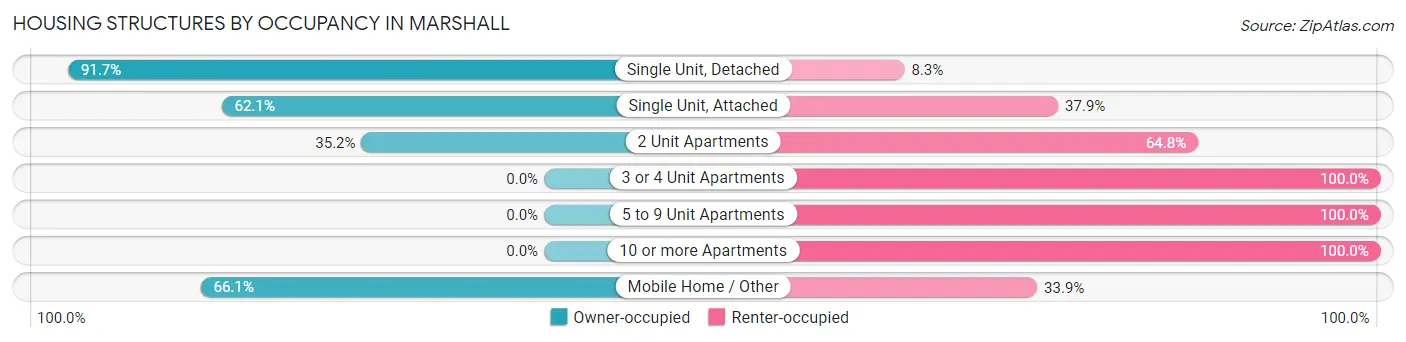
| Structure Type | Owner-occupied | Renter-occupied |
| Single Unit, Detached | 748 (91.7%) | 68 (8.3%) |
| Single Unit, Attached | 54 (62.1%) | 33 (37.9%) |
| 2 Unit Apartments | 32 (35.2%) | 59 (64.8%) |
| 3 or 4 Unit Apartments | 0 (0.0%) | 89 (100.0%) |
| 5 to 9 Unit Apartments | 0 (0.0%) | 43 (100.0%) |
| 10 or more Apartments | 0 (0.0%) | 124 (100.0%) |
| Mobile Home / Other | 162 (66.1%) | 83 (33.9%) |
| Total | 996 (66.6%) | 499 (33.4%) |
Housing Structures by Number of Rooms in Marshall
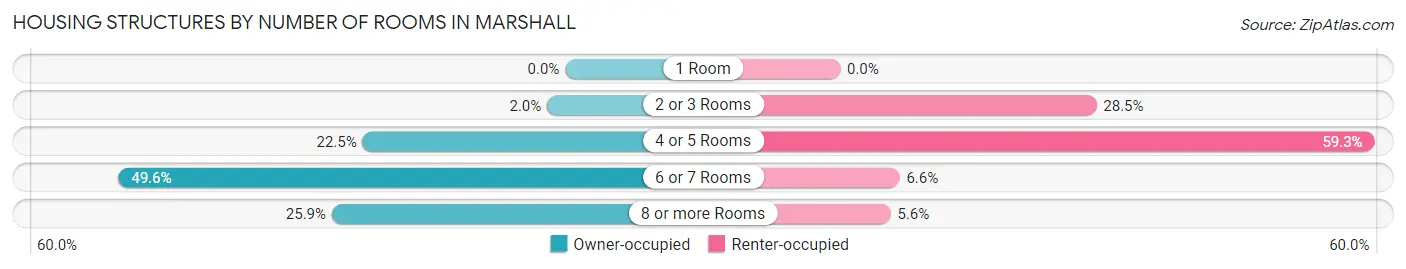
| Number of Rooms | Owner-occupied | Renter-occupied |
| 1 Room | 0 (0.0%) | 0 (0.0%) |
| 2 or 3 Rooms | 20 (2.0%) | 142 (28.5%) |
| 4 or 5 Rooms | 224 (22.5%) | 296 (59.3%) |
| 6 or 7 Rooms | 494 (49.6%) | 33 (6.6%) |
| 8 or more Rooms | 258 (25.9%) | 28 (5.6%) |
| Total | 996 (100.0%) | 499 (100.0%) |
Housing Structure by Heating Type in Marshall
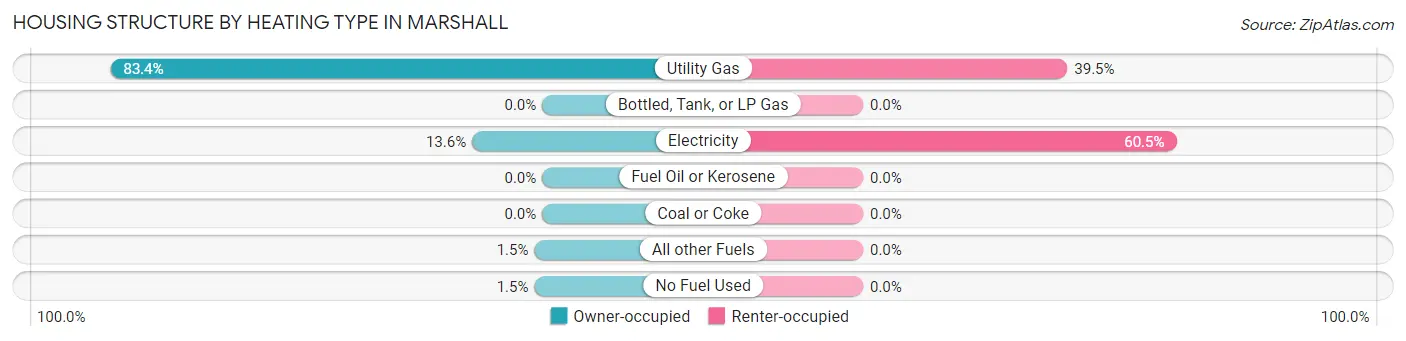
| Heating Type | Owner-occupied | Renter-occupied |
| Utility Gas | 831 (83.4%) | 197 (39.5%) |
| Bottled, Tank, or LP Gas | 0 (0.0%) | 0 (0.0%) |
| Electricity | 135 (13.6%) | 302 (60.5%) |
| Fuel Oil or Kerosene | 0 (0.0%) | 0 (0.0%) |
| Coal or Coke | 0 (0.0%) | 0 (0.0%) |
| All other Fuels | 15 (1.5%) | 0 (0.0%) |
| No Fuel Used | 15 (1.5%) | 0 (0.0%) |
| Total | 996 (100.0%) | 499 (100.0%) |
Household Vehicle Usage in Marshall
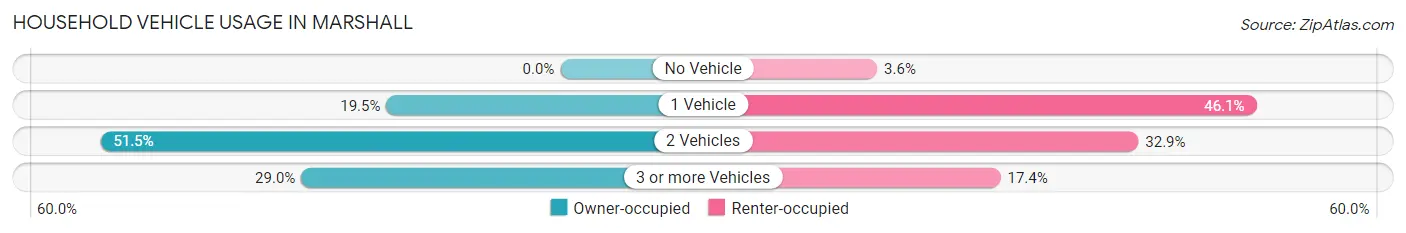
| Vehicles per Household | Owner-occupied | Renter-occupied |
| No Vehicle | 0 (0.0%) | 18 (3.6%) |
| 1 Vehicle | 194 (19.5%) | 230 (46.1%) |
| 2 Vehicles | 513 (51.5%) | 164 (32.9%) |
| 3 or more Vehicles | 289 (29.0%) | 87 (17.4%) |
| Total | 996 (100.0%) | 499 (100.0%) |
Real Estate & Mortgages in Marshall
Real Estate and Mortgage Overview in Marshall
| Characteristic | Without Mortgage | With Mortgage |
| Housing Units | 199 | 797 |
| Median Property Value | - | - |
| Median Household Income | $49,583 | $148 |
| Monthly Housing Costs | $664 | $16 |
| Real Estate Taxes | - | - |
Property Value by Mortgage Status in Marshall
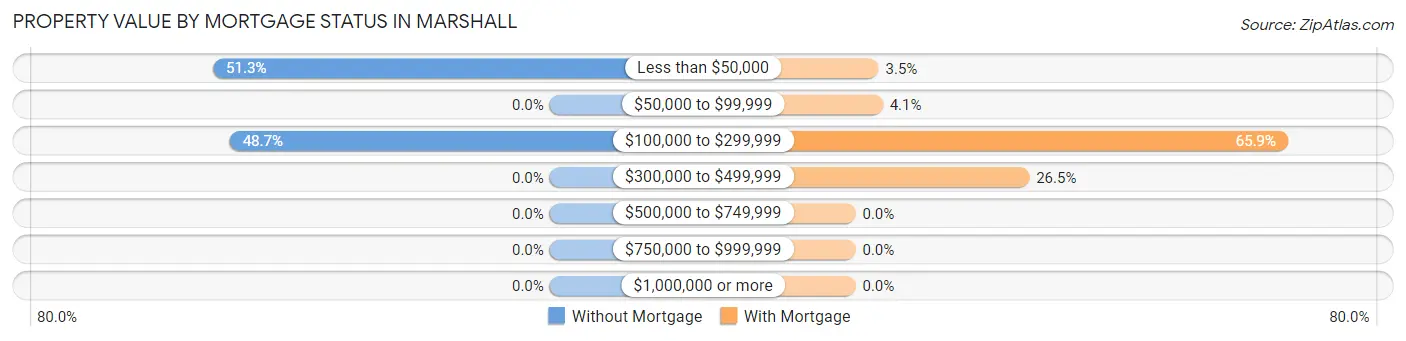
| Property Value | Without Mortgage | With Mortgage |
| Less than $50,000 | 102 (51.3%) | 28 (3.5%) |
| $50,000 to $99,999 | 0 (0.0%) | 33 (4.1%) |
| $100,000 to $299,999 | 97 (48.7%) | 525 (65.9%) |
| $300,000 to $499,999 | 0 (0.0%) | 211 (26.5%) |
| $500,000 to $749,999 | 0 (0.0%) | 0 (0.0%) |
| $750,000 to $999,999 | 0 (0.0%) | 0 (0.0%) |
| $1,000,000 or more | 0 (0.0%) | 0 (0.0%) |
| Total | 199 (100.0%) | 797 (100.0%) |
Household Income by Mortgage Status in Marshall
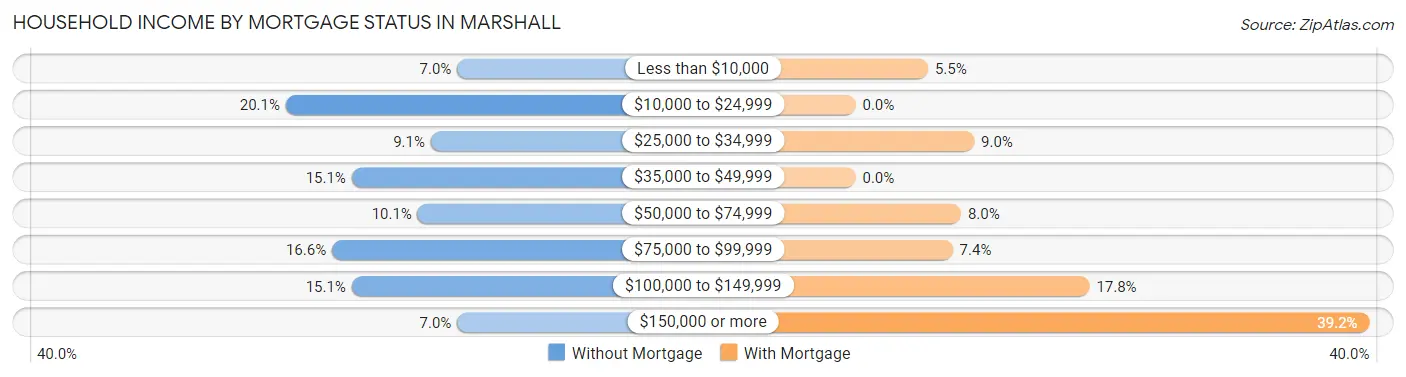
| Household Income | Without Mortgage | With Mortgage |
| Less than $10,000 | 14 (7.0%) | 44 (5.5%) |
| $10,000 to $24,999 | 40 (20.1%) | 0 (0.0%) |
| $25,000 to $34,999 | 18 (9.0%) | 72 (9.0%) |
| $35,000 to $49,999 | 30 (15.1%) | 0 (0.0%) |
| $50,000 to $74,999 | 20 (10.1%) | 64 (8.0%) |
| $75,000 to $99,999 | 33 (16.6%) | 59 (7.4%) |
| $100,000 to $149,999 | 30 (15.1%) | 142 (17.8%) |
| $150,000 or more | 14 (7.0%) | 312 (39.2%) |
| Total | 199 (100.0%) | 797 (100.0%) |
Property Value to Household Income Ratio in Marshall
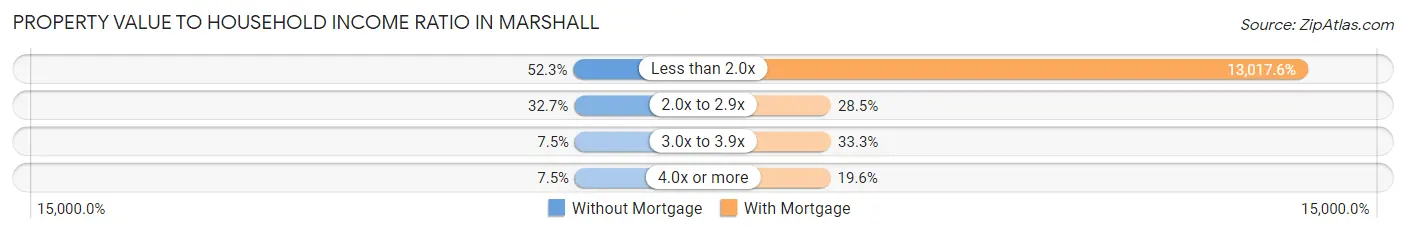
| Value-to-Income Ratio | Without Mortgage | With Mortgage |
| Less than 2.0x | 104 (52.3%) | 103,750 (13,017.6%) |
| 2.0x to 2.9x | 65 (32.7%) | 227 (28.5%) |
| 3.0x to 3.9x | 15 (7.5%) | 265 (33.3%) |
| 4.0x or more | 15 (7.5%) | 156 (19.6%) |
| Total | 199 (100.0%) | 797 (100.0%) |
Real Estate Taxes by Mortgage Status in Marshall
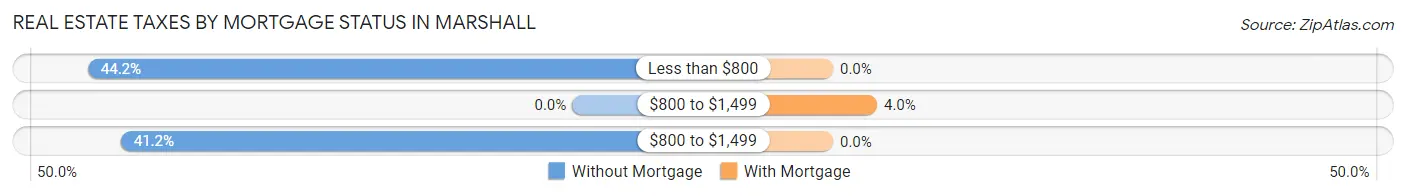
| Property Taxes | Without Mortgage | With Mortgage |
| Less than $800 | 88 (44.2%) | 0 (0.0%) |
| $800 to $1,499 | 0 (0.0%) | 32 (4.0%) |
| $800 to $1,499 | 82 (41.2%) | 0 (0.0%) |
| Total | 199 (100.0%) | 797 (100.0%) |
Health & Disability in Marshall
Health Insurance Coverage by Age in Marshall
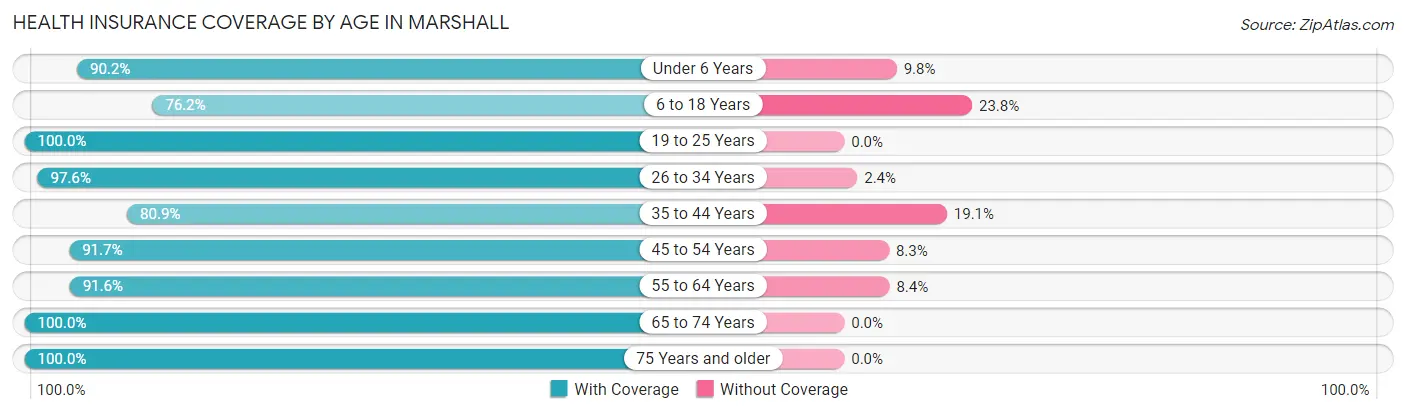
| Age Bracket | With Coverage | Without Coverage |
| Under 6 Years | 286 (90.2%) | 31 (9.8%) |
| 6 to 18 Years | 355 (76.2%) | 111 (23.8%) |
| 19 to 25 Years | 366 (100.0%) | 0 (0.0%) |
| 26 to 34 Years | 644 (97.6%) | 16 (2.4%) |
| 35 to 44 Years | 465 (80.9%) | 110 (19.1%) |
| 45 to 54 Years | 539 (91.7%) | 49 (8.3%) |
| 55 to 64 Years | 446 (91.6%) | 41 (8.4%) |
| 65 to 74 Years | 267 (100.0%) | 0 (0.0%) |
| 75 Years and older | 69 (100.0%) | 0 (0.0%) |
| Total | 3,437 (90.6%) | 358 (9.4%) |
Health Insurance Coverage by Citizenship Status in Marshall
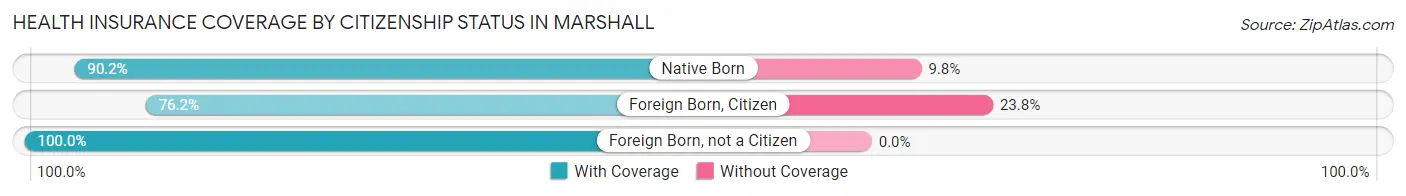
| Citizenship Status | With Coverage | Without Coverage |
| Native Born | 286 (90.2%) | 31 (9.8%) |
| Foreign Born, Citizen | 355 (76.2%) | 111 (23.8%) |
| Foreign Born, not a Citizen | 366 (100.0%) | 0 (0.0%) |
Health Insurance Coverage by Household Income in Marshall
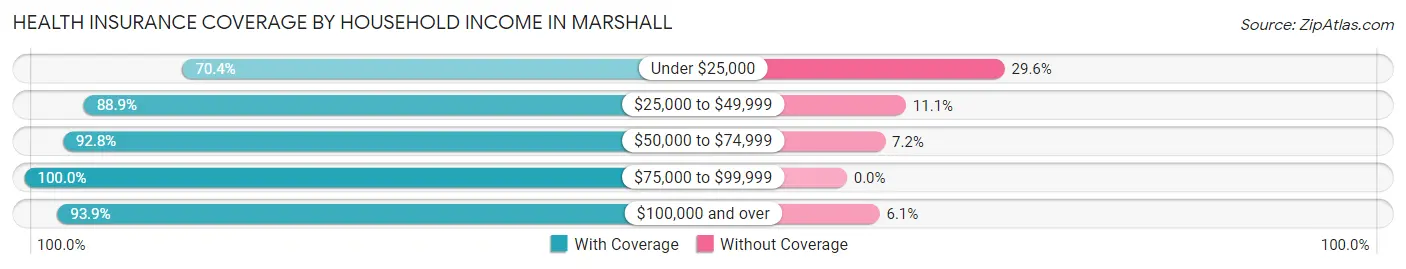
| Household Income | With Coverage | Without Coverage |
| Under $25,000 | 424 (70.4%) | 178 (29.6%) |
| $25,000 to $49,999 | 377 (88.9%) | 47 (11.1%) |
| $50,000 to $74,999 | 478 (92.8%) | 37 (7.2%) |
| $75,000 to $99,999 | 675 (100.0%) | 0 (0.0%) |
| $100,000 and over | 1,467 (93.9%) | 96 (6.1%) |
Public vs Private Health Insurance Coverage by Age in Marshall
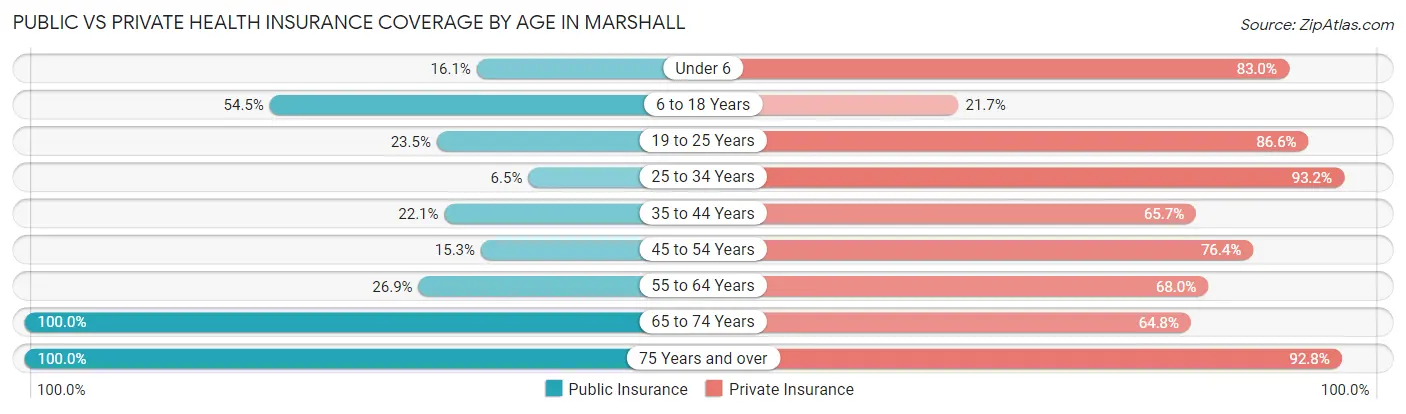
| Age Bracket | Public Insurance | Private Insurance |
| Under 6 | 51 (16.1%) | 263 (83.0%) |
| 6 to 18 Years | 254 (54.5%) | 101 (21.7%) |
| 19 to 25 Years | 86 (23.5%) | 317 (86.6%) |
| 25 to 34 Years | 43 (6.5%) | 615 (93.2%) |
| 35 to 44 Years | 127 (22.1%) | 378 (65.7%) |
| 45 to 54 Years | 90 (15.3%) | 449 (76.4%) |
| 55 to 64 Years | 131 (26.9%) | 331 (68.0%) |
| 65 to 74 Years | 267 (100.0%) | 173 (64.8%) |
| 75 Years and over | 69 (100.0%) | 64 (92.7%) |
| Total | 1,118 (29.5%) | 2,691 (70.9%) |
Disability Status by Sex by Age in Marshall
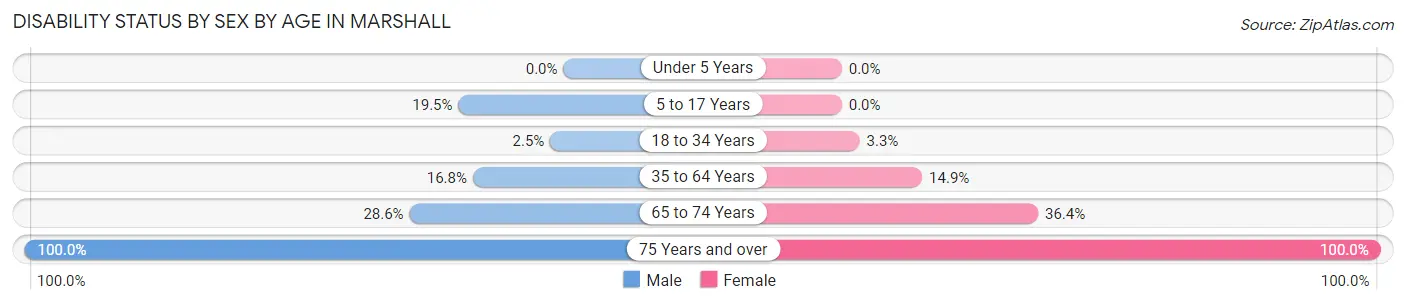
| Age Bracket | Male | Female |
| Under 5 Years | 0 (0.0%) | 0 (0.0%) |
| 5 to 17 Years | 54 (19.5%) | 0 (0.0%) |
| 18 to 34 Years | 14 (2.5%) | 15 (3.3%) |
| 35 to 64 Years | 123 (16.8%) | 137 (14.9%) |
| 65 to 74 Years | 30 (28.6%) | 59 (36.4%) |
| 75 Years and over | 35 (100.0%) | 34 (100.0%) |
Disability Class by Sex by Age in Marshall
Disability Class: Hearing Difficulty
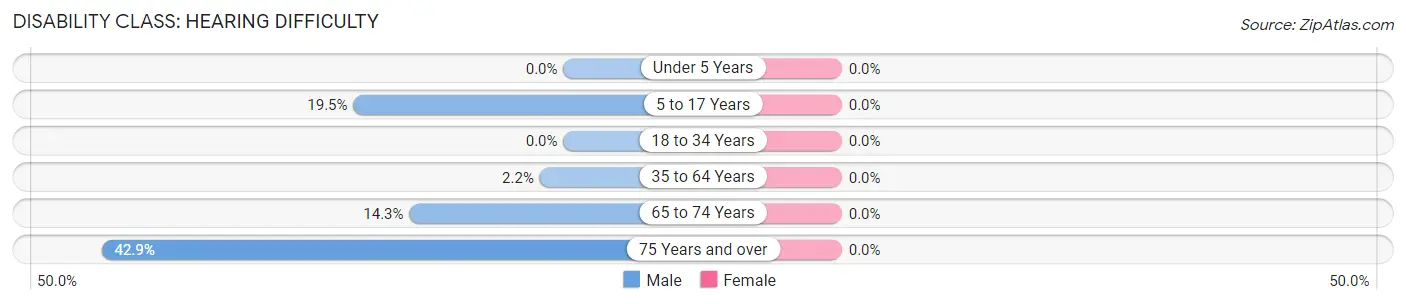
| Age Bracket | Male | Female |
| Under 5 Years | 0 (0.0%) | 0 (0.0%) |
| 5 to 17 Years | 54 (19.5%) | 0 (0.0%) |
| 18 to 34 Years | 0 (0.0%) | 0 (0.0%) |
| 35 to 64 Years | 16 (2.2%) | 0 (0.0%) |
| 65 to 74 Years | 15 (14.3%) | 0 (0.0%) |
| 75 Years and over | 15 (42.9%) | 0 (0.0%) |
Disability Class: Vision Difficulty
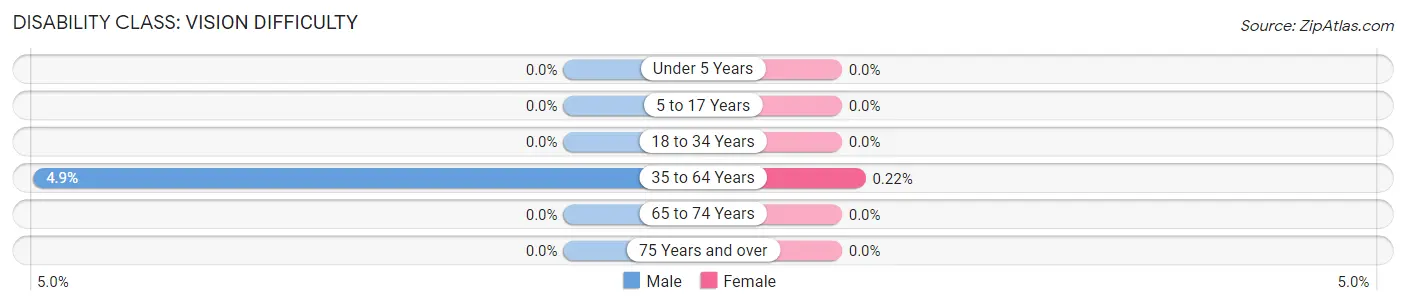
| Age Bracket | Male | Female |
| Under 5 Years | 0 (0.0%) | 0 (0.0%) |
| 5 to 17 Years | 0 (0.0%) | 0 (0.0%) |
| 18 to 34 Years | 0 (0.0%) | 0 (0.0%) |
| 35 to 64 Years | 36 (4.9%) | 2 (0.2%) |
| 65 to 74 Years | 0 (0.0%) | 0 (0.0%) |
| 75 Years and over | 0 (0.0%) | 0 (0.0%) |
Disability Class: Cognitive Difficulty
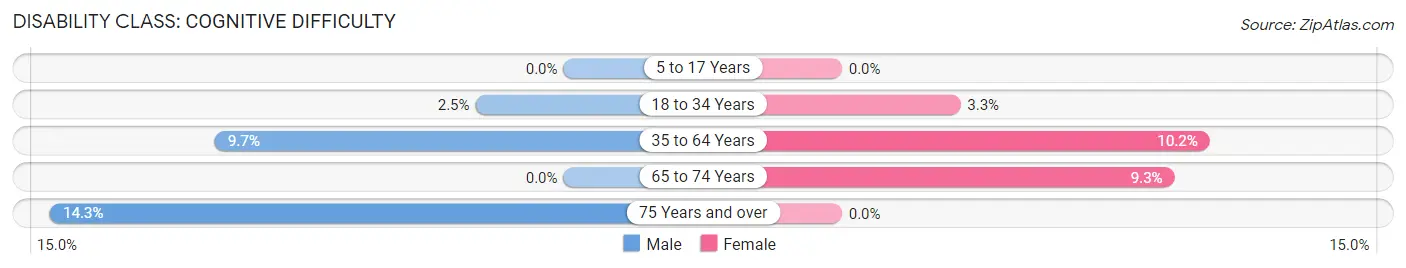
| Age Bracket | Male | Female |
| 5 to 17 Years | 0 (0.0%) | 0 (0.0%) |
| 18 to 34 Years | 14 (2.5%) | 15 (3.3%) |
| 35 to 64 Years | 71 (9.7%) | 94 (10.2%) |
| 65 to 74 Years | 0 (0.0%) | 15 (9.3%) |
| 75 Years and over | 5 (14.3%) | 0 (0.0%) |
Disability Class: Ambulatory Difficulty
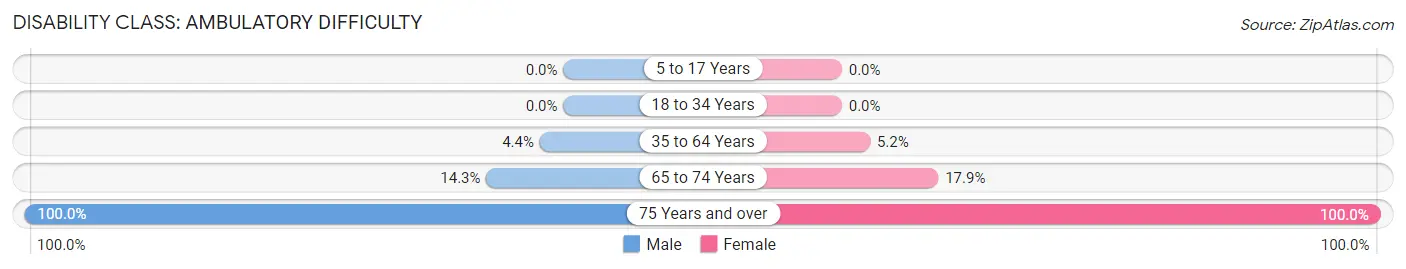
| Age Bracket | Male | Female |
| 5 to 17 Years | 0 (0.0%) | 0 (0.0%) |
| 18 to 34 Years | 0 (0.0%) | 0 (0.0%) |
| 35 to 64 Years | 32 (4.4%) | 48 (5.2%) |
| 65 to 74 Years | 15 (14.3%) | 29 (17.9%) |
| 75 Years and over | 35 (100.0%) | 34 (100.0%) |
Disability Class: Self-Care Difficulty
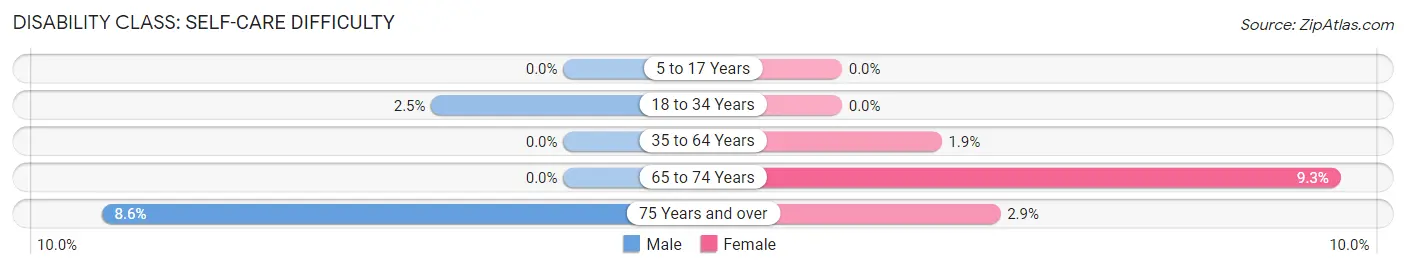
| Age Bracket | Male | Female |
| 5 to 17 Years | 0 (0.0%) | 0 (0.0%) |
| 18 to 34 Years | 14 (2.5%) | 0 (0.0%) |
| 35 to 64 Years | 0 (0.0%) | 17 (1.8%) |
| 65 to 74 Years | 0 (0.0%) | 15 (9.3%) |
| 75 Years and over | 3 (8.6%) | 1 (2.9%) |
Technology Access in Marshall
Computing Device Access in Marshall
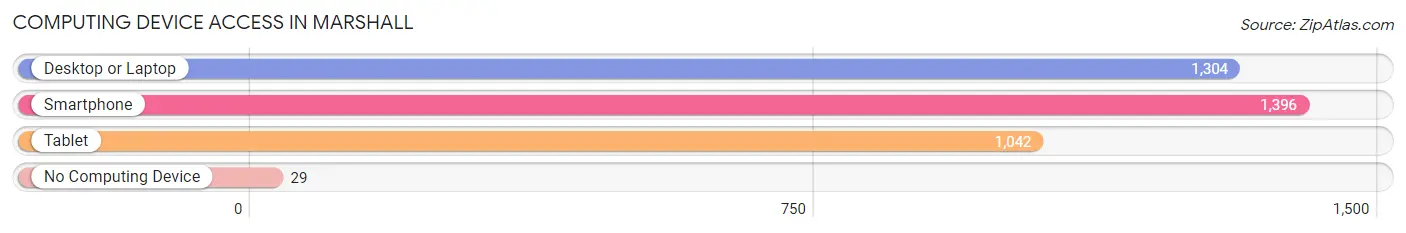
| Device Type | # Households | % Households |
| Desktop or Laptop | 1,304 | 87.2% |
| Smartphone | 1,396 | 93.4% |
| Tablet | 1,042 | 69.7% |
| No Computing Device | 29 | 1.9% |
| Total | 1,495 | 100.0% |
Internet Access in Marshall
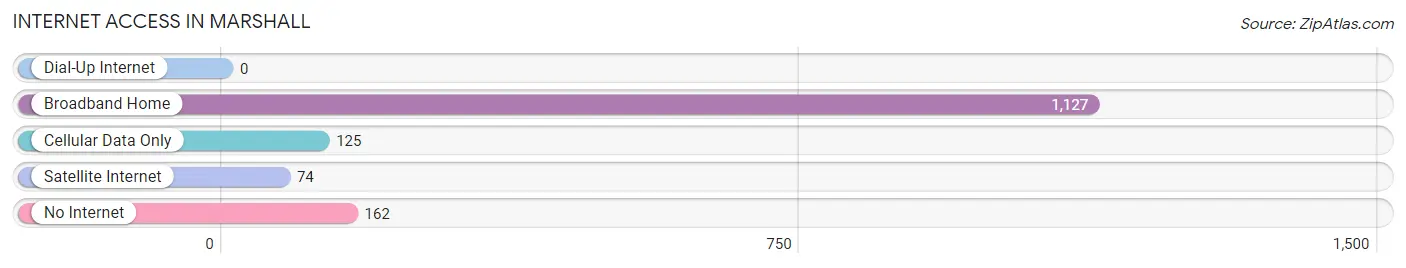
| Internet Type | # Households | % Households |
| Dial-Up Internet | 0 | 0.0% |
| Broadband Home | 1,127 | 75.4% |
| Cellular Data Only | 125 | 8.4% |
| Satellite Internet | 74 | 5.0% |
| No Internet | 162 | 10.8% |
| Total | 1,495 | 100.0% |
Marshall Summary
Marshall, Wisconsin is a small city located in Dane County, Wisconsin. It is situated on the banks of the Yahara River, about 20 miles northwest of Madison. The city has a population of approximately 8,000 people and is part of the Madison Metropolitan Statistical Area.
History
Marshall was founded in 1856 by a group of settlers from New York. The city was named after Chief Justice John Marshall, who served on the Supreme Court from 1801 to 1835. The city was incorporated in 1872 and has since grown to become a thriving community.
The city was originally a farming community, but in the late 19th century, it began to develop into an industrial center. The first industry to come to Marshall was a paper mill, which was established in 1883. This was followed by a number of other industries, including a flour mill, a creamery, a brewery, and a canning factory.
In the early 20th century, Marshall was a major center for the dairy industry. The city was home to several large dairy farms, and the local economy was heavily dependent on the dairy industry. In the 1950s, the city began to diversify its economy, and today it is home to a variety of businesses, including manufacturing, retail, and service industries.
Geography
Marshall is located in Dane County, Wisconsin, about 20 miles northwest of Madison. The city is situated on the banks of the Yahara River, and is surrounded by rolling hills and farmland. The city has a total area of 4.2 square miles, and the elevation is 845 feet above sea level.
The climate in Marshall is classified as humid continental, with cold winters and warm summers. The average annual temperature is 45 degrees Fahrenheit, and the average annual precipitation is 33 inches.
Economy
Marshall’s economy is largely based on manufacturing, retail, and service industries. The city is home to several large manufacturing companies, including a paper mill, a flour mill, a creamery, a brewery, and a canning factory.
Retail and service industries are also important to the local economy. The city is home to several large retail stores, as well as a variety of restaurants, bars, and other businesses.
Demographics
As of the 2010 census, the population of Marshall was 8,068. The racial makeup of the city was 94.3% White, 1.2% African American, 0.4% Native American, 0.7% Asian, 0.1% Pacific Islander, 1.7% from other races, and 1.8% from two or more races. Hispanic or Latino of any race were 4.2% of the population.
The median household income in Marshall was $50,945, and the median family income was $62,917. The per capita income was $25,945. About 8.3% of families and 10.7% of the population were below the poverty line, including 14.2% of those under age 18 and 6.2% of those age 65 or over.
Common Questions
What is Per Capita Income in Marshall?
Per Capita income in Marshall is $31,924.
What is the Median Family Income in Marshall?
Median Family Income in Marshall is $81,667.
What is the Median Household income in Marshall?
Median Household Income in Marshall is $79,308.
What is Income or Wage Gap in Marshall?
Income or Wage Gap in Marshall is 10.6%.
Women in Marshall earn 89.4 cents for every dollar earned by a man.
What is Inequality or Gini Index in Marshall?
Inequality or Gini Index in Marshall is 0.37.
What is the Total Population of Marshall?
Total Population of Marshall is 3,818.
What is the Total Male Population of Marshall?
Total Male Population of Marshall is 1,937.
What is the Total Female Population of Marshall?
Total Female Population of Marshall is 1,881.
What is the Ratio of Males per 100 Females in Marshall?
There are 102.98 Males per 100 Females in Marshall.
What is the Ratio of Females per 100 Males in Marshall?
There are 97.11 Females per 100 Males in Marshall.
What is the Median Population Age in Marshall?
Median Population Age in Marshall is 36.0 Years.
What is the Average Family Size in Marshall
Average Family Size in Marshall is 2.9 People.
What is the Average Household Size in Marshall
Average Household Size in Marshall is 2.5 People.
How Large is the Labor Force in Marshall?
There are 2,484 People in the Labor Forcein in Marshall.
What is the Percentage of People in the Labor Force in Marshall?
80.9% of People are in the Labor Force in Marshall.
What is the Unemployment Rate in Marshall?
Unemployment Rate in Marshall is 3.9%.