St Peter, WI Map & Demographics
St Peter Map
St Peter Overview
$55,926
PER CAPITA INCOME
$149,808
AVG FAMILY INCOME
$153,188
AVG HOUSEHOLD INCOME
40.4%
WAGE / INCOME GAP [ % ]
59.6¢/ $1
WAGE / INCOME GAP [ $ ]
0.24
INEQUALITY / GINI INDEX
1,365
TOTAL POPULATION
745
MALE POPULATION
620
FEMALE POPULATION
120.16
MALES / 100 FEMALES
83.22
FEMALES / 100 MALES
46.3
MEDIAN AGE
2.9
AVG FAMILY SIZE
2.5
AVG HOUSEHOLD SIZE
734
LABOR FORCE [ PEOPLE ]
69.8%
PERCENT IN LABOR FORCE
1.2%
UNEMPLOYMENT RATE
Income in St Peter
Income Overview in St Peter
Per Capita Income in St Peter is $55,926, while median incomes of families and households are $149,808 and $153,188 respectively.
| Characteristic | Number | Measure |
| Per Capita Income | 1,365 | $55,926 |
| Median Family Income | 410 | $149,808 |
| Mean Family Income | 410 | $142,597 |
| Median Household Income | 555 | $153,188 |
| Mean Household Income | 555 | $138,019 |
| Income Deficit | 410 | $0 |
| Wage / Income Gap (%) | 1,365 | 40.44% |
| Wage / Income Gap ($) | 1,365 | 59.56¢ per $1 |
| Gini / Inequality Index | 1,365 | 0.24 |
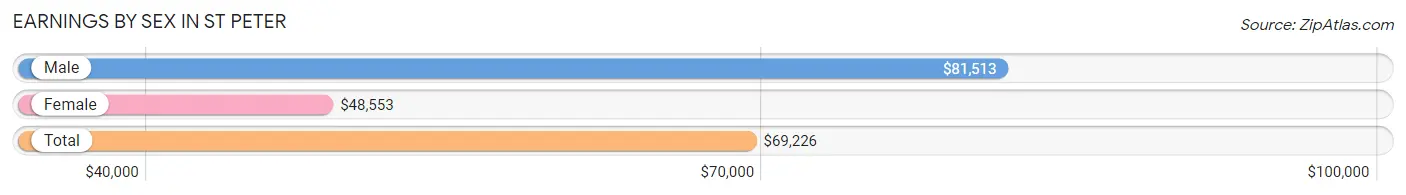
Earnings by Sex in St Peter
Average Earnings in St Peter are $69,226, $81,513 for men and $48,553 for women, a difference of 40.4%.
| Sex | Number | Average Earnings |
| Male | 407 (50.1%) | $81,513 |
| Female | 406 (49.9%) | $48,553 |
| Total | 813 (100.0%) | $69,226 |
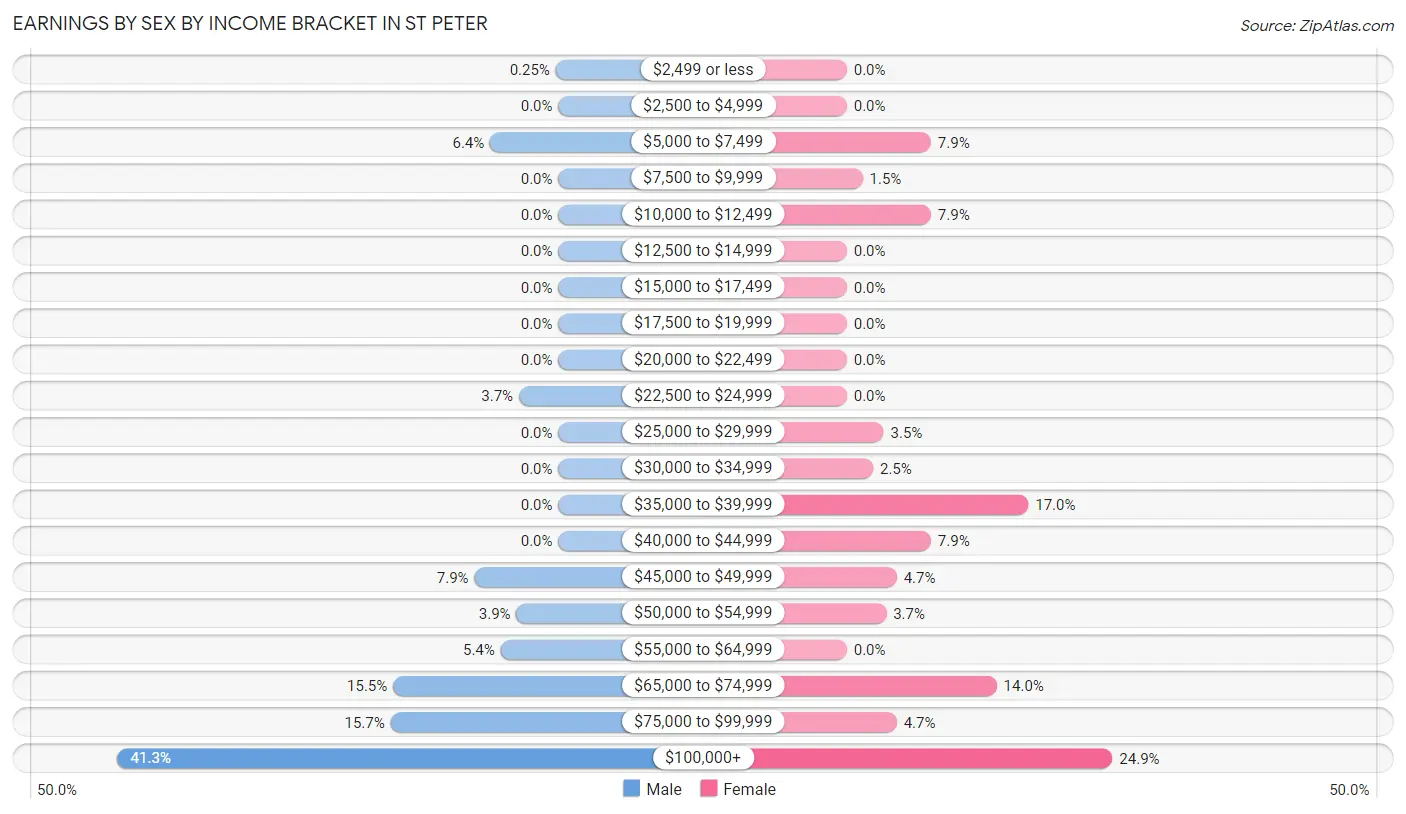
Earnings by Sex by Income Bracket in St Peter
The most common earnings brackets in St Peter are $100,000+ for men (168 | 41.3%) and $100,000+ for women (101 | 24.9%).
| Income | Male | Female |
| $2,499 or less | 1 (0.3%) | 0 (0.0%) |
| $2,500 to $4,999 | 0 (0.0%) | 0 (0.0%) |
| $5,000 to $7,499 | 26 (6.4%) | 32 (7.9%) |
| $7,500 to $9,999 | 0 (0.0%) | 6 (1.5%) |
| $10,000 to $12,499 | 0 (0.0%) | 32 (7.9%) |
| $12,500 to $14,999 | 0 (0.0%) | 0 (0.0%) |
| $15,000 to $17,499 | 0 (0.0%) | 0 (0.0%) |
| $17,500 to $19,999 | 0 (0.0%) | 0 (0.0%) |
| $20,000 to $22,499 | 0 (0.0%) | 0 (0.0%) |
| $22,500 to $24,999 | 15 (3.7%) | 0 (0.0%) |
| $25,000 to $29,999 | 0 (0.0%) | 14 (3.5%) |
| $30,000 to $34,999 | 0 (0.0%) | 10 (2.5%) |
| $35,000 to $39,999 | 0 (0.0%) | 69 (17.0%) |
| $40,000 to $44,999 | 0 (0.0%) | 32 (7.9%) |
| $45,000 to $49,999 | 32 (7.9%) | 19 (4.7%) |
| $50,000 to $54,999 | 16 (3.9%) | 15 (3.7%) |
| $55,000 to $64,999 | 22 (5.4%) | 0 (0.0%) |
| $65,000 to $74,999 | 63 (15.5%) | 57 (14.0%) |
| $75,000 to $99,999 | 64 (15.7%) | 19 (4.7%) |
| $100,000+ | 168 (41.3%) | 101 (24.9%) |
| Total | 407 (100.0%) | 406 (100.0%) |
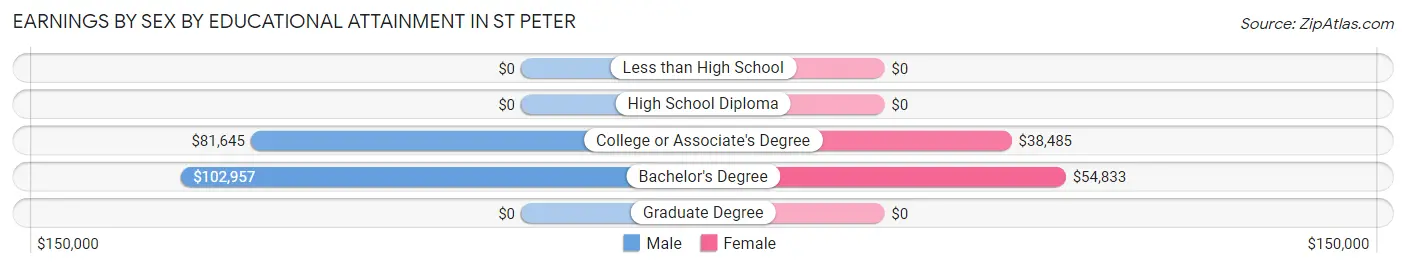
Earnings by Sex by Educational Attainment in St Peter
Average earnings in St Peter are $95,703 for men and $48,947 for women, a difference of 48.9%. Men with an educational attainment of bachelor's degree enjoy the highest average annual earnings of $102,957, while those with college or associate's degree education earn the least with $81,645. Women with an educational attainment of bachelor's degree earn the most with the average annual earnings of $54,833, while those with college or associate's degree education have the smallest earnings of $38,485.
| Educational Attainment | Male Income | Female Income |
| Less than High School | - | - |
| High School Diploma | - | - |
| College or Associate's Degree | $81,645 | $38,485 |
| Bachelor's Degree | $102,957 | $54,833 |
| Graduate Degree | - | - |
| Total | $95,703 | $48,947 |
Family Income in St Peter
Family Income Brackets in St Peter
According to the St Peter family income data, there are 119 families falling into the $150,000 to $199,999 income range, which is the most common income bracket and makes up 29.0% of all families.
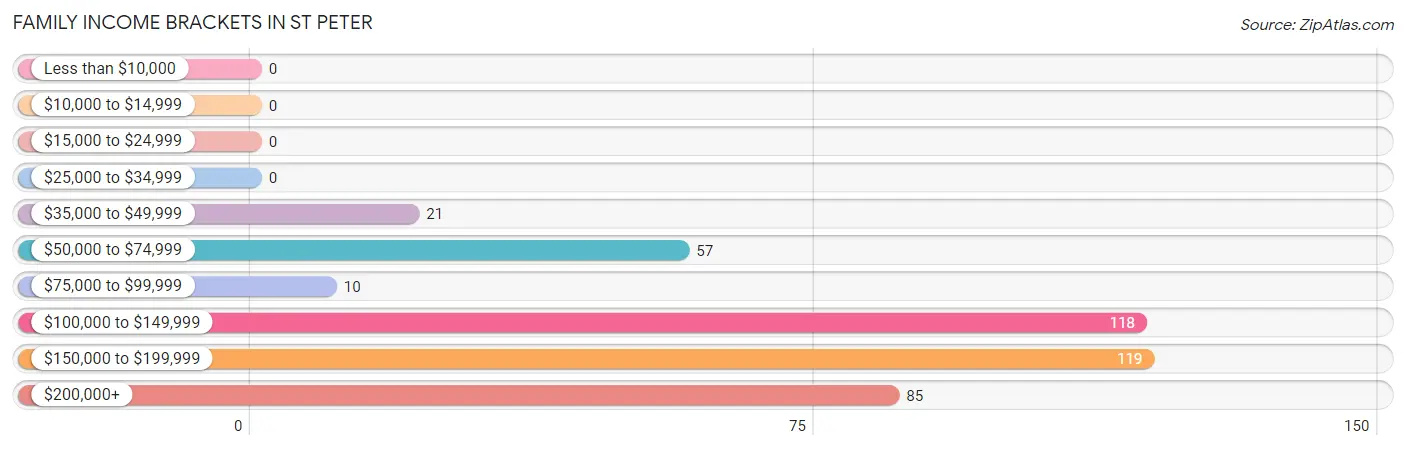
| Income Bracket | # Families | % Families |
| Less than $10,000 | 0 | 0.0% |
| $10,000 to $14,999 | 0 | 0.0% |
| $15,000 to $24,999 | 0 | 0.0% |
| $25,000 to $34,999 | 0 | 0.0% |
| $35,000 to $49,999 | 21 | 5.1% |
| $50,000 to $74,999 | 57 | 13.9% |
| $75,000 to $99,999 | 10 | 2.4% |
| $100,000 to $149,999 | 118 | 28.8% |
| $150,000 to $199,999 | 119 | 29.0% |
| $200,000+ | 85 | 20.7% |
Family Income by Famaliy Size in St Peter
3-person families (127 | 31.0%) account for the highest median family income in St Peter with $175,179 per family, while 2-person families (186 | 45.4%) have the highest median income of $77,000 per family member.
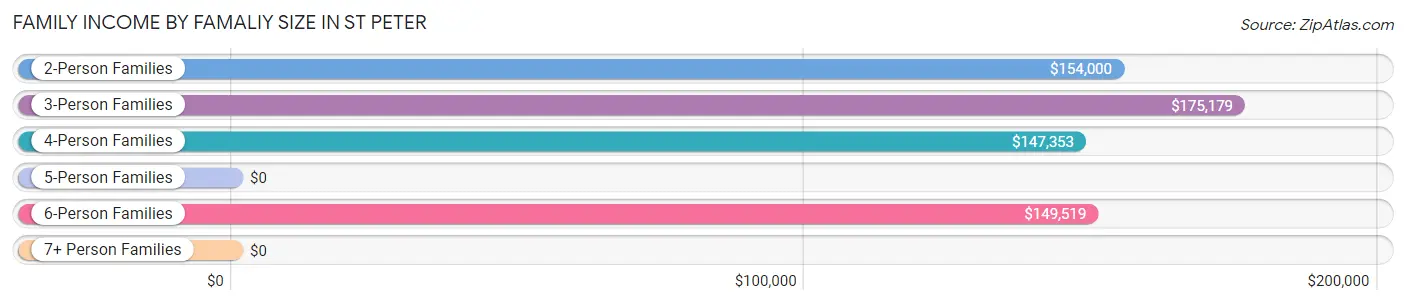
| Income Bracket | # Families | Median Income |
| 2-Person Families | 186 (45.4%) | $154,000 |
| 3-Person Families | 127 (31.0%) | $175,179 |
| 4-Person Families | 54 (13.2%) | $147,353 |
| 5-Person Families | 14 (3.4%) | $0 |
| 6-Person Families | 21 (5.1%) | $149,519 |
| 7+ Person Families | 8 (1.9%) | $0 |
| Total | 410 (100.0%) | $149,808 |
Family Income by Number of Earners in St Peter
The median family income in St Peter is $149,808, with families comprising 2 earners (202) having the highest median family income of $163,750, while families with no earners (63) have the lowest median family income of $54,886, accounting for 49.3% and 15.4% of families, respectively.
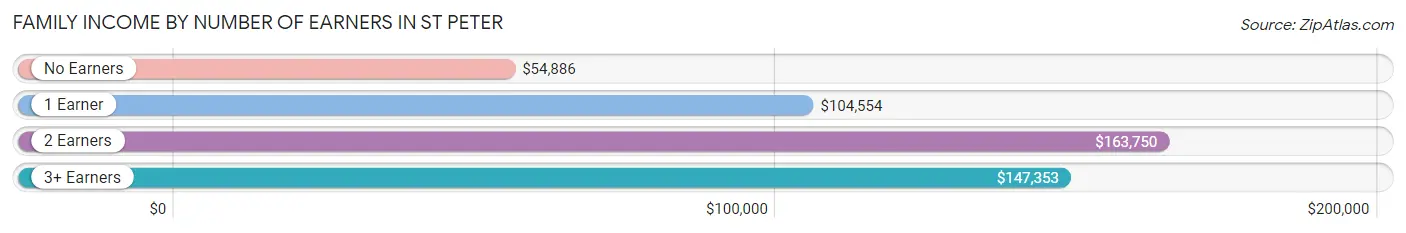
| Number of Earners | # Families | Median Income |
| No Earners | 63 (15.4%) | $54,886 |
| 1 Earner | 87 (21.2%) | $104,554 |
| 2 Earners | 202 (49.3%) | $163,750 |
| 3+ Earners | 58 (14.1%) | $147,353 |
| Total | 410 (100.0%) | $149,808 |
Household Income in St Peter
Household Income Brackets in St Peter
With 198 households falling in the category, the $150,000 to $199,999 income range is the most frequent in St Peter, accounting for 35.7% of all households.
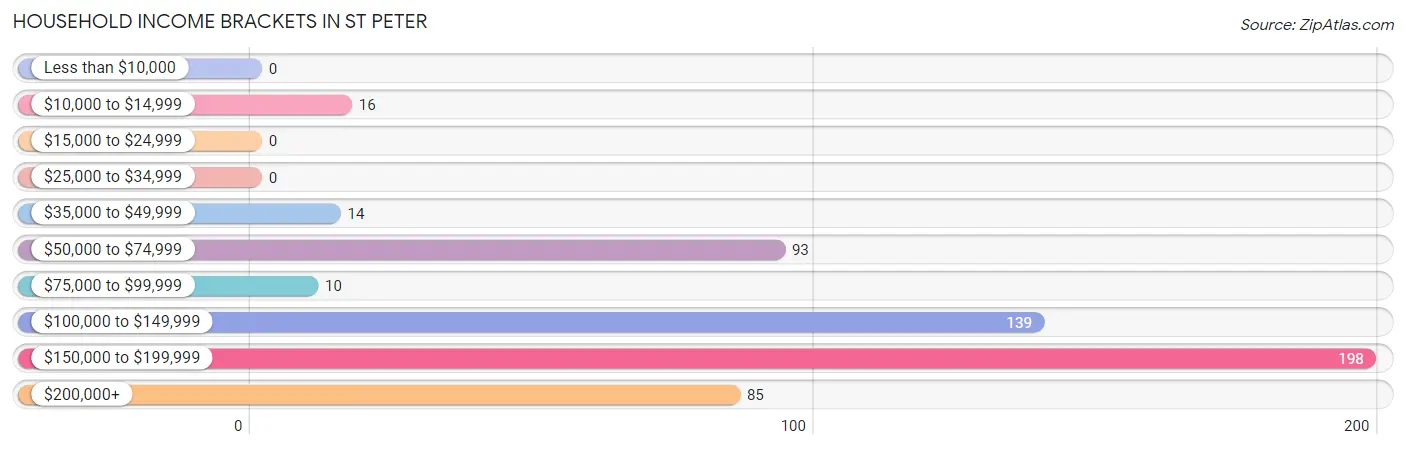
| Income Bracket | # Households | % Households |
| Less than $10,000 | 0 | 0.0% |
| $10,000 to $14,999 | 16 | 2.9% |
| $15,000 to $24,999 | 0 | 0.0% |
| $25,000 to $34,999 | 0 | 0.0% |
| $35,000 to $49,999 | 14 | 2.5% |
| $50,000 to $74,999 | 93 | 16.8% |
| $75,000 to $99,999 | 10 | 1.8% |
| $100,000 to $149,999 | 139 | 25.0% |
| $150,000 to $199,999 | 198 | 35.7% |
| $200,000+ | 85 | 15.3% |
Household Income by Householder Age in St Peter
The median household income in St Peter is $153,188, with the highest median household income of $166,250 found in the 45 to 64 years age bracket for the primary householder. A total of 206 households (37.1%) fall into this category. Meanwhile, the 15 to 24 years age bracket for the primary householder has the lowest median household income of $0, with 22 households (4.0%) in this group.
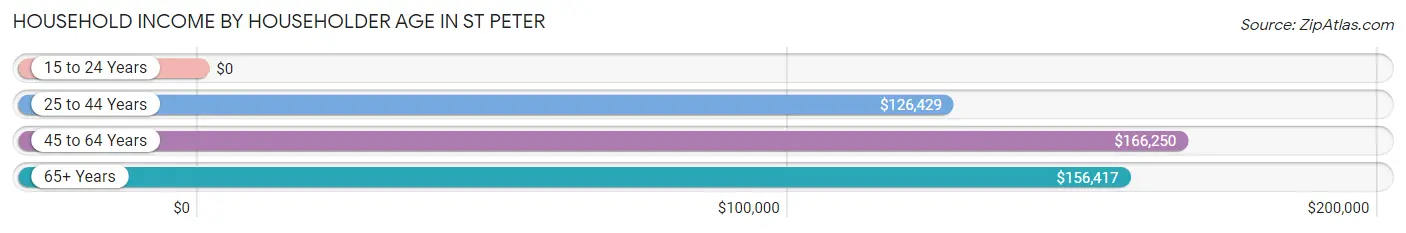
| Income Bracket | # Households | Median Income |
| 15 to 24 Years | 22 (4.0%) | $0 |
| 25 to 44 Years | 124 (22.3%) | $126,429 |
| 45 to 64 Years | 206 (37.1%) | $166,250 |
| 65+ Years | 203 (36.6%) | $156,417 |
| Total | 555 (100.0%) | $153,188 |
Poverty in St Peter
Income Below Poverty by Sex and Age in St Peter
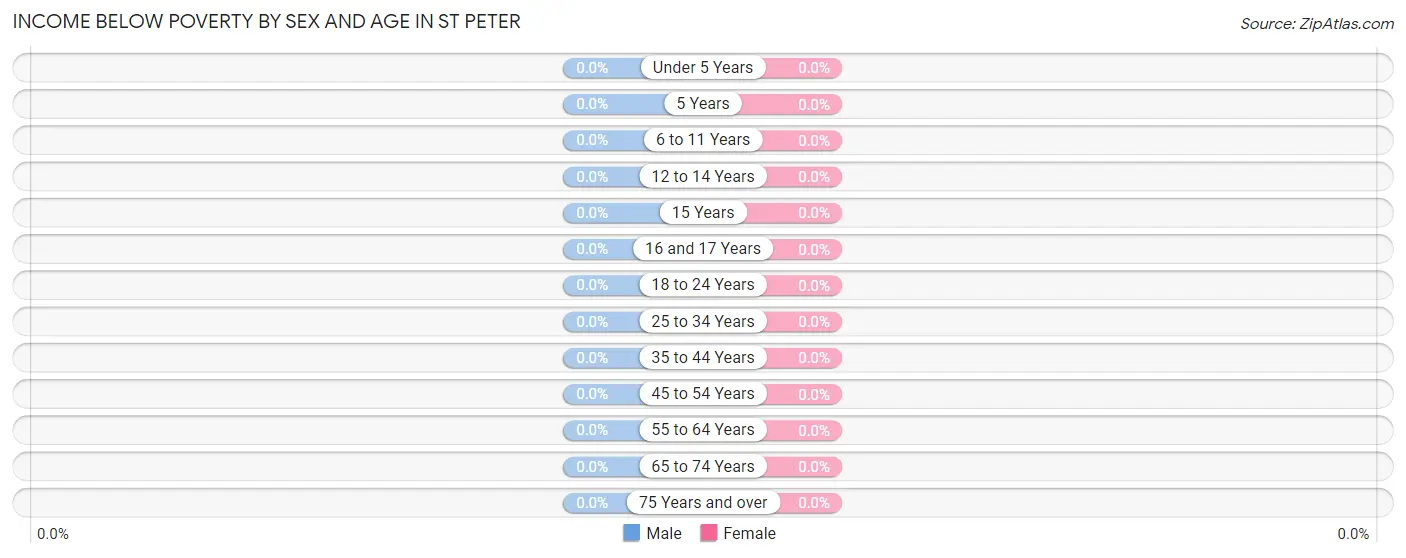
| Age Bracket | Male | Female |
| Under 5 Years | 0 (0.0%) | 0 (0.0%) |
| 5 Years | 0 (0.0%) | 0 (0.0%) |
| 6 to 11 Years | 0 (0.0%) | 0 (0.0%) |
| 12 to 14 Years | 0 (0.0%) | 0 (0.0%) |
| 15 Years | 0 (0.0%) | 0 (0.0%) |
| 16 and 17 Years | 0 (0.0%) | 0 (0.0%) |
| 18 to 24 Years | 0 (0.0%) | 0 (0.0%) |
| 25 to 34 Years | 0 (0.0%) | 0 (0.0%) |
| 35 to 44 Years | 0 (0.0%) | 0 (0.0%) |
| 45 to 54 Years | 0 (0.0%) | 0 (0.0%) |
| 55 to 64 Years | 0 (0.0%) | 0 (0.0%) |
| 65 to 74 Years | 0 (0.0%) | 0 (0.0%) |
| 75 Years and over | 0 (0.0%) | 0 (0.0%) |
| Total | 0 (0.0%) | 0 (0.0%) |
Income Above Poverty by Sex and Age in St Peter
According to the poverty statistics in St Peter, males aged under 5 years and females aged under 5 years are the age groups that are most secure financially, with 100.0% of males and 100.0% of females in these age groups living above the poverty line.
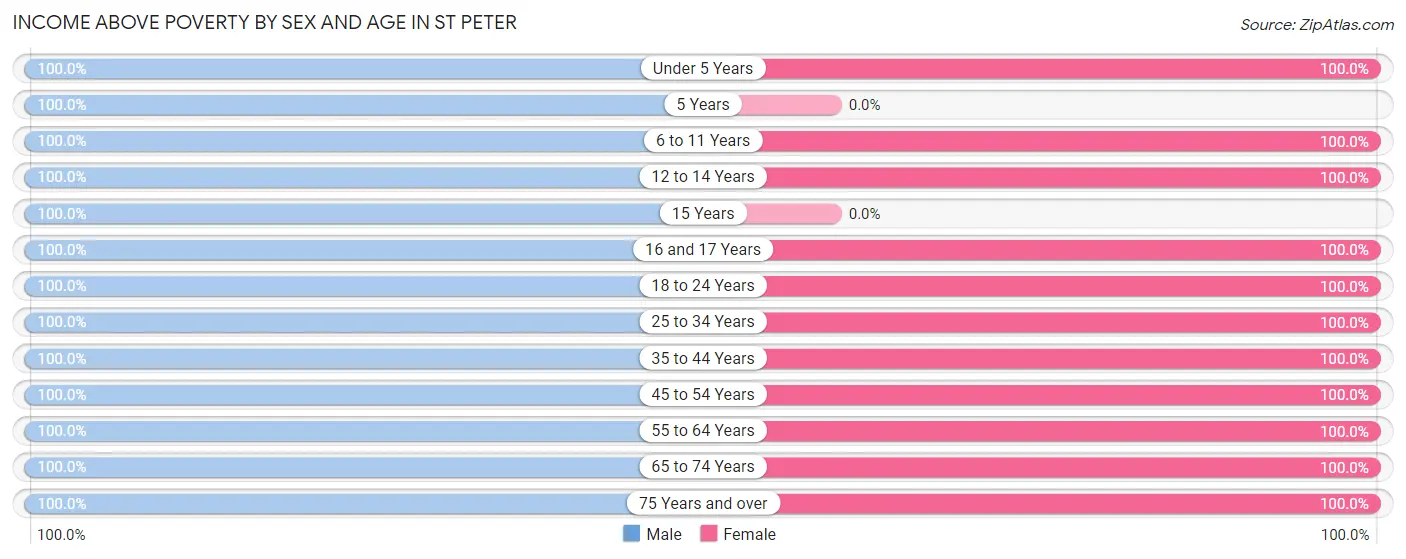
| Age Bracket | Male | Female |
| Under 5 Years | 90 (100.0%) | 32 (100.0%) |
| 5 Years | 11 (100.0%) | 0 (0.0%) |
| 6 to 11 Years | 63 (100.0%) | 28 (100.0%) |
| 12 to 14 Years | 27 (100.0%) | 27 (100.0%) |
| 15 Years | 21 (100.0%) | 0 (0.0%) |
| 16 and 17 Years | 30 (100.0%) | 11 (100.0%) |
| 18 to 24 Years | 31 (100.0%) | 6 (100.0%) |
| 25 to 34 Years | 82 (100.0%) | 95 (100.0%) |
| 35 to 44 Years | 31 (100.0%) | 54 (100.0%) |
| 45 to 54 Years | 157 (100.0%) | 106 (100.0%) |
| 55 to 64 Years | 109 (100.0%) | 60 (100.0%) |
| 65 to 74 Years | 36 (100.0%) | 151 (100.0%) |
| 75 Years and over | 42 (100.0%) | 50 (100.0%) |
| Total | 730 (100.0%) | 620 (100.0%) |
Income Below Poverty Among Married-Couple Families in St Peter
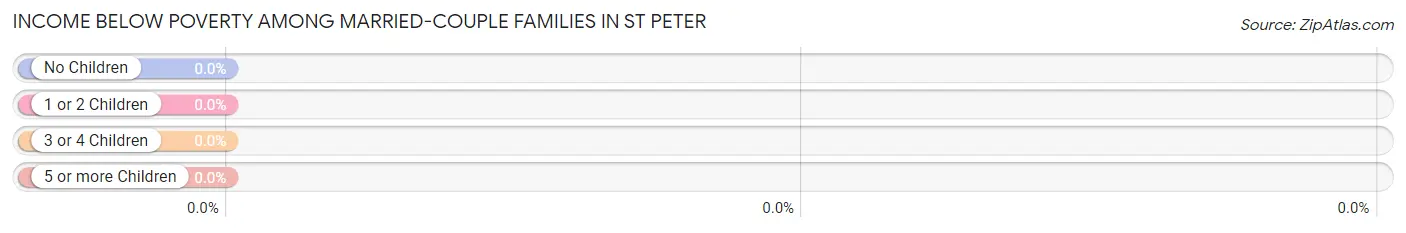
| Children | Above Poverty | Below Poverty |
| No Children | 216 (100.0%) | 0 (0.0%) |
| 1 or 2 Children | 103 (100.0%) | 0 (0.0%) |
| 3 or 4 Children | 35 (100.0%) | 0 (0.0%) |
| 5 or more Children | 8 (100.0%) | 0 (0.0%) |
| Total | 362 (100.0%) | 0 (0.0%) |
Income Below Poverty Among Single-Parent Households in St Peter
| Children | Single Father | Single Mother |
| No Children | 0 (0.0%) | 0 (0.0%) |
| 1 or 2 Children | 0 (0.0%) | 0 (0.0%) |
| 3 or 4 Children | 0 (0.0%) | 0 (0.0%) |
| 5 or more Children | 0 (0.0%) | 0 (0.0%) |
| Total | 0 (0.0%) | 0 (0.0%) |
Income Below Poverty Among Married-Couple vs Single-Parent Households in St Peter
| Children | Married-Couple Families | Single-Parent Households |
| No Children | 0 (0.0%) | 0 (0.0%) |
| 1 or 2 Children | 0 (0.0%) | 0 (0.0%) |
| 3 or 4 Children | 0 (0.0%) | 0 (0.0%) |
| 5 or more Children | 0 (0.0%) | 0 (0.0%) |
| Total | 0 (0.0%) | 0 (0.0%) |
Race in St Peter
The most populous races in St Peter are White / Caucasian (1,363 | 99.9%), Hispanic or Latino (14 | 1.0%), and Two or more Races (2 | 0.2%).
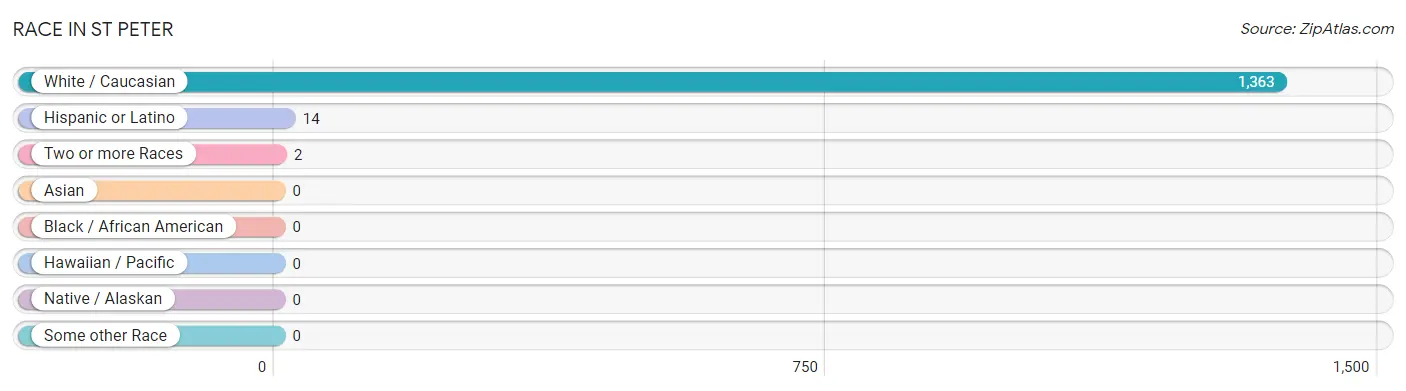
| Race | # Population | % Population |
| Asian | 0 | 0.0% |
| Black / African American | 0 | 0.0% |
| Hawaiian / Pacific | 0 | 0.0% |
| Hispanic or Latino | 14 | 1.0% |
| Native / Alaskan | 0 | 0.0% |
| White / Caucasian | 1,363 | 99.9% |
| Two or more Races | 2 | 0.2% |
| Some other Race | 0 | 0.0% |
| Total | 1,365 | 100.0% |
Ancestry in St Peter
The most populous ancestries reported in St Peter are German (707 | 51.8%), Irish (247 | 18.1%), English (171 | 12.5%), Dutch (90 | 6.6%), and French Canadian (75 | 5.5%), together accounting for 94.5% of all St Peter residents.
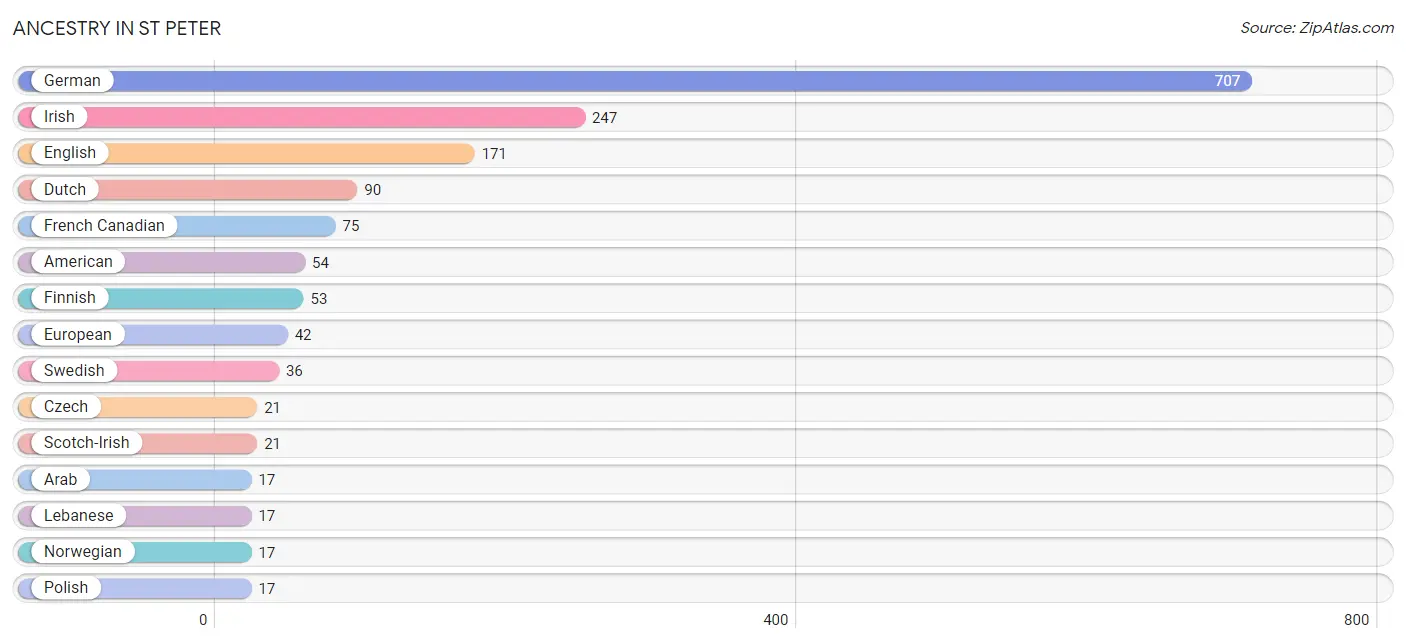
| Ancestry | # Population | % Population |
| American | 54 | 4.0% |
| Arab | 17 | 1.3% |
| Chilean | 14 | 1.0% |
| Czech | 21 | 1.5% |
| Dutch | 90 | 6.6% |
| English | 171 | 12.5% |
| European | 42 | 3.1% |
| Finnish | 53 | 3.9% |
| French | 15 | 1.1% |
| French Canadian | 75 | 5.5% |
| German | 707 | 51.8% |
| Irish | 247 | 18.1% |
| Lebanese | 17 | 1.3% |
| Norwegian | 17 | 1.3% |
| Polish | 17 | 1.3% |
| Scotch-Irish | 21 | 1.5% |
| South American | 14 | 1.0% |
| Swedish | 36 | 2.6% | View All 18 Rows |
Immigrants in St Peter
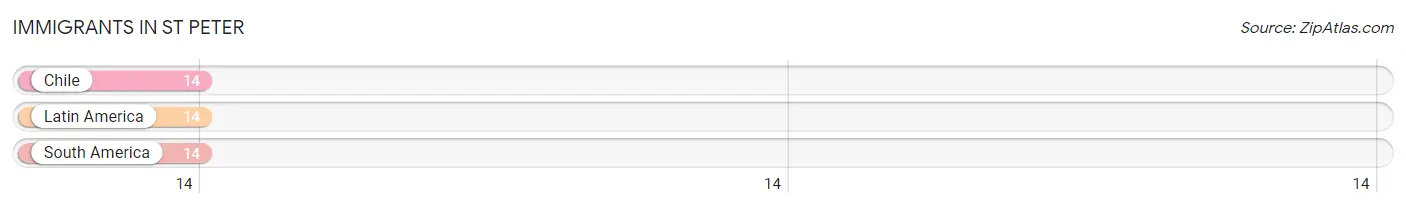
The most numerous immigrant groups reported in St Peter came from Chile (14 | 1.0%), Latin America (14 | 1.0%), and South America (14 | 1.0%), together accounting for 3.1% of all St Peter residents.
| Immigration Origin | # Population | % Population |
| Chile | 14 | 1.0% |
| Latin America | 14 | 1.0% |
| South America | 14 | 1.0% | View All 3 Rows |
Sex and Age in St Peter
Sex and Age in St Peter
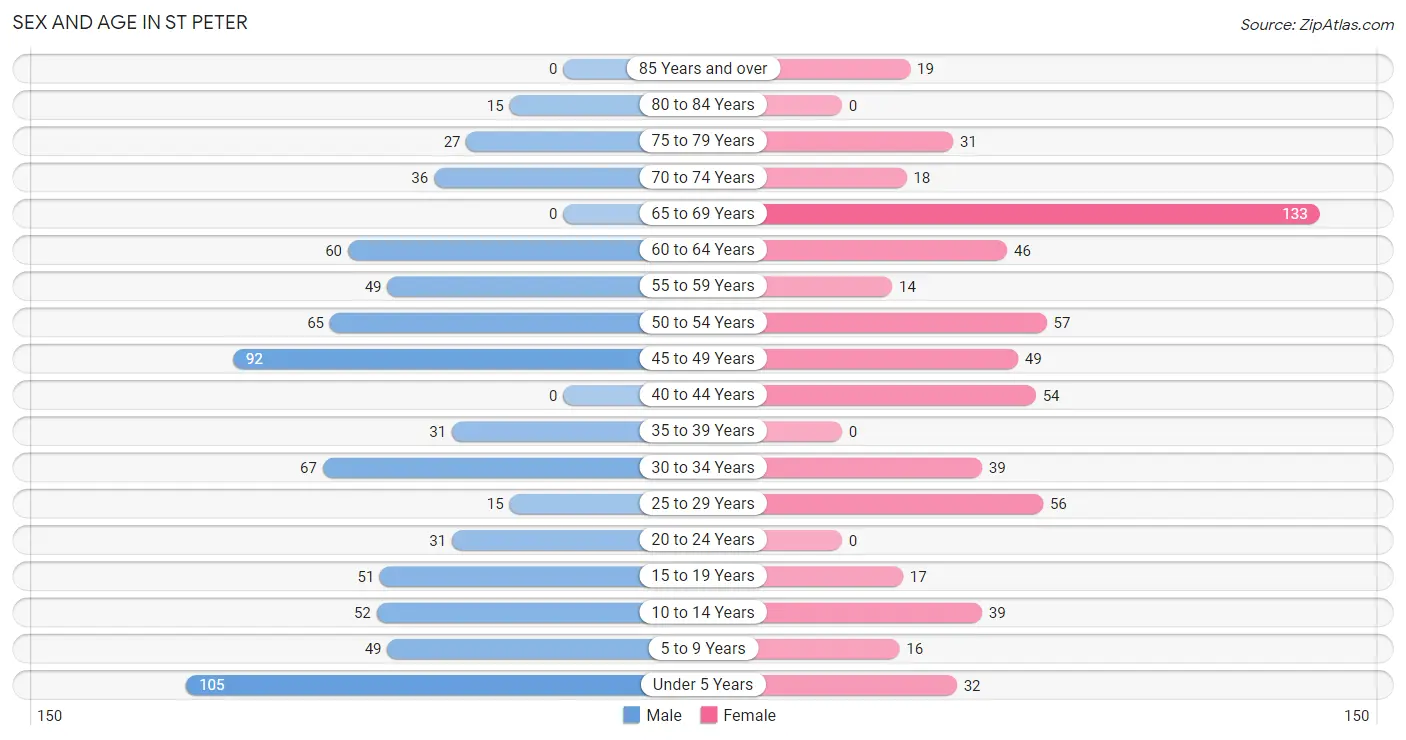
The most populous age groups in St Peter are Under 5 Years (105 | 14.1%) for men and 65 to 69 Years (133 | 21.4%) for women.
| Age Bracket | Male | Female |
| Under 5 Years | 105 (14.1%) | 32 (5.2%) |
| 5 to 9 Years | 49 (6.6%) | 16 (2.6%) |
| 10 to 14 Years | 52 (7.0%) | 39 (6.3%) |
| 15 to 19 Years | 51 (6.9%) | 17 (2.7%) |
| 20 to 24 Years | 31 (4.2%) | 0 (0.0%) |
| 25 to 29 Years | 15 (2.0%) | 56 (9.0%) |
| 30 to 34 Years | 67 (9.0%) | 39 (6.3%) |
| 35 to 39 Years | 31 (4.2%) | 0 (0.0%) |
| 40 to 44 Years | 0 (0.0%) | 54 (8.7%) |
| 45 to 49 Years | 92 (12.3%) | 49 (7.9%) |
| 50 to 54 Years | 65 (8.7%) | 57 (9.2%) |
| 55 to 59 Years | 49 (6.6%) | 14 (2.3%) |
| 60 to 64 Years | 60 (8.1%) | 46 (7.4%) |
| 65 to 69 Years | 0 (0.0%) | 133 (21.4%) |
| 70 to 74 Years | 36 (4.8%) | 18 (2.9%) |
| 75 to 79 Years | 27 (3.6%) | 31 (5.0%) |
| 80 to 84 Years | 15 (2.0%) | 0 (0.0%) |
| 85 Years and over | 0 (0.0%) | 19 (3.1%) |
| Total | 745 (100.0%) | 620 (100.0%) |
Families and Households in St Peter
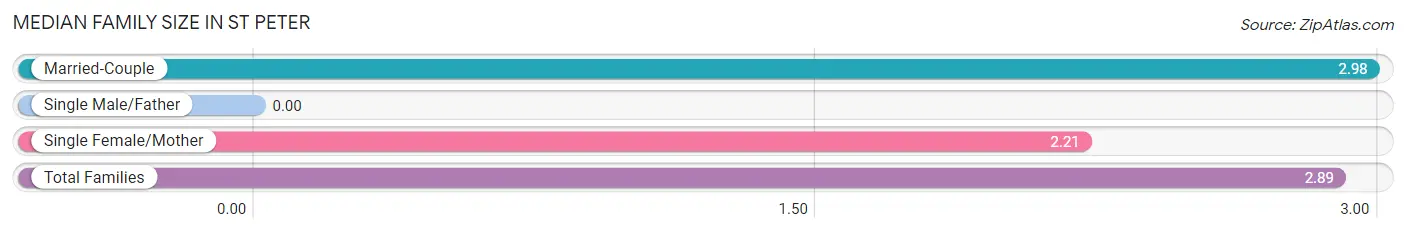
Median Family Size in St Peter
| Family Type | # Families | Family Size |
| Married-Couple | 362 (88.3%) | 2.98 |
| Single Male/Father | 0 (0.0%) | - |
| Single Female/Mother | 48 (11.7%) | 2.21 |
| Total Families | 410 (100.0%) | 2.89 |
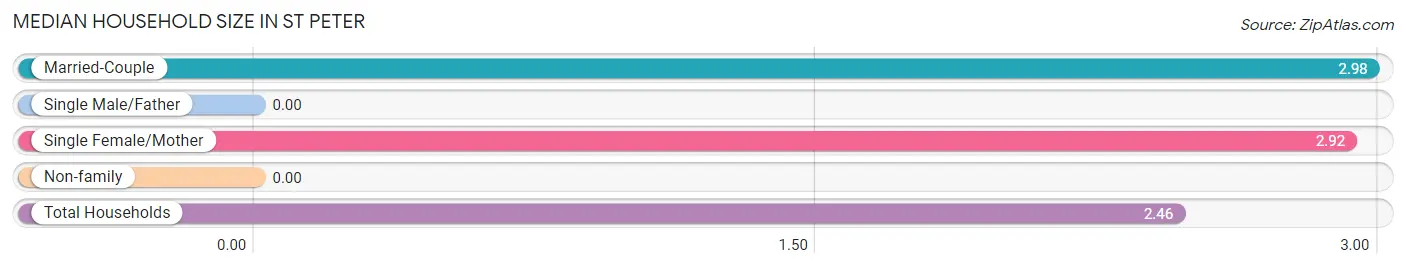
Median Household Size in St Peter
| Household Type | # Households | Household Size |
| Married-Couple | 362 (65.2%) | 2.98 |
| Single Male/Father | 0 (0.0%) | - |
| Single Female/Mother | 48 (8.6%) | 2.92 |
| Non-family | 145 (26.1%) | - |
| Total Households | 555 (100.0%) | 2.46 |
Household Size by Marriage Status in St Peter
Out of a total of 555 households in St Peter, 410 (73.9%) are family households, while 145 (26.1%) are nonfamily households. The most numerous type of family households are 2-person households, comprising 186, and the most common type of nonfamily households are 1-person households, comprising 145.
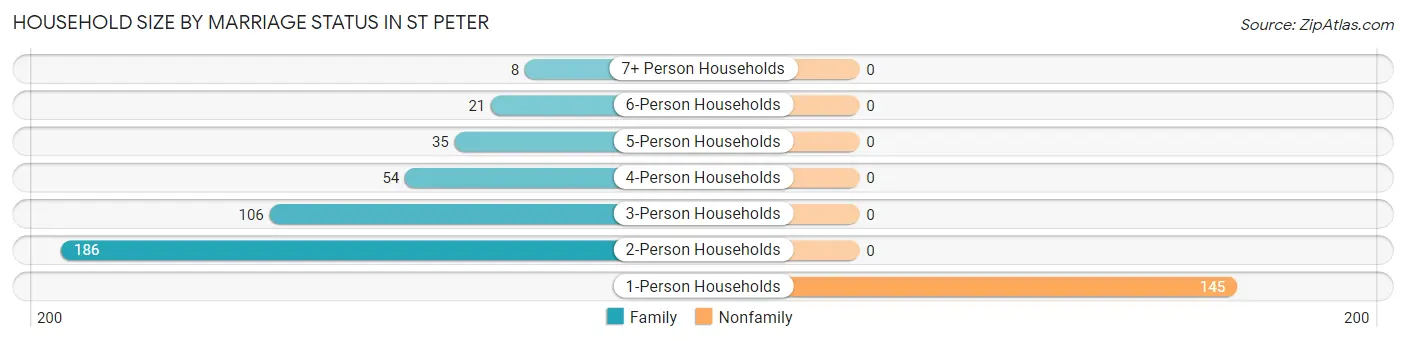
| Household Size | Family Households | Nonfamily Households |
| 1-Person Households | - | 145 (26.1%) |
| 2-Person Households | 186 (33.5%) | 0 (0.0%) |
| 3-Person Households | 106 (19.1%) | 0 (0.0%) |
| 4-Person Households | 54 (9.7%) | 0 (0.0%) |
| 5-Person Households | 35 (6.3%) | 0 (0.0%) |
| 6-Person Households | 21 (3.8%) | 0 (0.0%) |
| 7+ Person Households | 8 (1.4%) | 0 (0.0%) |
| Total | 410 (73.9%) | 145 (26.1%) |
Female Fertility in St Peter
Fertility by Age in St Peter
Average fertility rate in St Peter is 201.0 births per 1,000 women. Women in the age bracket of 20 to 34 years have the highest fertility rate with 495.0 births per 1,000 women. Women in the age bracket of 20 to 34 years acount for 100.0% of all women with births.
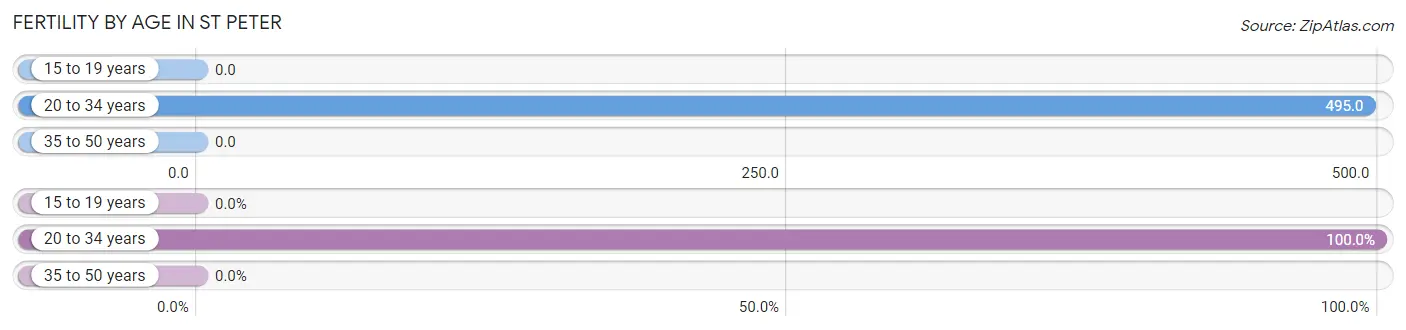
| Age Bracket | Women with Births | Births / 1,000 Women |
| 15 to 19 years | 0 (0.0%) | 0.0 |
| 20 to 34 years | 47 (100.0%) | 495.0 |
| 35 to 50 years | 0 (0.0%) | 0.0 |
| Total | 47 (100.0%) | 201.0 |
Fertility by Age by Marriage Status in St Peter
55.3% of women with births (47) in St Peter are married. The highest percentage of unmarried women with births falls into 20 to 34 years age bracket with 44.7% of them unmarried at the time of birth, while the lowest percentage of unmarried women with births belong to 20 to 34 years age bracket with 44.7% of them unmarried.
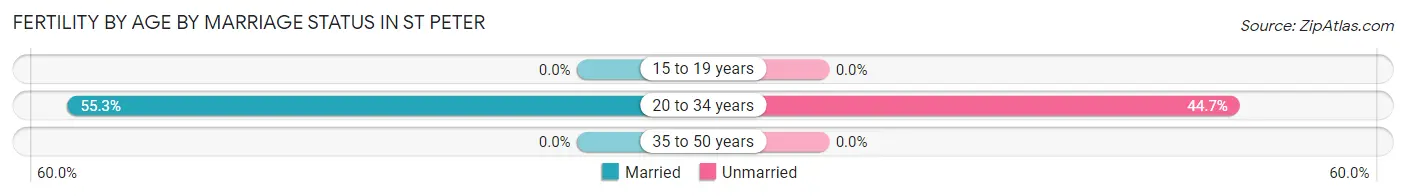
| Age Bracket | Married | Unmarried |
| 15 to 19 years | 0 (0.0%) | 0 (0.0%) |
| 20 to 34 years | 26 (55.3%) | 21 (44.7%) |
| 35 to 50 years | 0 (0.0%) | 0 (0.0%) |
| Total | 26 (55.3%) | 21 (44.7%) |
Fertility by Education in St Peter
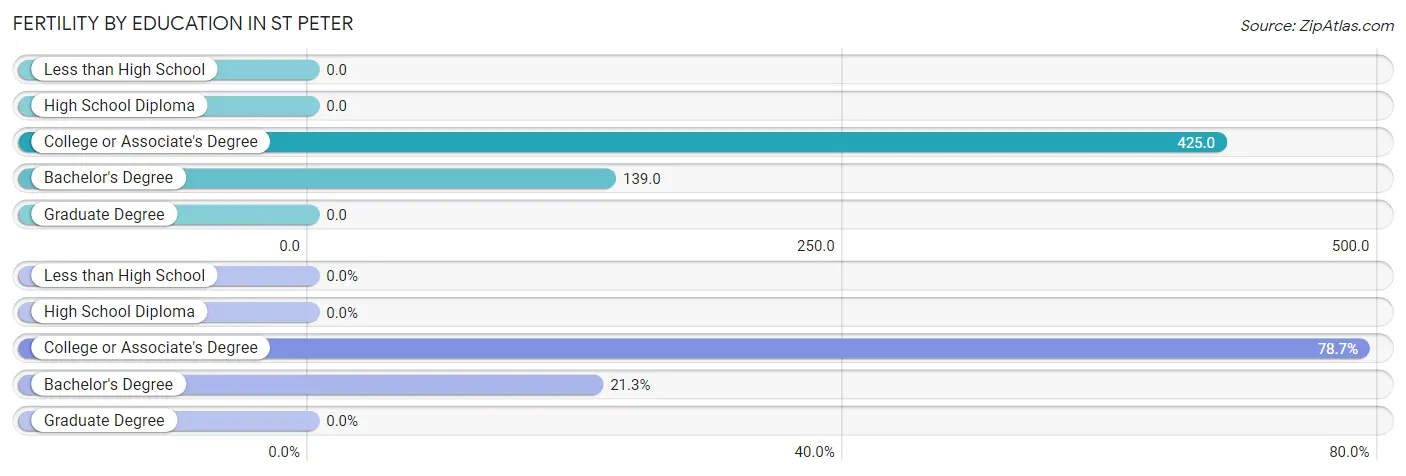
| Educational Attainment | Women with Births | Births / 1,000 Women |
| Less than High School | 0 (0.0%) | 0.0 |
| High School Diploma | 0 (0.0%) | 0.0 |
| College or Associate's Degree | 37 (78.7%) | 425.0 |
| Bachelor's Degree | 10 (21.3%) | 139.0 |
| Graduate Degree | 0 (0.0%) | 0.0 |
| Total | 47 (100.0%) | 201.0 |
Fertility by Education by Marriage Status in St Peter
44.7% of women with births in St Peter are unmarried. Women with the educational attainment of bachelor's degree are most likely to be married with 100.0% of them married at childbirth, while women with the educational attainment of college or associate's degree are least likely to be married with 56.8% of them unmarried at childbirth.
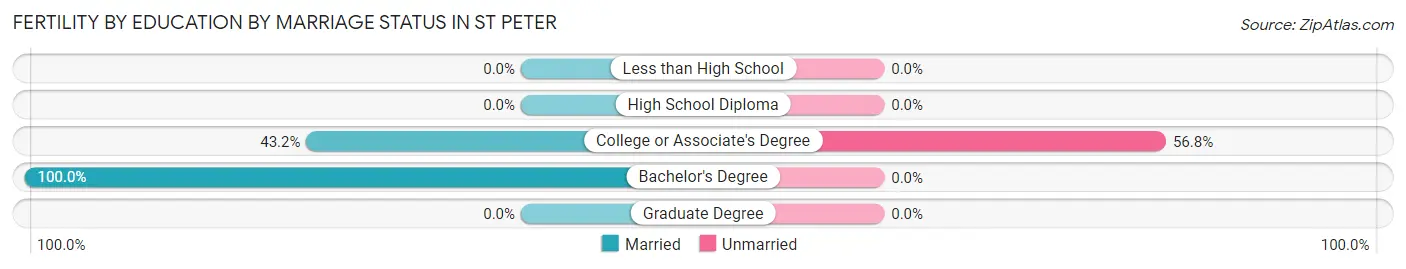
| Educational Attainment | Married | Unmarried |
| Less than High School | 0 (0.0%) | 0 (0.0%) |
| High School Diploma | 0 (0.0%) | 0 (0.0%) |
| College or Associate's Degree | 16 (43.2%) | 21 (56.8%) |
| Bachelor's Degree | 10 (100.0%) | 0 (0.0%) |
| Graduate Degree | 0 (0.0%) | 0 (0.0%) |
| Total | 26 (55.3%) | 21 (44.7%) |
Employment Characteristics in St Peter
Employment by Class of Employer in St Peter
Among the 709 employed individuals in St Peter, private company employees (454 | 64.0%), not-for-profit organizations (149 | 21.0%), and local government employees (61 | 8.6%) make up the most common classes of employment.
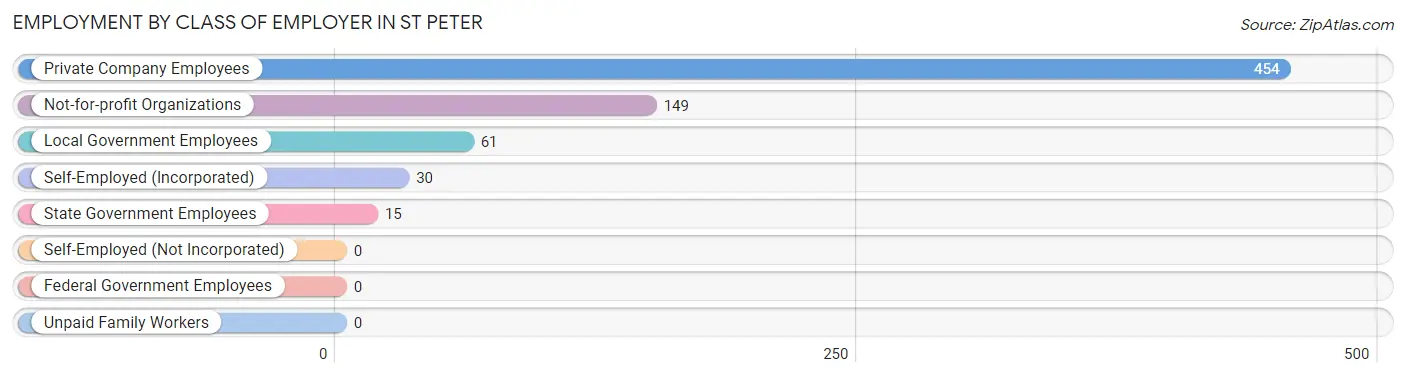
| Employer Class | # Employees | % Employees |
| Private Company Employees | 454 | 64.0% |
| Self-Employed (Incorporated) | 30 | 4.2% |
| Self-Employed (Not Incorporated) | 0 | 0.0% |
| Not-for-profit Organizations | 149 | 21.0% |
| Local Government Employees | 61 | 8.6% |
| State Government Employees | 15 | 2.1% |
| Federal Government Employees | 0 | 0.0% |
| Unpaid Family Workers | 0 | 0.0% |
| Total | 709 | 100.0% |
Employment Status by Age in St Peter
According to the labor force statistics for St Peter, out of the total population over 16 years of age (1,051), 69.8% or 734 individuals are in the labor force, with 1.2% or 9 of them unemployed. The age group with the highest labor force participation rate is 20 to 24 years, with 100.0% or 31 individuals in the labor force. Within the labor force, the 20 to 24 years age range has the highest percentage of unemployed individuals, with 29.0% or 9 of them being unemployed.
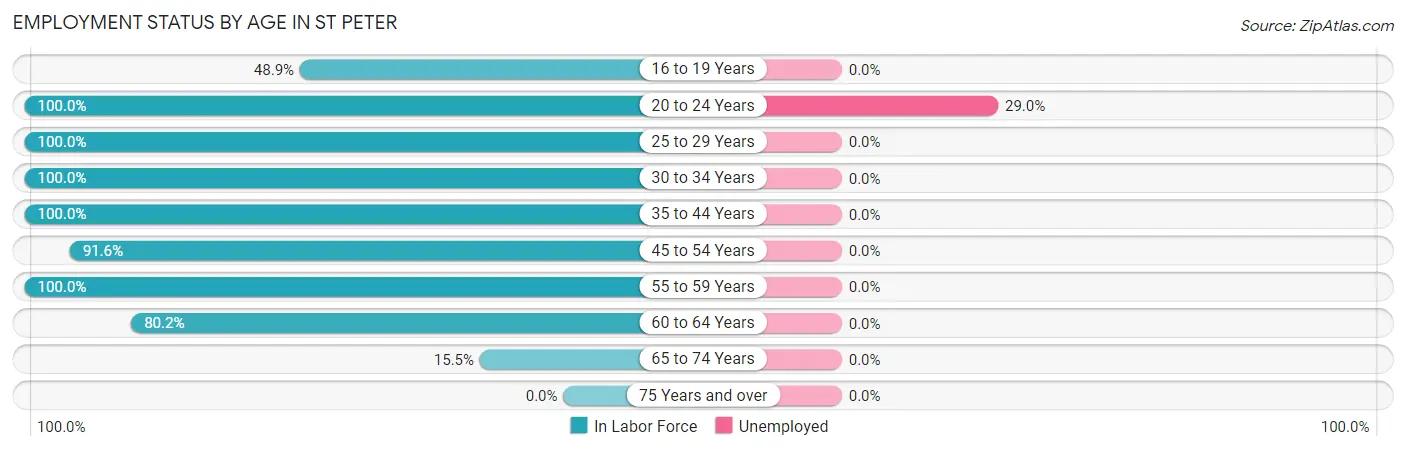
| Age Bracket | In Labor Force | Unemployed |
| 16 to 19 Years | 23 (48.9%) | 0 (0.0%) |
| 20 to 24 Years | 31 (100.0%) | 9 (29.0%) |
| 25 to 29 Years | 71 (100.0%) | 0 (0.0%) |
| 30 to 34 Years | 106 (100.0%) | 0 (0.0%) |
| 35 to 44 Years | 85 (100.0%) | 0 (0.0%) |
| 45 to 54 Years | 241 (91.6%) | 0 (0.0%) |
| 55 to 59 Years | 63 (100.0%) | 0 (0.0%) |
| 60 to 64 Years | 85 (80.2%) | 0 (0.0%) |
| 65 to 74 Years | 29 (15.5%) | 0 (0.0%) |
| 75 Years and over | 0 (0.0%) | 0 (0.0%) |
| Total | 734 (69.8%) | 9 (1.2%) |
Employment Status by Educational Attainment in St Peter
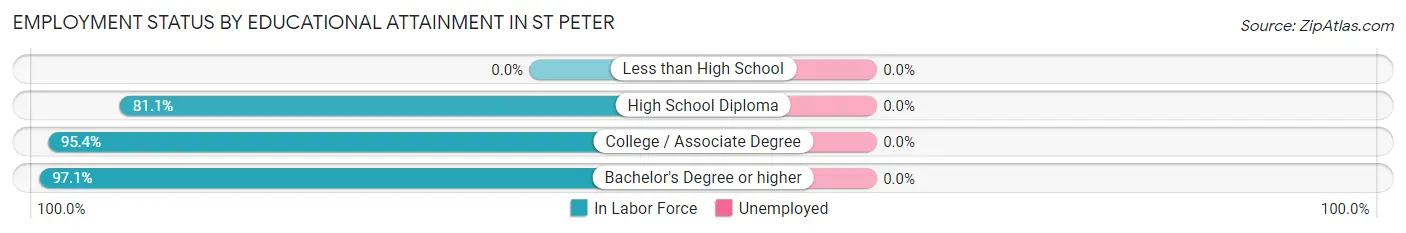
| Educational Attainment | In Labor Force | Unemployed |
| Less than High School | 0 (0.0%) | 0 (0.0%) |
| High School Diploma | 90 (81.1%) | 0 (0.0%) |
| College / Associate Degree | 289 (95.4%) | 0 (0.0%) |
| Bachelor's Degree or higher | 272 (97.1%) | 0 (0.0%) |
| Total | 651 (93.8%) | 0 (0.0%) |
Employment Occupations by Sex in St Peter
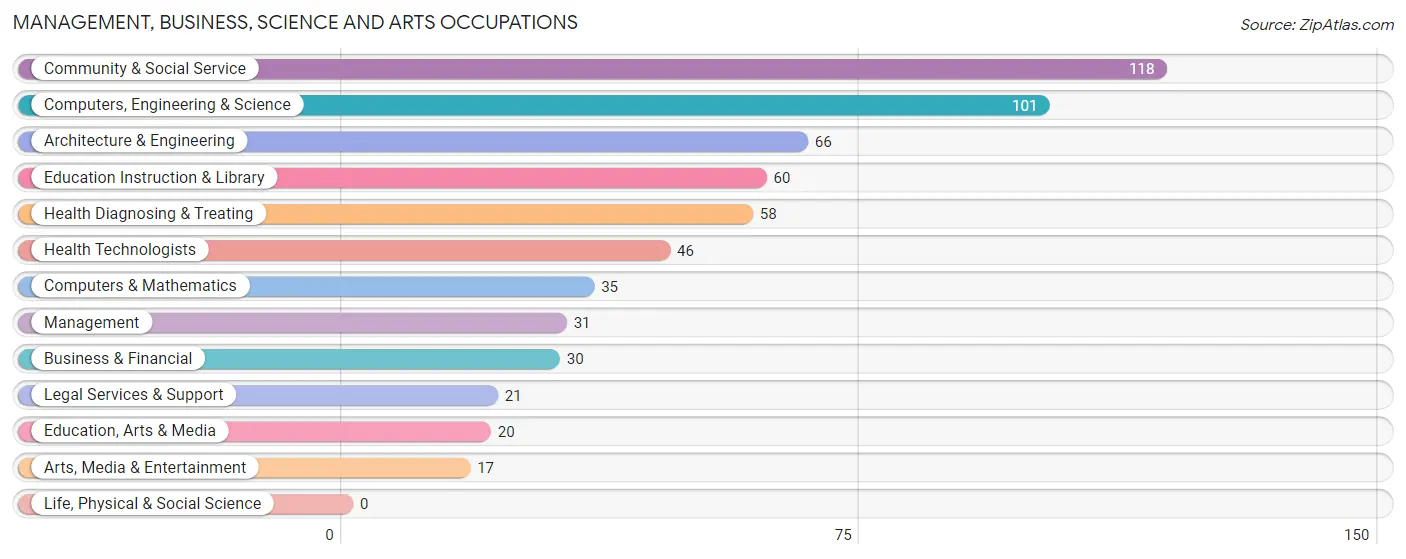
Management, Business, Science and Arts Occupations
The most common Management, Business, Science and Arts occupations in St Peter are Community & Social Service (118 | 16.3%), Computers, Engineering & Science (101 | 13.9%), Architecture & Engineering (66 | 9.1%), Education Instruction & Library (60 | 8.3%), and Health Diagnosing & Treating (58 | 8.0%).
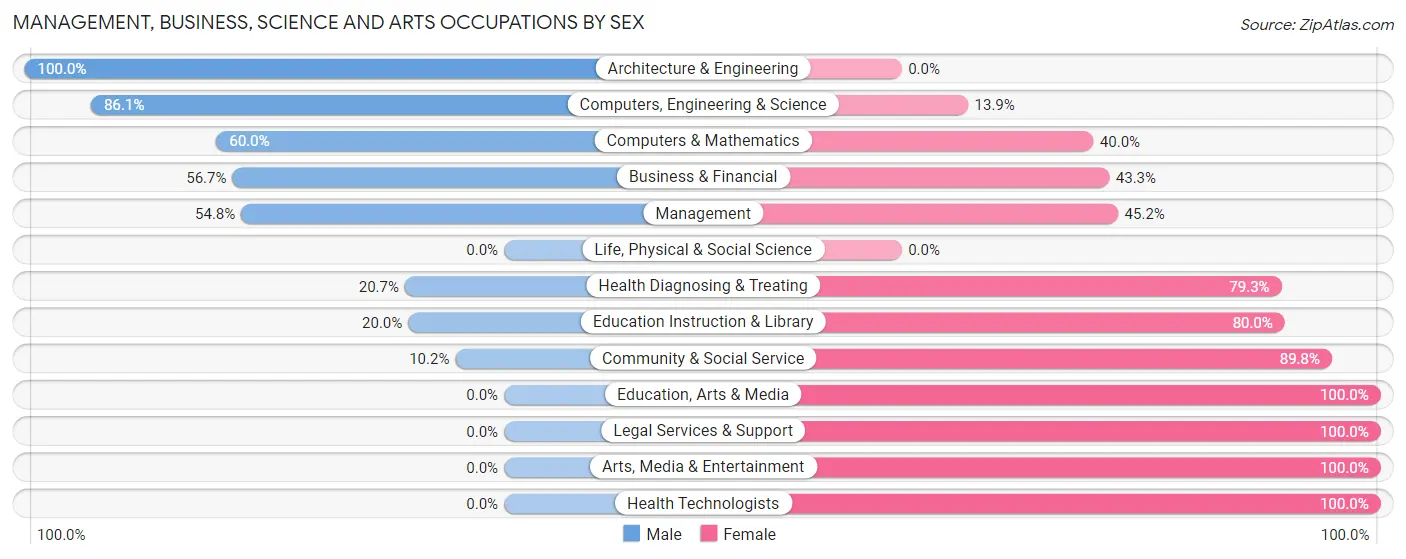
Management, Business, Science and Arts Occupations by Sex
Within the Management, Business, Science and Arts occupations in St Peter, the most male-oriented occupations are Architecture & Engineering (100.0%), Computers, Engineering & Science (86.1%), and Computers & Mathematics (60.0%), while the most female-oriented occupations are Education, Arts & Media (100.0%), Legal Services & Support (100.0%), and Arts, Media & Entertainment (100.0%).
| Occupation | Male | Female |
| Management | 17 (54.8%) | 14 (45.2%) |
| Business & Financial | 17 (56.7%) | 13 (43.3%) |
| Computers, Engineering & Science | 87 (86.1%) | 14 (13.9%) |
| Computers & Mathematics | 21 (60.0%) | 14 (40.0%) |
| Architecture & Engineering | 66 (100.0%) | 0 (0.0%) |
| Life, Physical & Social Science | 0 (0.0%) | 0 (0.0%) |
| Community & Social Service | 12 (10.2%) | 106 (89.8%) |
| Education, Arts & Media | 0 (0.0%) | 20 (100.0%) |
| Legal Services & Support | 0 (0.0%) | 21 (100.0%) |
| Education Instruction & Library | 12 (20.0%) | 48 (80.0%) |
| Arts, Media & Entertainment | 0 (0.0%) | 17 (100.0%) |
| Health Diagnosing & Treating | 12 (20.7%) | 46 (79.3%) |
| Health Technologists | 0 (0.0%) | 46 (100.0%) |
| Total (Category) | 145 (42.9%) | 193 (57.1%) |
| Total (Overall) | 398 (54.9%) | 327 (45.1%) |
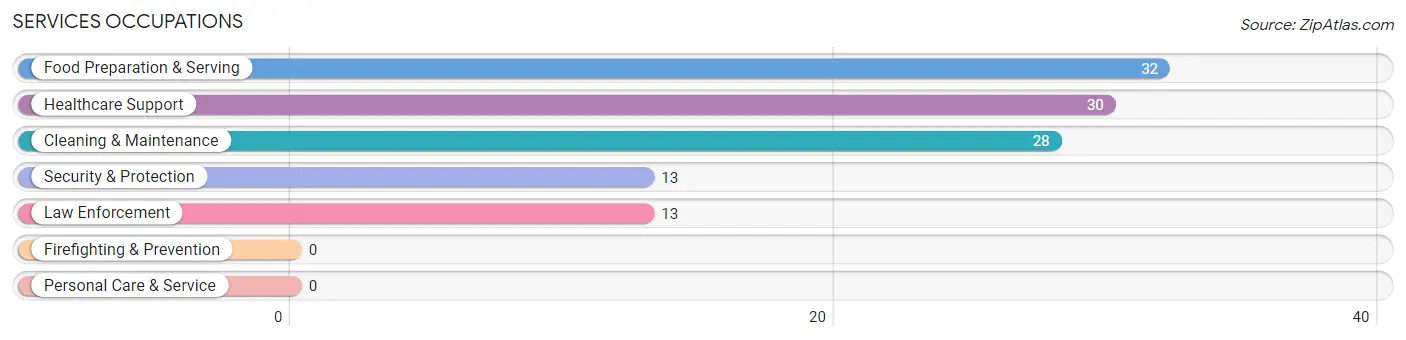
Services Occupations
The most common Services occupations in St Peter are Food Preparation & Serving (32 | 4.4%), Healthcare Support (30 | 4.1%), Cleaning & Maintenance (28 | 3.9%), Security & Protection (13 | 1.8%), and Law Enforcement (13 | 1.8%).
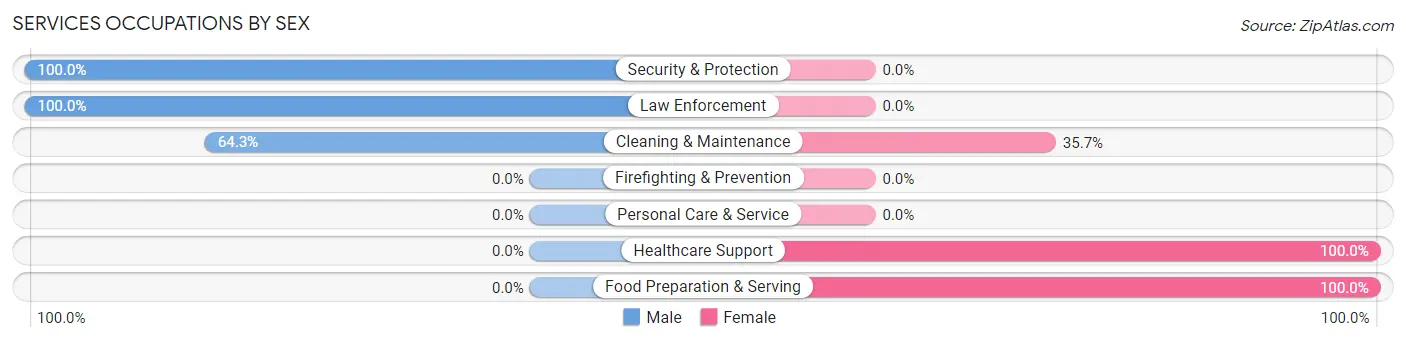
Services Occupations by Sex
Within the Services occupations in St Peter, the most male-oriented occupations are Security & Protection (100.0%), Law Enforcement (100.0%), and Cleaning & Maintenance (64.3%), while the most female-oriented occupations are Healthcare Support (100.0%), Food Preparation & Serving (100.0%), and Cleaning & Maintenance (35.7%).
| Occupation | Male | Female |
| Healthcare Support | 0 (0.0%) | 30 (100.0%) |
| Security & Protection | 13 (100.0%) | 0 (0.0%) |
| Firefighting & Prevention | 0 (0.0%) | 0 (0.0%) |
| Law Enforcement | 13 (100.0%) | 0 (0.0%) |
| Food Preparation & Serving | 0 (0.0%) | 32 (100.0%) |
| Cleaning & Maintenance | 18 (64.3%) | 10 (35.7%) |
| Personal Care & Service | 0 (0.0%) | 0 (0.0%) |
| Total (Category) | 31 (30.1%) | 72 (69.9%) |
| Total (Overall) | 398 (54.9%) | 327 (45.1%) |
Sales and Office Occupations
The most common Sales and Office occupations in St Peter are Office & Administration (113 | 15.6%), and Sales & Related (57 | 7.9%).

Sales and Office Occupations by Sex

| Occupation | Male | Female |
| Sales & Related | 57 (100.0%) | 0 (0.0%) |
| Office & Administration | 51 (45.1%) | 62 (54.9%) |
| Total (Category) | 108 (63.5%) | 62 (36.5%) |
| Total (Overall) | 398 (54.9%) | 327 (45.1%) |
Natural Resources, Construction and Maintenance Occupations
The most common Natural Resources, Construction and Maintenance occupations in St Peter are Construction & Extraction (49 | 6.8%), and Installation, Maintenance & Repair (7 | 1.0%).
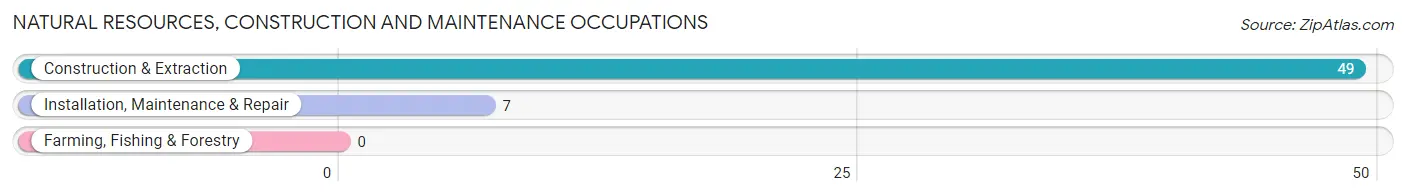
Natural Resources, Construction and Maintenance Occupations by Sex

| Occupation | Male | Female |
| Farming, Fishing & Forestry | 0 (0.0%) | 0 (0.0%) |
| Construction & Extraction | 49 (100.0%) | 0 (0.0%) |
| Installation, Maintenance & Repair | 7 (100.0%) | 0 (0.0%) |
| Total (Category) | 56 (100.0%) | 0 (0.0%) |
| Total (Overall) | 398 (54.9%) | 327 (45.1%) |
Production, Transportation and Moving Occupations
The most common Production, Transportation and Moving occupations in St Peter are , and Production (58 | 8.0%).
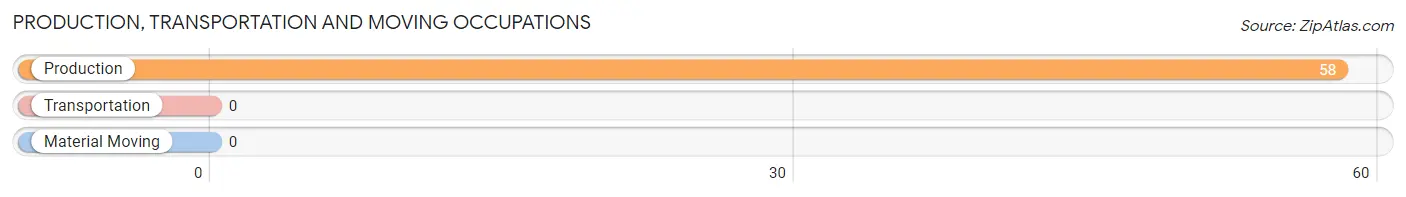
Production, Transportation and Moving Occupations by Sex
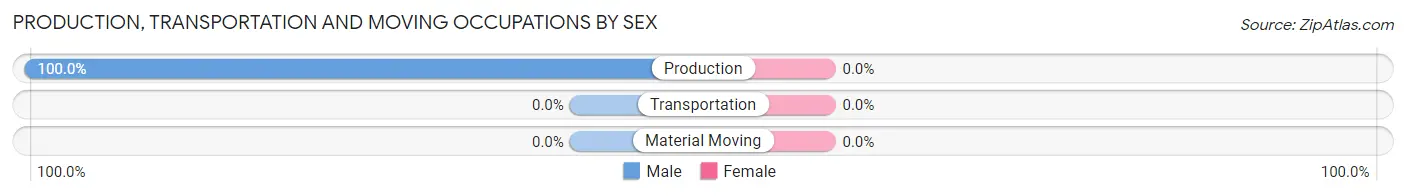
| Occupation | Male | Female |
| Production | 58 (100.0%) | 0 (0.0%) |
| Transportation | 0 (0.0%) | 0 (0.0%) |
| Material Moving | 0 (0.0%) | 0 (0.0%) |
| Total (Category) | 58 (100.0%) | 0 (0.0%) |
| Total (Overall) | 398 (54.9%) | 327 (45.1%) |
Employment Industries by Sex in St Peter
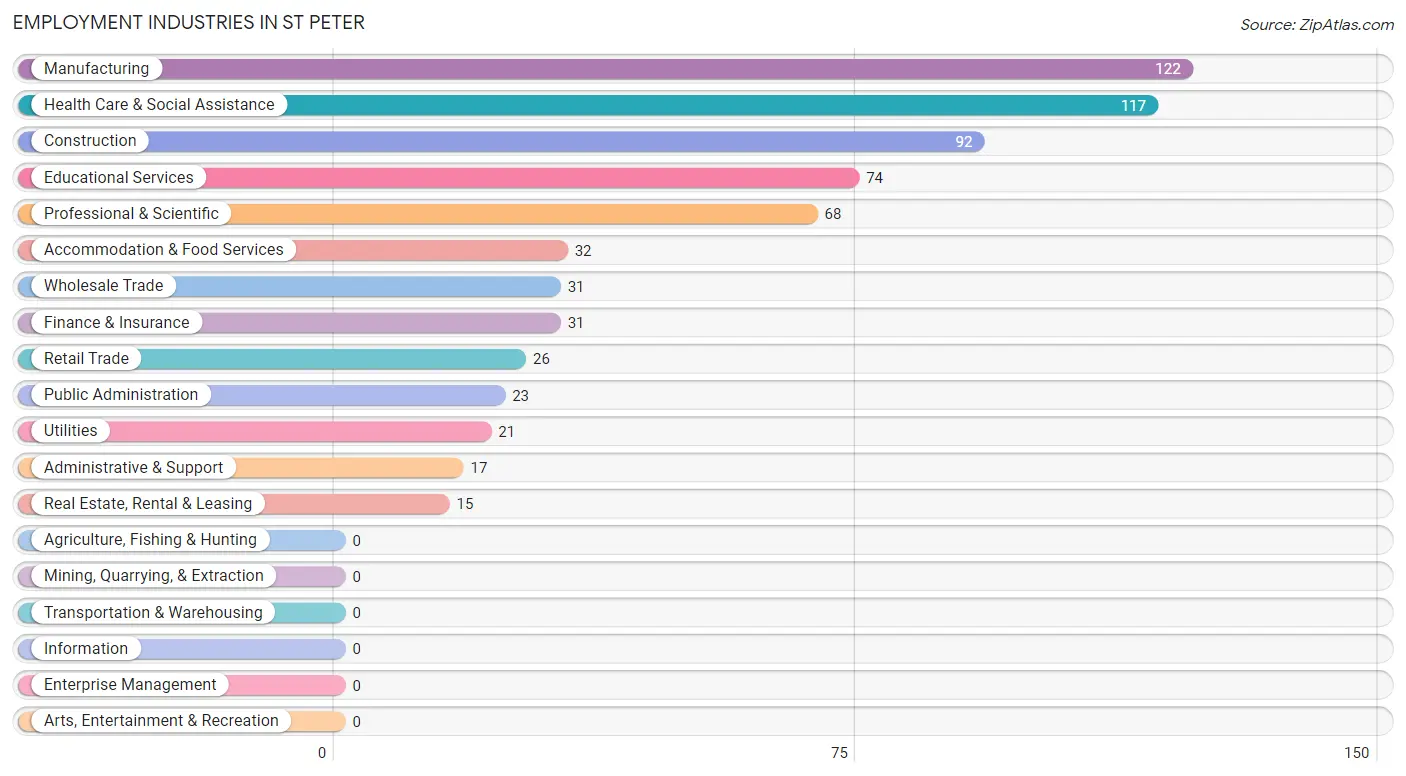
Employment Industries in St Peter
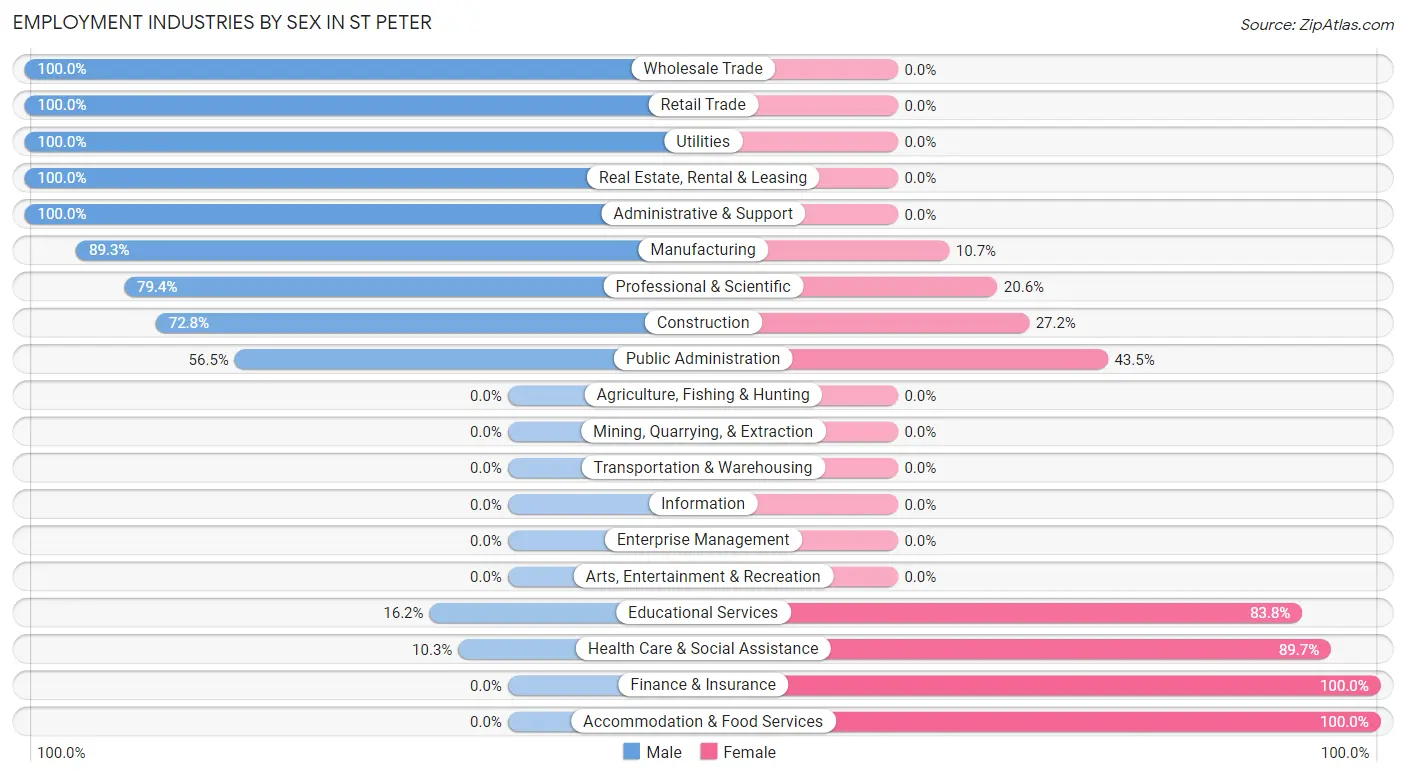
The major employment industries in St Peter include Manufacturing (122 | 16.8%), Health Care & Social Assistance (117 | 16.1%), Construction (92 | 12.7%), Educational Services (74 | 10.2%), and Professional & Scientific (68 | 9.4%).
Employment Industries by Sex in St Peter
The St Peter industries that see more men than women are Wholesale Trade (100.0%), Retail Trade (100.0%), and Utilities (100.0%), whereas the industries that tend to have a higher number of women are Finance & Insurance (100.0%), Accommodation & Food Services (100.0%), and Health Care & Social Assistance (89.7%).
| Industry | Male | Female |
| Agriculture, Fishing & Hunting | 0 (0.0%) | 0 (0.0%) |
| Mining, Quarrying, & Extraction | 0 (0.0%) | 0 (0.0%) |
| Construction | 67 (72.8%) | 25 (27.2%) |
| Manufacturing | 109 (89.3%) | 13 (10.7%) |
| Wholesale Trade | 31 (100.0%) | 0 (0.0%) |
| Retail Trade | 26 (100.0%) | 0 (0.0%) |
| Transportation & Warehousing | 0 (0.0%) | 0 (0.0%) |
| Utilities | 21 (100.0%) | 0 (0.0%) |
| Information | 0 (0.0%) | 0 (0.0%) |
| Finance & Insurance | 0 (0.0%) | 31 (100.0%) |
| Real Estate, Rental & Leasing | 15 (100.0%) | 0 (0.0%) |
| Professional & Scientific | 54 (79.4%) | 14 (20.6%) |
| Enterprise Management | 0 (0.0%) | 0 (0.0%) |
| Administrative & Support | 17 (100.0%) | 0 (0.0%) |
| Educational Services | 12 (16.2%) | 62 (83.8%) |
| Health Care & Social Assistance | 12 (10.3%) | 105 (89.7%) |
| Arts, Entertainment & Recreation | 0 (0.0%) | 0 (0.0%) |
| Accommodation & Food Services | 0 (0.0%) | 32 (100.0%) |
| Public Administration | 13 (56.5%) | 10 (43.5%) |
| Total | 398 (54.9%) | 327 (45.1%) |
Education in St Peter
School Enrollment in St Peter
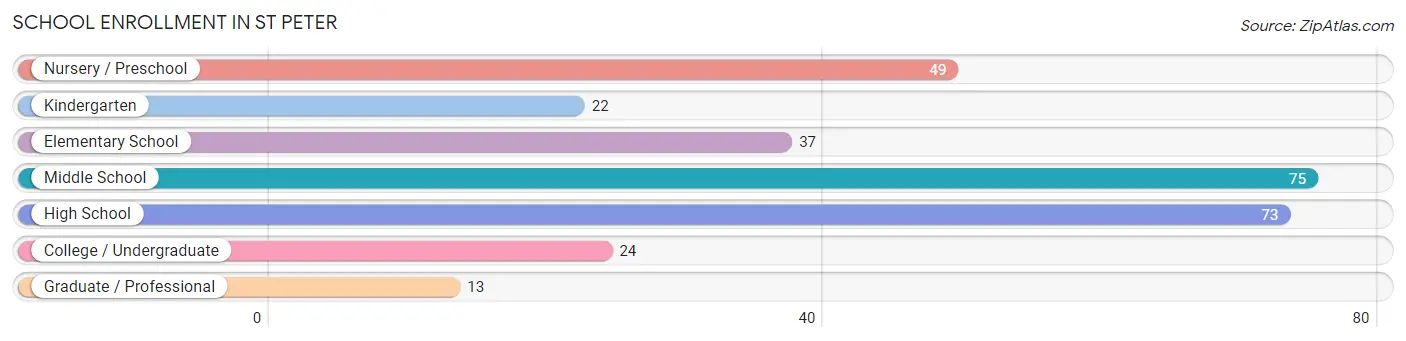
The most common levels of schooling among the 293 students in St Peter are middle school (75 | 25.6%), high school (73 | 24.9%), and nursery / preschool (49 | 16.7%).
| School Level | # Students | % Students |
| Nursery / Preschool | 49 | 16.7% |
| Kindergarten | 22 | 7.5% |
| Elementary School | 37 | 12.6% |
| Middle School | 75 | 25.6% |
| High School | 73 | 24.9% |
| College / Undergraduate | 24 | 8.2% |
| Graduate / Professional | 13 | 4.4% |
| Total | 293 | 100.0% |
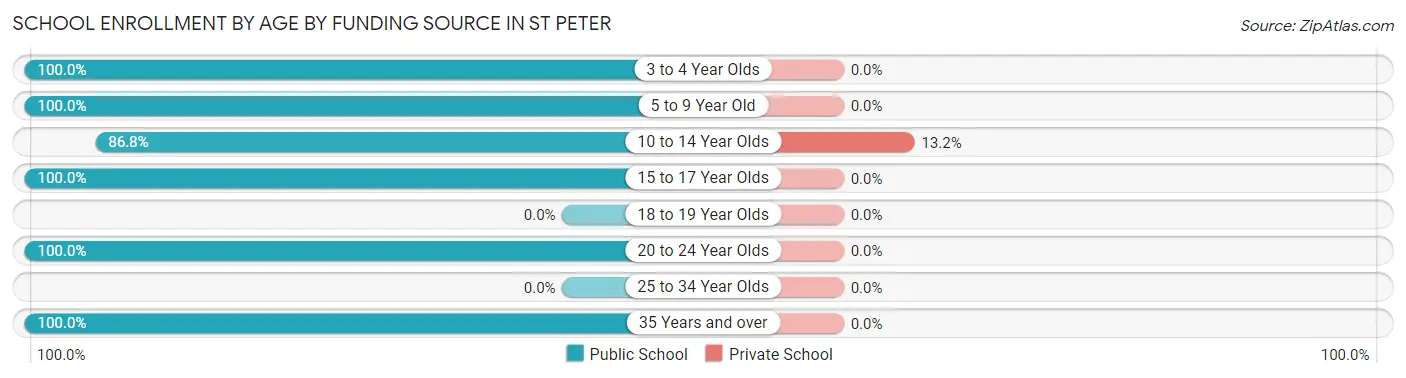
School Enrollment by Age by Funding Source in St Peter
Out of a total of 293 students who are enrolled in schools in St Peter, 12 (4.1%) attend a private institution, while the remaining 281 (95.9%) are enrolled in public schools. The age group of 10 to 14 year olds has the highest likelihood of being enrolled in private schools, with 12 (13.2% in the age bracket) enrolled. Conversely, the age group of 3 to 4 year olds has the lowest likelihood of being enrolled in a private school, with 38 (100.0% in the age bracket) attending a public institution.
| Age Bracket | Public School | Private School |
| 3 to 4 Year Olds | 38 (100.0%) | 0 (0.0%) |
| 5 to 9 Year Old | 65 (100.0%) | 0 (0.0%) |
| 10 to 14 Year Olds | 79 (86.8%) | 12 (13.2%) |
| 15 to 17 Year Olds | 62 (100.0%) | 0 (0.0%) |
| 18 to 19 Year Olds | 0 (0.0%) | 0 (0.0%) |
| 20 to 24 Year Olds | 9 (100.0%) | 0 (0.0%) |
| 25 to 34 Year Olds | 0 (0.0%) | 0 (0.0%) |
| 35 Years and over | 28 (100.0%) | 0 (0.0%) |
| Total | 281 (95.9%) | 12 (4.1%) |
Educational Attainment by Field of Study in St Peter
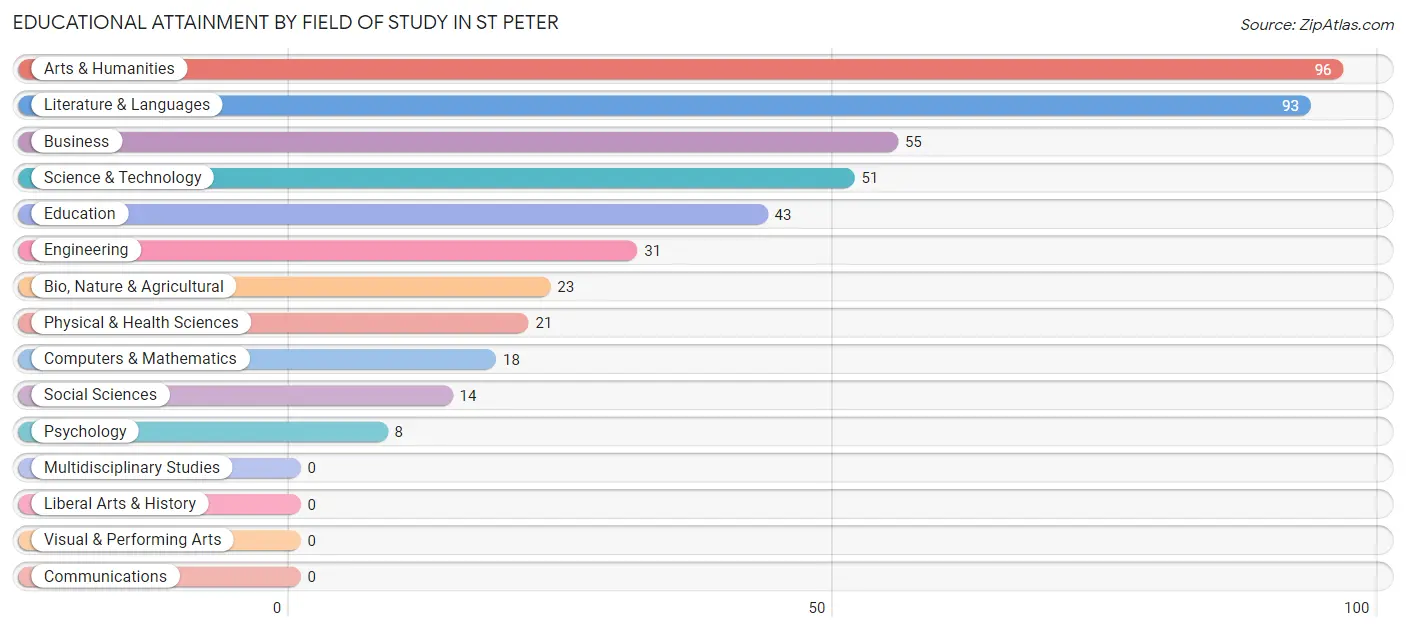
Arts & humanities (96 | 21.2%), literature & languages (93 | 20.5%), business (55 | 12.1%), science & technology (51 | 11.3%), and education (43 | 9.5%) are the most common fields of study among 453 individuals in St Peter who have obtained a bachelor's degree or higher.
| Field of Study | # Graduates | % Graduates |
| Computers & Mathematics | 18 | 4.0% |
| Bio, Nature & Agricultural | 23 | 5.1% |
| Physical & Health Sciences | 21 | 4.6% |
| Psychology | 8 | 1.8% |
| Social Sciences | 14 | 3.1% |
| Engineering | 31 | 6.8% |
| Multidisciplinary Studies | 0 | 0.0% |
| Science & Technology | 51 | 11.3% |
| Business | 55 | 12.1% |
| Education | 43 | 9.5% |
| Literature & Languages | 93 | 20.5% |
| Liberal Arts & History | 0 | 0.0% |
| Visual & Performing Arts | 0 | 0.0% |
| Communications | 0 | 0.0% |
| Arts & Humanities | 96 | 21.2% |
| Total | 453 | 100.0% |
Transportation & Commute in St Peter
Vehicle Availability by Sex in St Peter
The most prevalent vehicle ownership categories in St Peter are males with 3 vehicles (229, accounting for 57.5%) and females with 3 vehicles (157, making up 73.6%).
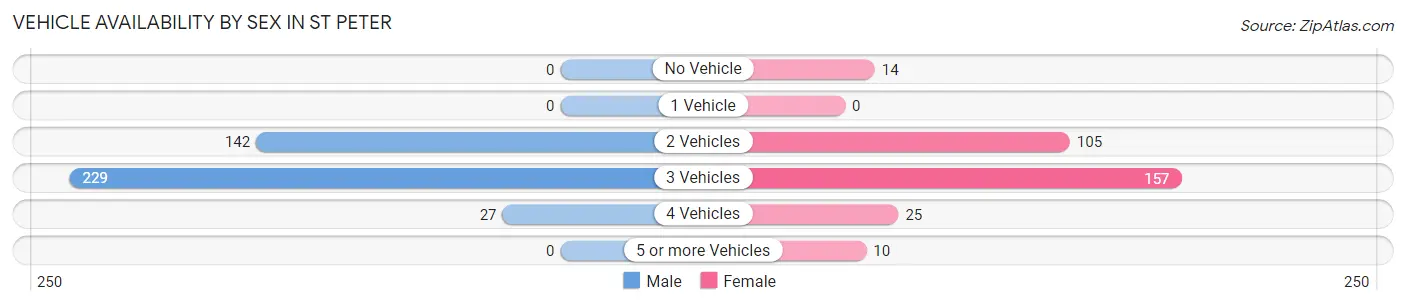
| Vehicles Available | Male | Female |
| No Vehicle | 0 (0.0%) | 14 (4.5%) |
| 1 Vehicle | 0 (0.0%) | 0 (0.0%) |
| 2 Vehicles | 142 (35.7%) | 105 (33.8%) |
| 3 Vehicles | 229 (57.5%) | 157 (50.5%) |
| 4 Vehicles | 27 (6.8%) | 25 (8.0%) |
| 5 or more Vehicles | 0 (0.0%) | 10 (3.2%) |
| Total | 398 (100.0%) | 311 (100.0%) |
Commute Time in St Peter
The most frequently occuring commute durations in St Peter are 15 to 19 minutes (287 commuters, 45.1%), 20 to 24 minutes (97 commuters, 15.2%), and 10 to 14 minutes (73 commuters, 11.5%).
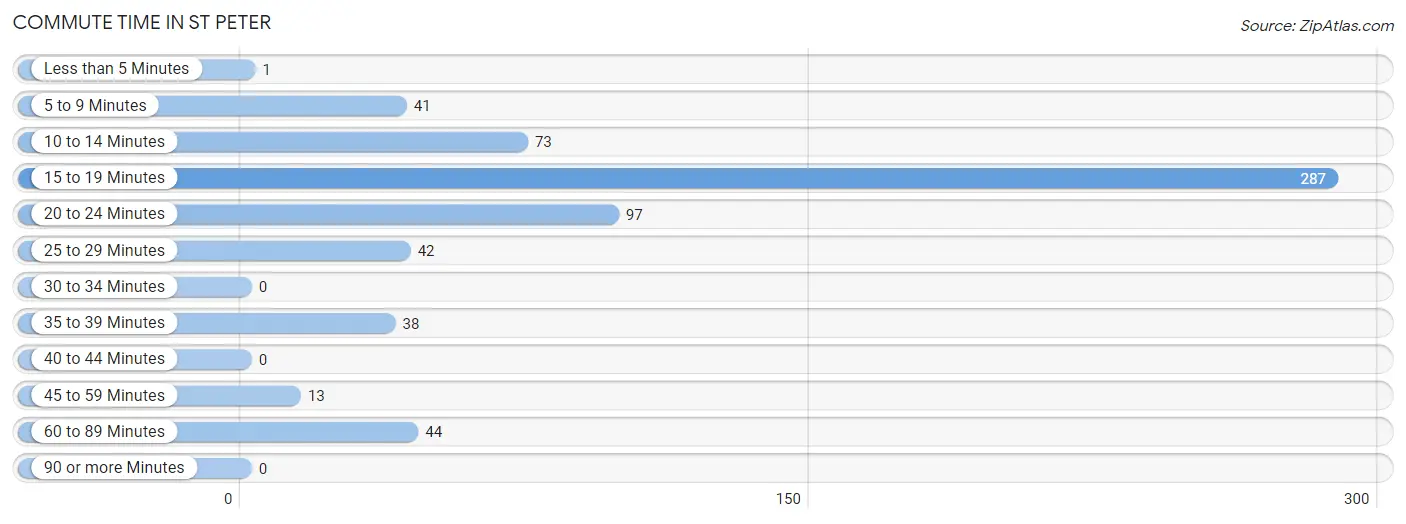
| Commute Time | # Commuters | % Commuters |
| Less than 5 Minutes | 1 | 0.2% |
| 5 to 9 Minutes | 41 | 6.5% |
| 10 to 14 Minutes | 73 | 11.5% |
| 15 to 19 Minutes | 287 | 45.1% |
| 20 to 24 Minutes | 97 | 15.2% |
| 25 to 29 Minutes | 42 | 6.6% |
| 30 to 34 Minutes | 0 | 0.0% |
| 35 to 39 Minutes | 38 | 6.0% |
| 40 to 44 Minutes | 0 | 0.0% |
| 45 to 59 Minutes | 13 | 2.0% |
| 60 to 89 Minutes | 44 | 6.9% |
| 90 or more Minutes | 0 | 0.0% |
Commute Time by Sex in St Peter
The most common commute times in St Peter are 15 to 19 minutes (146 commuters, 41.0%) for males and 15 to 19 minutes (141 commuters, 50.4%) for females.
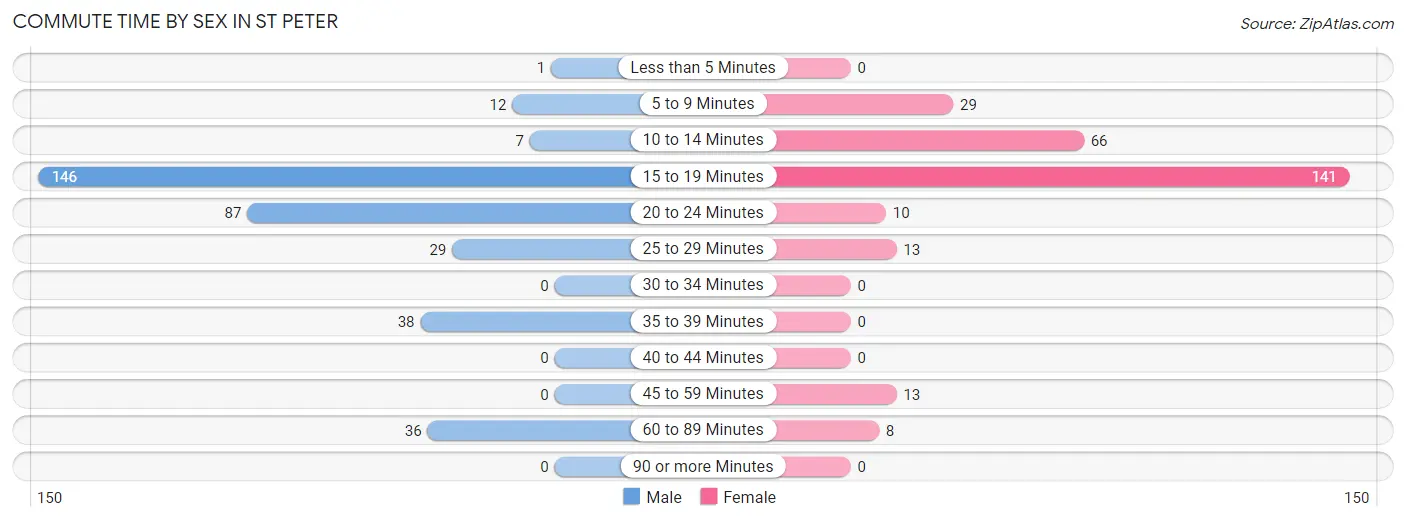
| Commute Time | Male | Female |
| Less than 5 Minutes | 1 (0.3%) | 0 (0.0%) |
| 5 to 9 Minutes | 12 (3.4%) | 29 (10.4%) |
| 10 to 14 Minutes | 7 (2.0%) | 66 (23.6%) |
| 15 to 19 Minutes | 146 (41.0%) | 141 (50.4%) |
| 20 to 24 Minutes | 87 (24.4%) | 10 (3.6%) |
| 25 to 29 Minutes | 29 (8.2%) | 13 (4.6%) |
| 30 to 34 Minutes | 0 (0.0%) | 0 (0.0%) |
| 35 to 39 Minutes | 38 (10.7%) | 0 (0.0%) |
| 40 to 44 Minutes | 0 (0.0%) | 0 (0.0%) |
| 45 to 59 Minutes | 0 (0.0%) | 13 (4.6%) |
| 60 to 89 Minutes | 36 (10.1%) | 8 (2.9%) |
| 90 or more Minutes | 0 (0.0%) | 0 (0.0%) |
Time of Departure to Work by Sex in St Peter
The most frequent times of departure to work in St Peter are 6:30 AM to 6:59 AM (135, 37.9%) for males and 7:00 AM to 7:29 AM (64, 22.9%) for females.
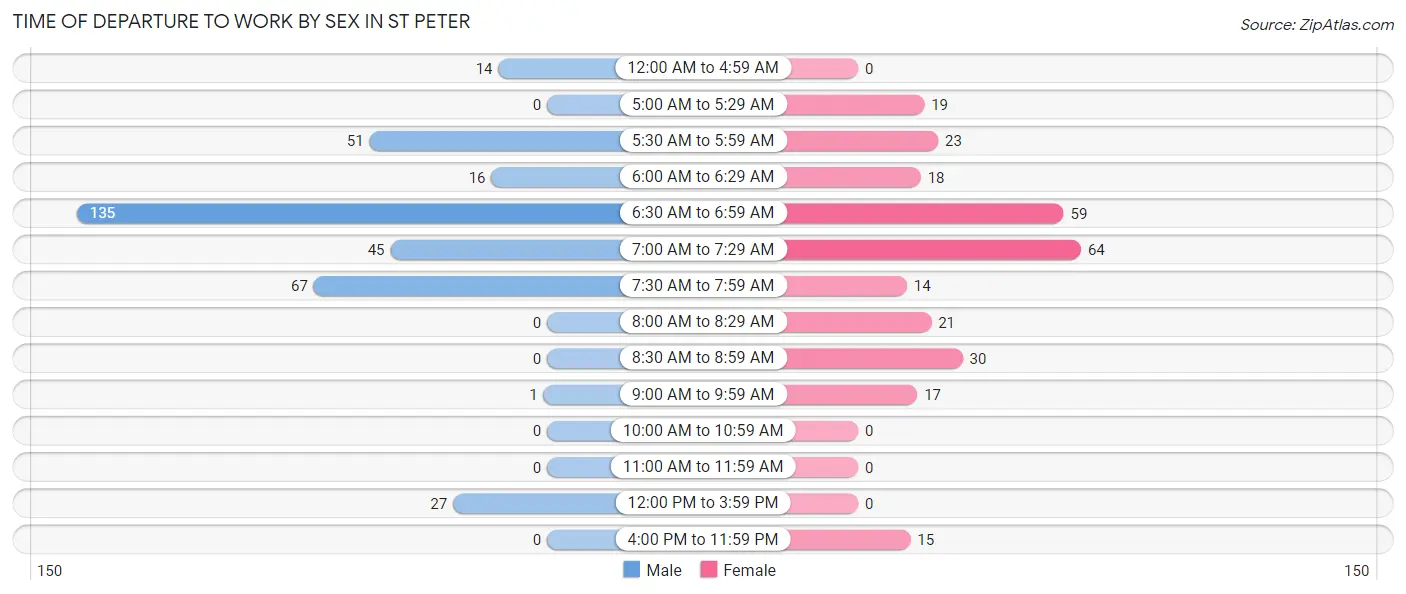
| Time of Departure | Male | Female |
| 12:00 AM to 4:59 AM | 14 (3.9%) | 0 (0.0%) |
| 5:00 AM to 5:29 AM | 0 (0.0%) | 19 (6.8%) |
| 5:30 AM to 5:59 AM | 51 (14.3%) | 23 (8.2%) |
| 6:00 AM to 6:29 AM | 16 (4.5%) | 18 (6.4%) |
| 6:30 AM to 6:59 AM | 135 (37.9%) | 59 (21.1%) |
| 7:00 AM to 7:29 AM | 45 (12.6%) | 64 (22.9%) |
| 7:30 AM to 7:59 AM | 67 (18.8%) | 14 (5.0%) |
| 8:00 AM to 8:29 AM | 0 (0.0%) | 21 (7.5%) |
| 8:30 AM to 8:59 AM | 0 (0.0%) | 30 (10.7%) |
| 9:00 AM to 9:59 AM | 1 (0.3%) | 17 (6.1%) |
| 10:00 AM to 10:59 AM | 0 (0.0%) | 0 (0.0%) |
| 11:00 AM to 11:59 AM | 0 (0.0%) | 0 (0.0%) |
| 12:00 PM to 3:59 PM | 27 (7.6%) | 0 (0.0%) |
| 4:00 PM to 11:59 PM | 0 (0.0%) | 15 (5.4%) |
| Total | 356 (100.0%) | 280 (100.0%) |
Housing Occupancy in St Peter
Occupancy by Ownership in St Peter
Of the total 555 dwellings in St Peter, owner-occupied units account for 541 (97.5%), while renter-occupied units make up 14 (2.5%).
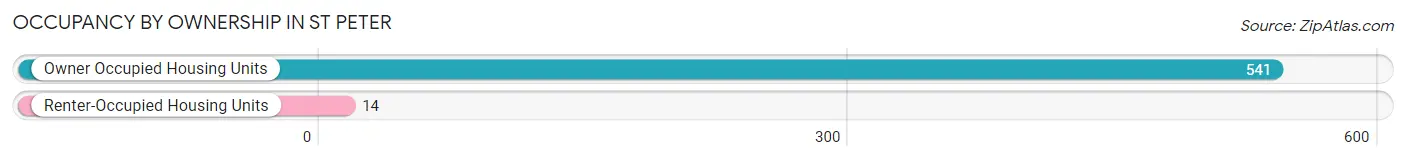
| Occupancy | # Housing Units | % Housing Units |
| Owner Occupied Housing Units | 541 | 97.5% |
| Renter-Occupied Housing Units | 14 | 2.5% |
| Total Occupied Housing Units | 555 | 100.0% |
Occupancy by Household Size in St Peter
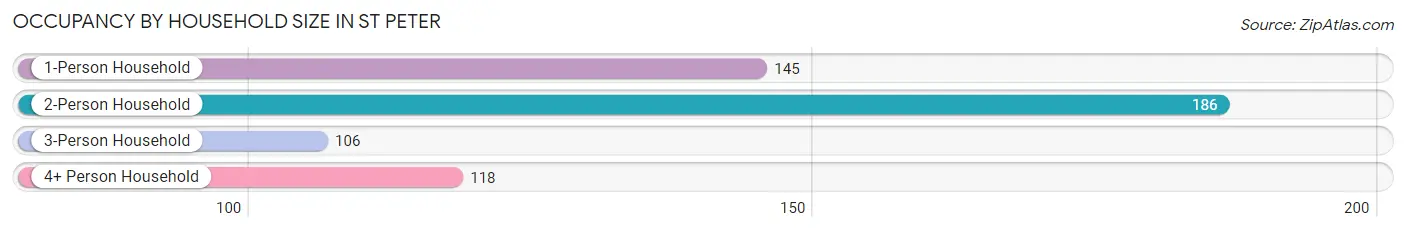
| Household Size | # Housing Units | % Housing Units |
| 1-Person Household | 145 | 26.1% |
| 2-Person Household | 186 | 33.5% |
| 3-Person Household | 106 | 19.1% |
| 4+ Person Household | 118 | 21.3% |
| Total Housing Units | 555 | 100.0% |
Occupancy by Ownership by Household Size in St Peter
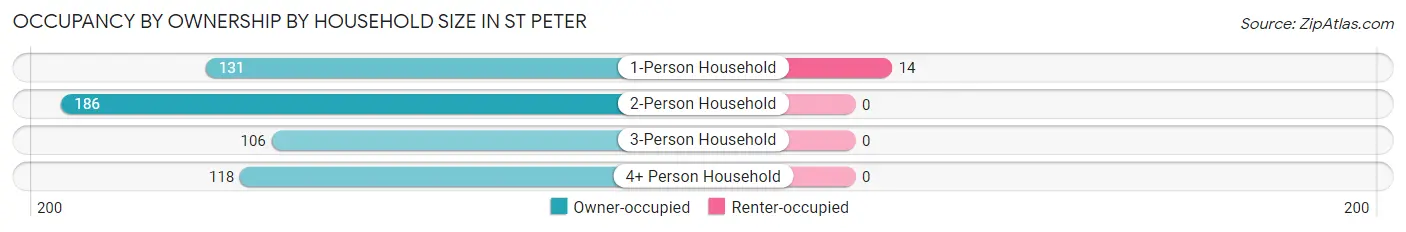
| Household Size | Owner-occupied | Renter-occupied |
| 1-Person Household | 131 (90.3%) | 14 (9.7%) |
| 2-Person Household | 186 (100.0%) | 0 (0.0%) |
| 3-Person Household | 106 (100.0%) | 0 (0.0%) |
| 4+ Person Household | 118 (100.0%) | 0 (0.0%) |
| Total Housing Units | 541 (97.5%) | 14 (2.5%) |
Occupancy by Educational Attainment in St Peter
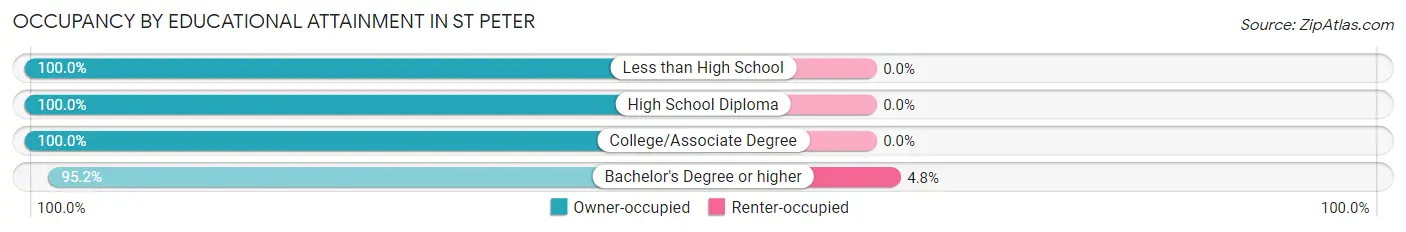
| Household Size | Owner-occupied | Renter-occupied |
| Less than High School | 19 (100.0%) | 0 (0.0%) |
| High School Diploma | 76 (100.0%) | 0 (0.0%) |
| College/Associate Degree | 167 (100.0%) | 0 (0.0%) |
| Bachelor's Degree or higher | 279 (95.2%) | 14 (4.8%) |
Occupancy by Age of Householder in St Peter
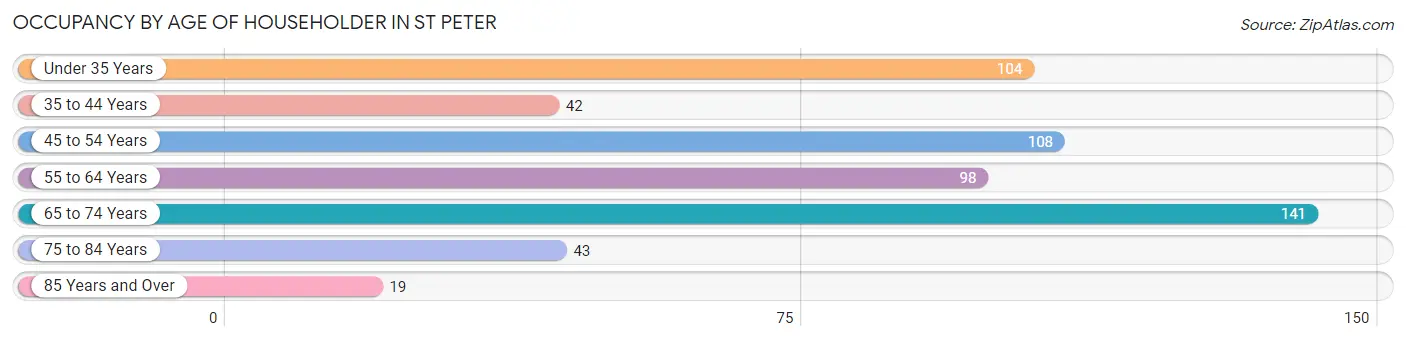
| Age Bracket | # Households | % Households |
| Under 35 Years | 104 | 18.7% |
| 35 to 44 Years | 42 | 7.6% |
| 45 to 54 Years | 108 | 19.5% |
| 55 to 64 Years | 98 | 17.7% |
| 65 to 74 Years | 141 | 25.4% |
| 75 to 84 Years | 43 | 7.7% |
| 85 Years and Over | 19 | 3.4% |
| Total | 555 | 100.0% |
Housing Finances in St Peter
Median Income by Occupancy in St Peter
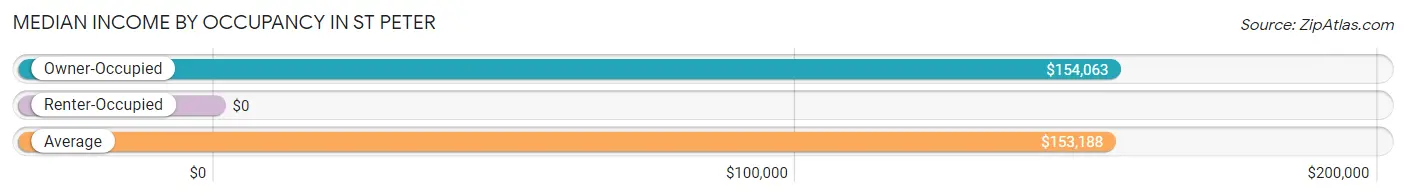
| Occupancy Type | # Households | Median Income |
| Owner-Occupied | 541 (97.5%) | $154,063 |
| Renter-Occupied | 14 (2.5%) | $0 |
| Average | 555 (100.0%) | $153,188 |
Occupancy by Householder Income Bracket in St Peter
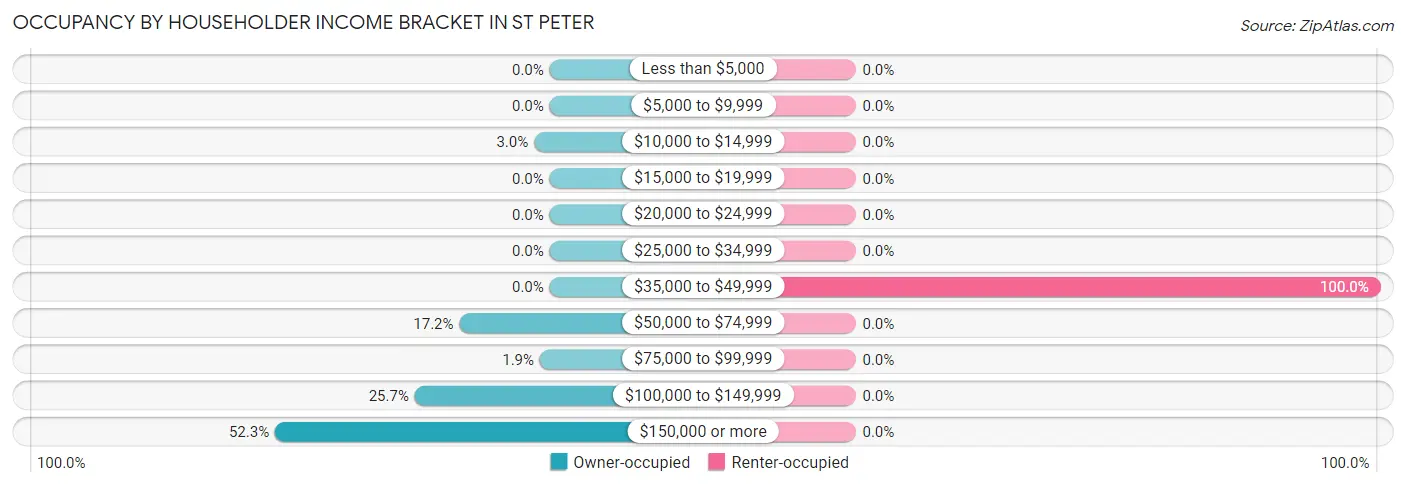
| Income Bracket | Owner-occupied | Renter-occupied |
| Less than $5,000 | 0 (0.0%) | 0 (0.0%) |
| $5,000 to $9,999 | 0 (0.0%) | 0 (0.0%) |
| $10,000 to $14,999 | 16 (3.0%) | 0 (0.0%) |
| $15,000 to $19,999 | 0 (0.0%) | 0 (0.0%) |
| $20,000 to $24,999 | 0 (0.0%) | 0 (0.0%) |
| $25,000 to $34,999 | 0 (0.0%) | 0 (0.0%) |
| $35,000 to $49,999 | 0 (0.0%) | 14 (100.0%) |
| $50,000 to $74,999 | 93 (17.2%) | 0 (0.0%) |
| $75,000 to $99,999 | 10 (1.8%) | 0 (0.0%) |
| $100,000 to $149,999 | 139 (25.7%) | 0 (0.0%) |
| $150,000 or more | 283 (52.3%) | 0 (0.0%) |
| Total | 541 (100.0%) | 14 (100.0%) |
Monthly Housing Cost Tiers in St Peter
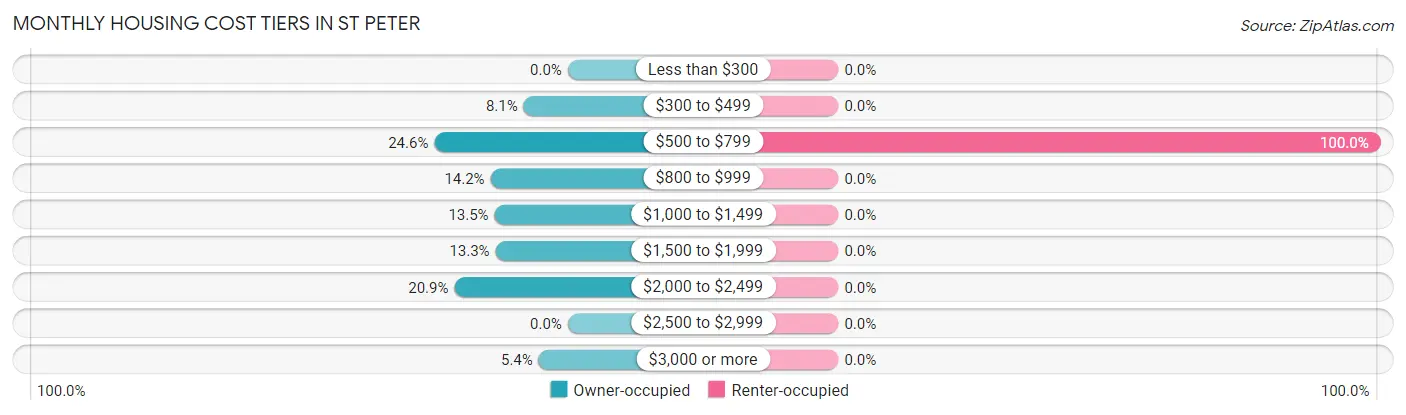
| Monthly Cost | Owner-occupied | Renter-occupied |
| Less than $300 | 0 (0.0%) | 0 (0.0%) |
| $300 to $499 | 44 (8.1%) | 0 (0.0%) |
| $500 to $799 | 133 (24.6%) | 14 (100.0%) |
| $800 to $999 | 77 (14.2%) | 0 (0.0%) |
| $1,000 to $1,499 | 73 (13.5%) | 0 (0.0%) |
| $1,500 to $1,999 | 72 (13.3%) | 0 (0.0%) |
| $2,000 to $2,499 | 113 (20.9%) | 0 (0.0%) |
| $2,500 to $2,999 | 0 (0.0%) | 0 (0.0%) |
| $3,000 or more | 29 (5.4%) | 0 (0.0%) |
| Total | 541 (100.0%) | 14 (100.0%) |
Physical Housing Characteristics in St Peter
Housing Structures in St Peter
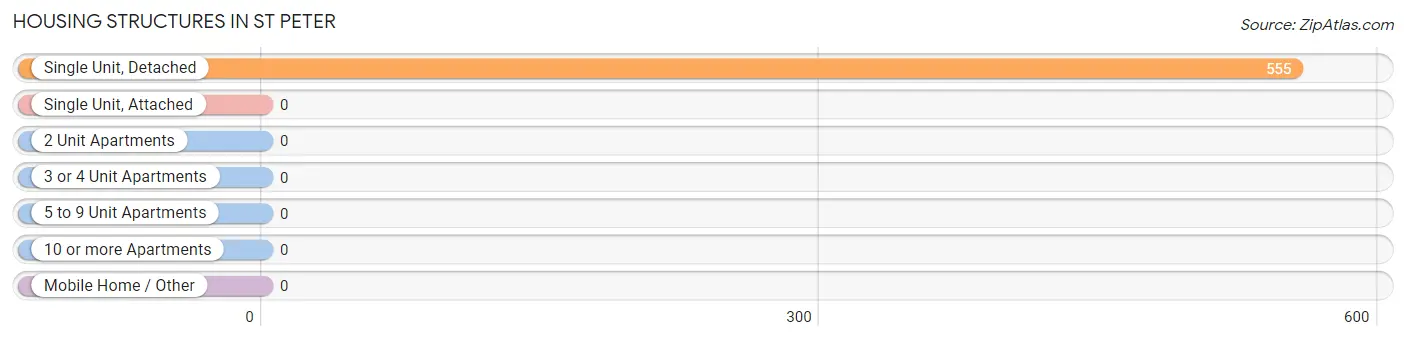
| Structure Type | # Housing Units | % Housing Units |
| Single Unit, Detached | 555 | 100.0% |
| Single Unit, Attached | 0 | 0.0% |
| 2 Unit Apartments | 0 | 0.0% |
| 3 or 4 Unit Apartments | 0 | 0.0% |
| 5 to 9 Unit Apartments | 0 | 0.0% |
| 10 or more Apartments | 0 | 0.0% |
| Mobile Home / Other | 0 | 0.0% |
| Total | 555 | 100.0% |
Housing Structures by Occupancy in St Peter
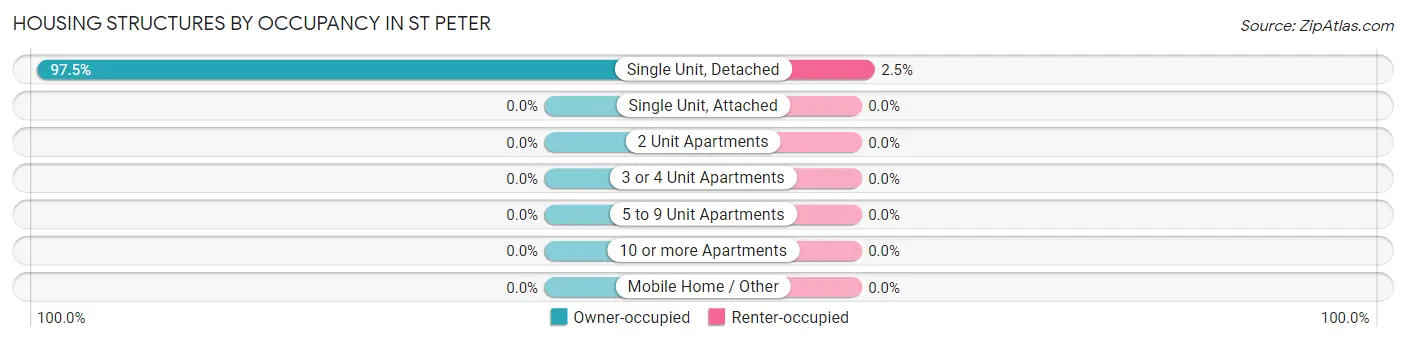
| Structure Type | Owner-occupied | Renter-occupied |
| Single Unit, Detached | 541 (97.5%) | 14 (2.5%) |
| Single Unit, Attached | 0 (0.0%) | 0 (0.0%) |
| 2 Unit Apartments | 0 (0.0%) | 0 (0.0%) |
| 3 or 4 Unit Apartments | 0 (0.0%) | 0 (0.0%) |
| 5 to 9 Unit Apartments | 0 (0.0%) | 0 (0.0%) |
| 10 or more Apartments | 0 (0.0%) | 0 (0.0%) |
| Mobile Home / Other | 0 (0.0%) | 0 (0.0%) |
| Total | 541 (97.5%) | 14 (2.5%) |
Housing Structures by Number of Rooms in St Peter
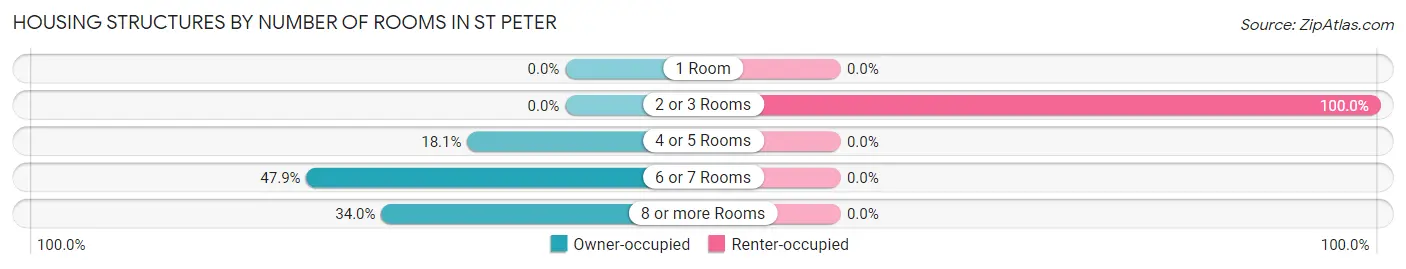
| Number of Rooms | Owner-occupied | Renter-occupied |
| 1 Room | 0 (0.0%) | 0 (0.0%) |
| 2 or 3 Rooms | 0 (0.0%) | 14 (100.0%) |
| 4 or 5 Rooms | 98 (18.1%) | 0 (0.0%) |
| 6 or 7 Rooms | 259 (47.9%) | 0 (0.0%) |
| 8 or more Rooms | 184 (34.0%) | 0 (0.0%) |
| Total | 541 (100.0%) | 14 (100.0%) |
Housing Structure by Heating Type in St Peter
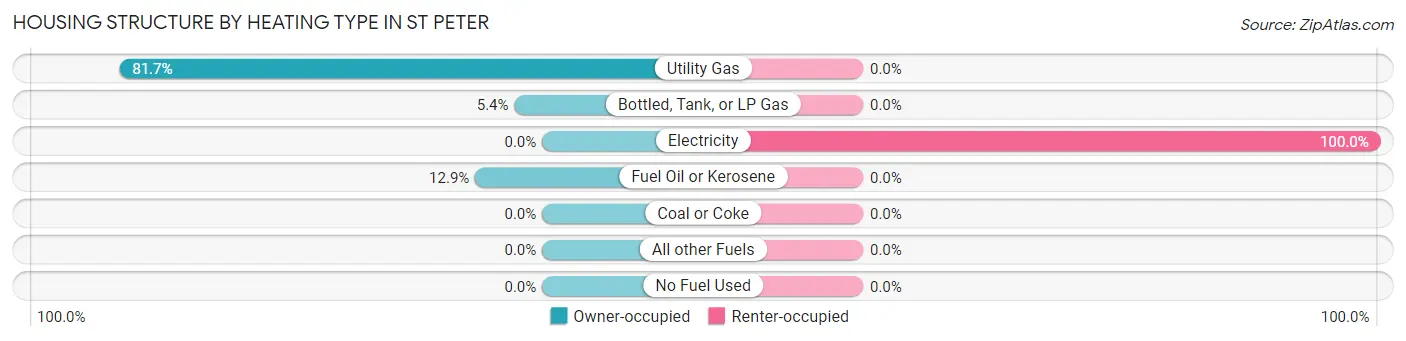
| Heating Type | Owner-occupied | Renter-occupied |
| Utility Gas | 442 (81.7%) | 0 (0.0%) |
| Bottled, Tank, or LP Gas | 29 (5.4%) | 0 (0.0%) |
| Electricity | 0 (0.0%) | 14 (100.0%) |
| Fuel Oil or Kerosene | 70 (12.9%) | 0 (0.0%) |
| Coal or Coke | 0 (0.0%) | 0 (0.0%) |
| All other Fuels | 0 (0.0%) | 0 (0.0%) |
| No Fuel Used | 0 (0.0%) | 0 (0.0%) |
| Total | 541 (100.0%) | 14 (100.0%) |
Household Vehicle Usage in St Peter
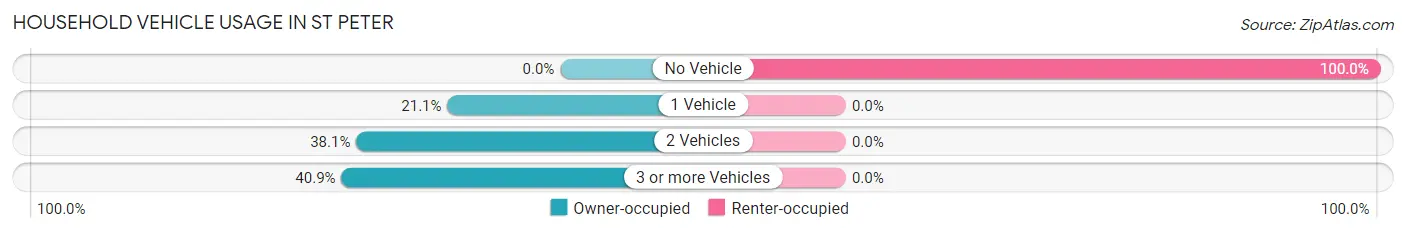
| Vehicles per Household | Owner-occupied | Renter-occupied |
| No Vehicle | 0 (0.0%) | 14 (100.0%) |
| 1 Vehicle | 114 (21.1%) | 0 (0.0%) |
| 2 Vehicles | 206 (38.1%) | 0 (0.0%) |
| 3 or more Vehicles | 221 (40.8%) | 0 (0.0%) |
| Total | 541 (100.0%) | 14 (100.0%) |
Real Estate & Mortgages in St Peter
Real Estate and Mortgage Overview in St Peter
| Characteristic | Without Mortgage | With Mortgage |
| Housing Units | 204 | 337 |
| Median Property Value | $409,700 | $290,100 |
| Median Household Income | $167,720 | $158 |
| Monthly Housing Costs | $623 | $29 |
| Real Estate Taxes | $4,235 | $0 |
Property Value by Mortgage Status in St Peter
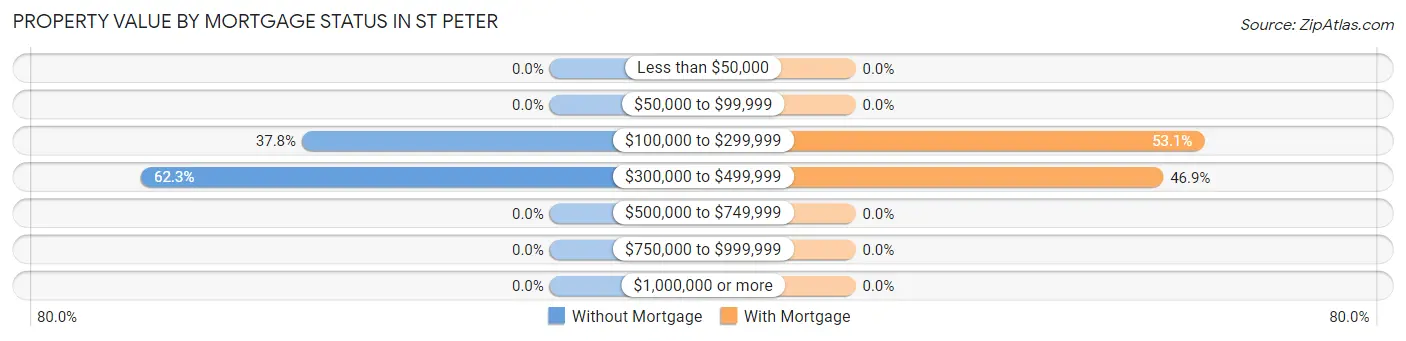
| Property Value | Without Mortgage | With Mortgage |
| Less than $50,000 | 0 (0.0%) | 0 (0.0%) |
| $50,000 to $99,999 | 0 (0.0%) | 0 (0.0%) |
| $100,000 to $299,999 | 77 (37.8%) | 179 (53.1%) |
| $300,000 to $499,999 | 127 (62.3%) | 158 (46.9%) |
| $500,000 to $749,999 | 0 (0.0%) | 0 (0.0%) |
| $750,000 to $999,999 | 0 (0.0%) | 0 (0.0%) |
| $1,000,000 or more | 0 (0.0%) | 0 (0.0%) |
| Total | 204 (100.0%) | 337 (100.0%) |
Household Income by Mortgage Status in St Peter
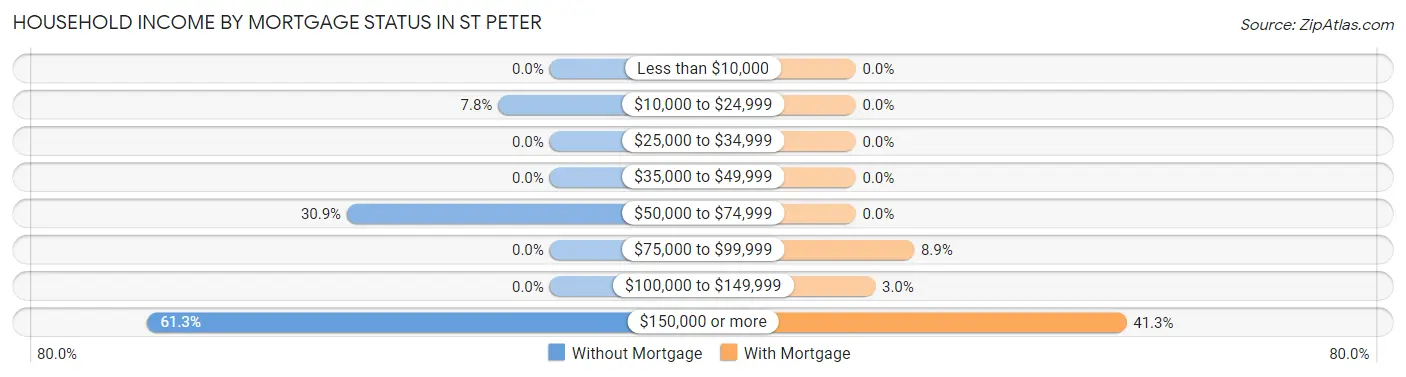
| Household Income | Without Mortgage | With Mortgage |
| Less than $10,000 | 0 (0.0%) | 0 (0.0%) |
| $10,000 to $24,999 | 16 (7.8%) | 0 (0.0%) |
| $25,000 to $34,999 | 0 (0.0%) | 0 (0.0%) |
| $35,000 to $49,999 | 0 (0.0%) | 0 (0.0%) |
| $50,000 to $74,999 | 63 (30.9%) | 0 (0.0%) |
| $75,000 to $99,999 | 0 (0.0%) | 30 (8.9%) |
| $100,000 to $149,999 | 0 (0.0%) | 10 (3.0%) |
| $150,000 or more | 125 (61.3%) | 139 (41.2%) |
| Total | 204 (100.0%) | 337 (100.0%) |
Property Value to Household Income Ratio in St Peter
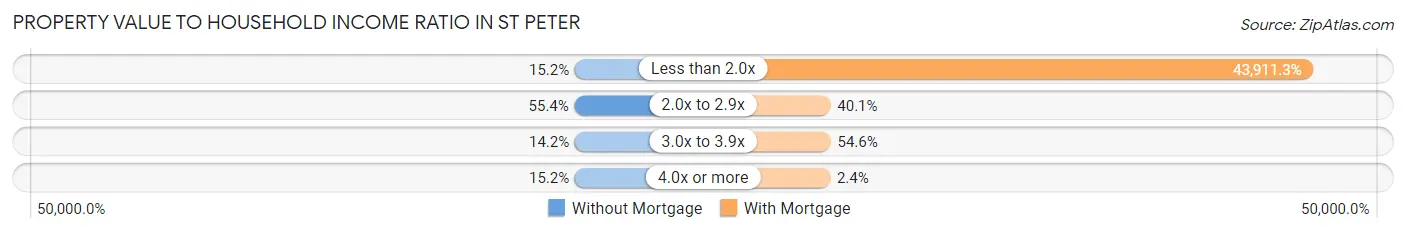
| Value-to-Income Ratio | Without Mortgage | With Mortgage |
| Less than 2.0x | 31 (15.2%) | 147,981 (43,911.3%) |
| 2.0x to 2.9x | 113 (55.4%) | 135 (40.1%) |
| 3.0x to 3.9x | 29 (14.2%) | 184 (54.6%) |
| 4.0x or more | 31 (15.2%) | 8 (2.4%) |
| Total | 204 (100.0%) | 337 (100.0%) |
Real Estate Taxes by Mortgage Status in St Peter

| Property Taxes | Without Mortgage | With Mortgage |
| Less than $800 | 0 (0.0%) | 0 (0.0%) |
| $800 to $1,499 | 0 (0.0%) | 0 (0.0%) |
| $800 to $1,499 | 204 (100.0%) | 13 (3.9%) |
| Total | 204 (100.0%) | 337 (100.0%) |
Health & Disability in St Peter
Health Insurance Coverage by Age in St Peter
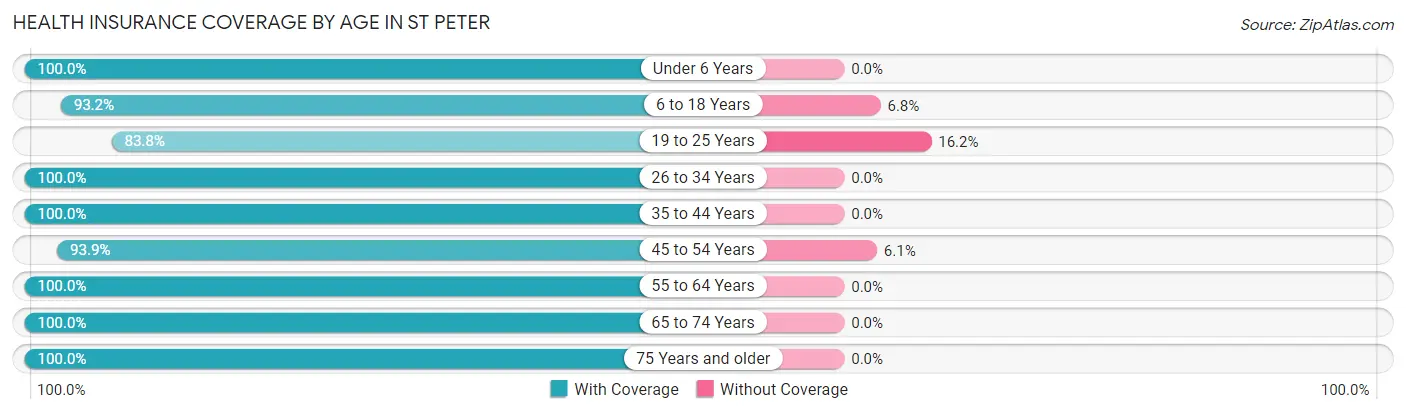
| Age Bracket | With Coverage | Without Coverage |
| Under 6 Years | 148 (100.0%) | 0 (0.0%) |
| 6 to 18 Years | 193 (93.2%) | 14 (6.8%) |
| 19 to 25 Years | 31 (83.8%) | 6 (16.2%) |
| 26 to 34 Years | 177 (100.0%) | 0 (0.0%) |
| 35 to 44 Years | 85 (100.0%) | 0 (0.0%) |
| 45 to 54 Years | 247 (93.9%) | 16 (6.1%) |
| 55 to 64 Years | 169 (100.0%) | 0 (0.0%) |
| 65 to 74 Years | 187 (100.0%) | 0 (0.0%) |
| 75 Years and older | 92 (100.0%) | 0 (0.0%) |
| Total | 1,329 (97.4%) | 36 (2.6%) |
Health Insurance Coverage by Citizenship Status in St Peter

| Citizenship Status | With Coverage | Without Coverage |
| Native Born | 148 (100.0%) | 0 (0.0%) |
| Foreign Born, Citizen | 193 (93.2%) | 14 (6.8%) |
| Foreign Born, not a Citizen | 31 (83.8%) | 6 (16.2%) |
Health Insurance Coverage by Household Income in St Peter
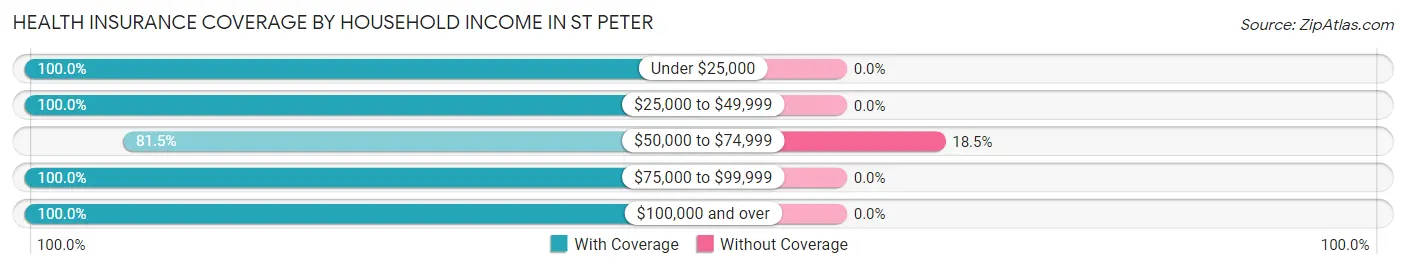
| Household Income | With Coverage | Without Coverage |
| Under $25,000 | 16 (100.0%) | 0 (0.0%) |
| $25,000 to $49,999 | 14 (100.0%) | 0 (0.0%) |
| $50,000 to $74,999 | 159 (81.5%) | 36 (18.5%) |
| $75,000 to $99,999 | 14 (100.0%) | 0 (0.0%) |
| $100,000 and over | 1,126 (100.0%) | 0 (0.0%) |
Public vs Private Health Insurance Coverage by Age in St Peter
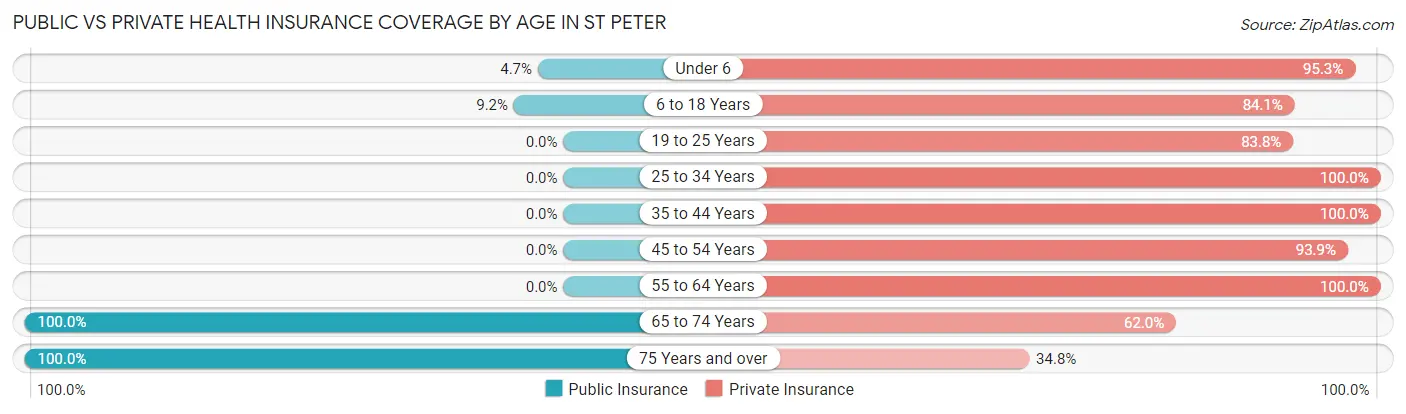
| Age Bracket | Public Insurance | Private Insurance |
| Under 6 | 7 (4.7%) | 141 (95.3%) |
| 6 to 18 Years | 19 (9.2%) | 174 (84.1%) |
| 19 to 25 Years | 0 (0.0%) | 31 (83.8%) |
| 25 to 34 Years | 0 (0.0%) | 177 (100.0%) |
| 35 to 44 Years | 0 (0.0%) | 85 (100.0%) |
| 45 to 54 Years | 0 (0.0%) | 247 (93.9%) |
| 55 to 64 Years | 0 (0.0%) | 169 (100.0%) |
| 65 to 74 Years | 187 (100.0%) | 116 (62.0%) |
| 75 Years and over | 92 (100.0%) | 32 (34.8%) |
| Total | 305 (22.3%) | 1,172 (85.9%) |
Disability Status by Sex by Age in St Peter
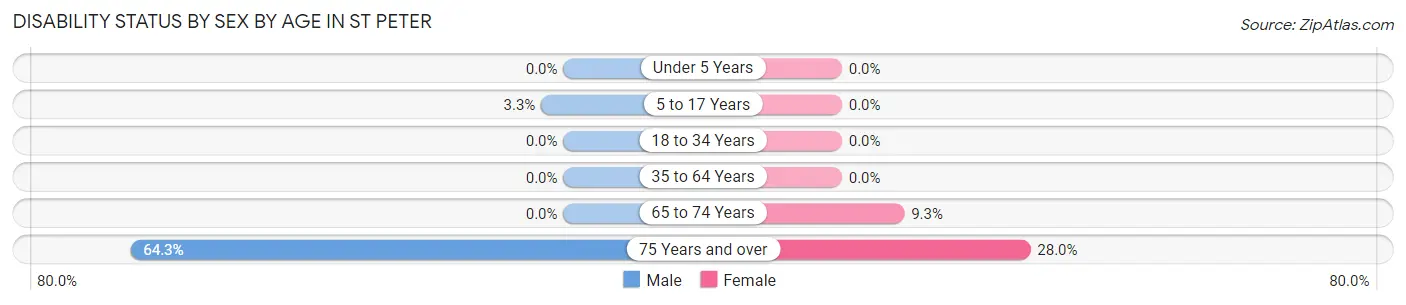
| Age Bracket | Male | Female |
| Under 5 Years | 0 (0.0%) | 0 (0.0%) |
| 5 to 17 Years | 5 (3.3%) | 0 (0.0%) |
| 18 to 34 Years | 0 (0.0%) | 0 (0.0%) |
| 35 to 64 Years | 0 (0.0%) | 0 (0.0%) |
| 65 to 74 Years | 0 (0.0%) | 14 (9.3%) |
| 75 Years and over | 27 (64.3%) | 14 (28.0%) |
Disability Class by Sex by Age in St Peter
Disability Class: Hearing Difficulty
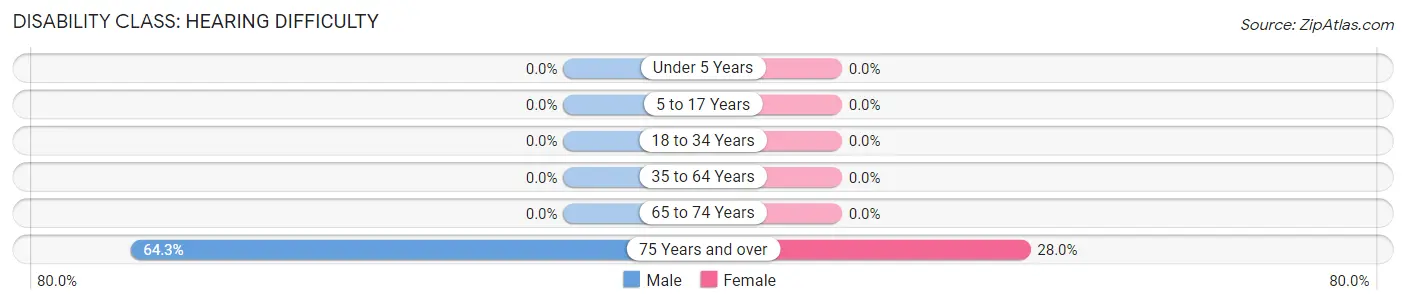
| Age Bracket | Male | Female |
| Under 5 Years | 0 (0.0%) | 0 (0.0%) |
| 5 to 17 Years | 0 (0.0%) | 0 (0.0%) |
| 18 to 34 Years | 0 (0.0%) | 0 (0.0%) |
| 35 to 64 Years | 0 (0.0%) | 0 (0.0%) |
| 65 to 74 Years | 0 (0.0%) | 0 (0.0%) |
| 75 Years and over | 27 (64.3%) | 14 (28.0%) |
Disability Class: Vision Difficulty
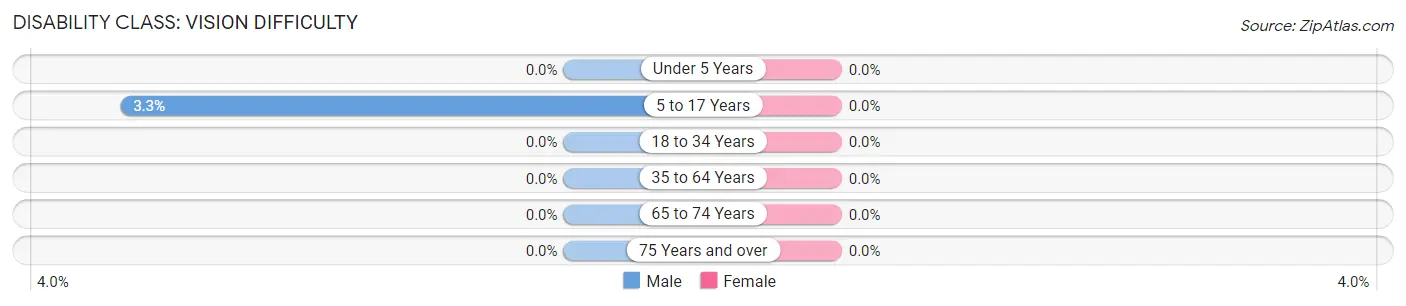
| Age Bracket | Male | Female |
| Under 5 Years | 0 (0.0%) | 0 (0.0%) |
| 5 to 17 Years | 5 (3.3%) | 0 (0.0%) |
| 18 to 34 Years | 0 (0.0%) | 0 (0.0%) |
| 35 to 64 Years | 0 (0.0%) | 0 (0.0%) |
| 65 to 74 Years | 0 (0.0%) | 0 (0.0%) |
| 75 Years and over | 0 (0.0%) | 0 (0.0%) |
Disability Class: Cognitive Difficulty
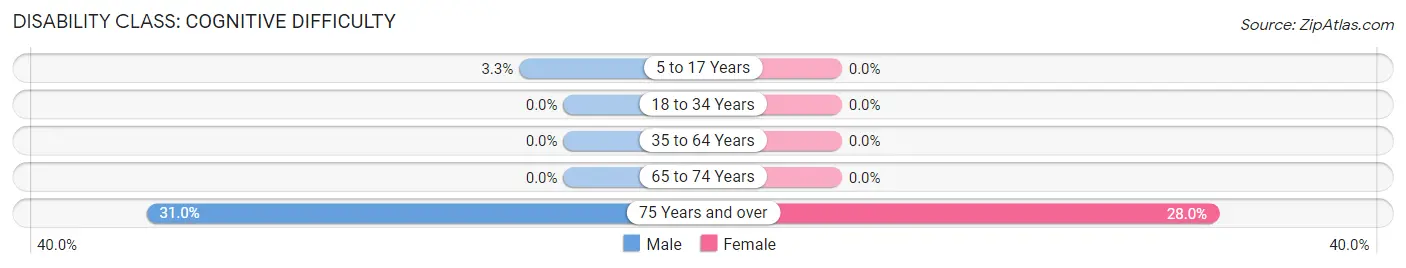
| Age Bracket | Male | Female |
| 5 to 17 Years | 5 (3.3%) | 0 (0.0%) |
| 18 to 34 Years | 0 (0.0%) | 0 (0.0%) |
| 35 to 64 Years | 0 (0.0%) | 0 (0.0%) |
| 65 to 74 Years | 0 (0.0%) | 0 (0.0%) |
| 75 Years and over | 13 (30.9%) | 14 (28.0%) |
Disability Class: Ambulatory Difficulty
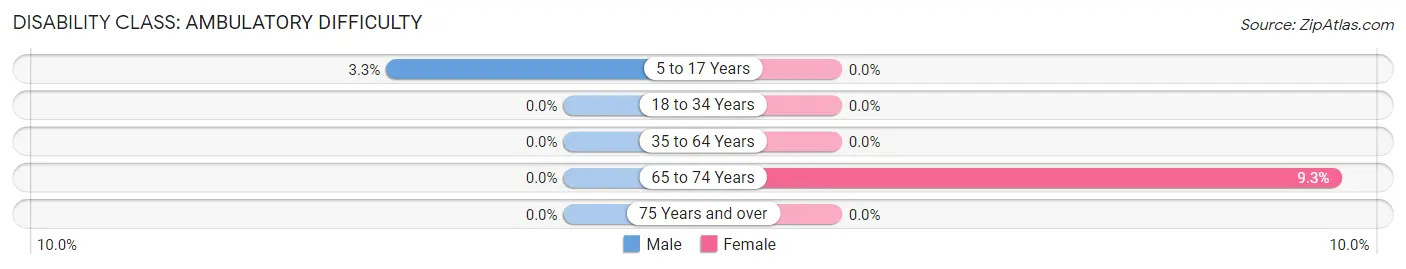
| Age Bracket | Male | Female |
| 5 to 17 Years | 5 (3.3%) | 0 (0.0%) |
| 18 to 34 Years | 0 (0.0%) | 0 (0.0%) |
| 35 to 64 Years | 0 (0.0%) | 0 (0.0%) |
| 65 to 74 Years | 0 (0.0%) | 14 (9.3%) |
| 75 Years and over | 0 (0.0%) | 0 (0.0%) |
Disability Class: Self-Care Difficulty
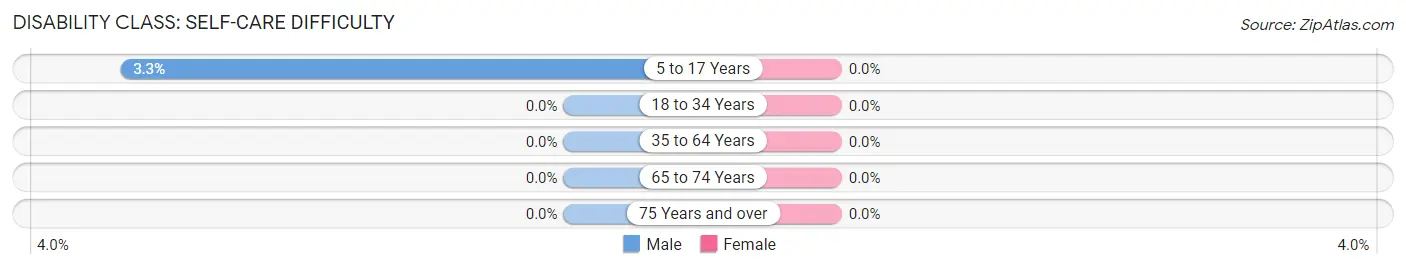
| Age Bracket | Male | Female |
| 5 to 17 Years | 5 (3.3%) | 0 (0.0%) |
| 18 to 34 Years | 0 (0.0%) | 0 (0.0%) |
| 35 to 64 Years | 0 (0.0%) | 0 (0.0%) |
| 65 to 74 Years | 0 (0.0%) | 0 (0.0%) |
| 75 Years and over | 0 (0.0%) | 0 (0.0%) |
Technology Access in St Peter
Computing Device Access in St Peter
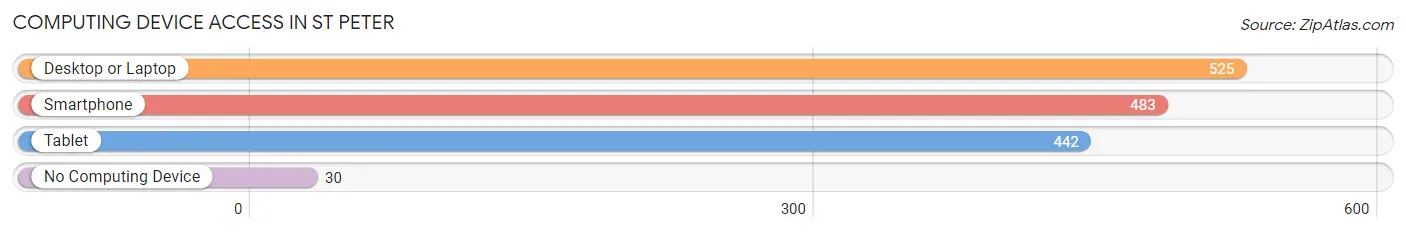
| Device Type | # Households | % Households |
| Desktop or Laptop | 525 | 94.6% |
| Smartphone | 483 | 87.0% |
| Tablet | 442 | 79.6% |
| No Computing Device | 30 | 5.4% |
| Total | 555 | 100.0% |
Internet Access in St Peter
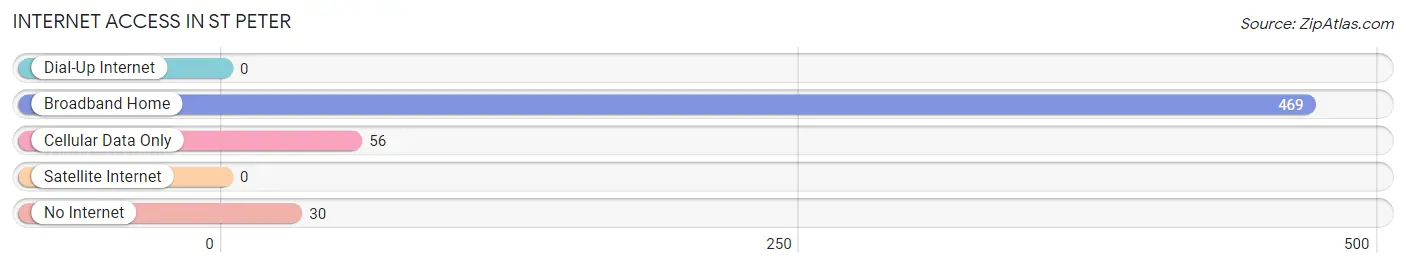
| Internet Type | # Households | % Households |
| Dial-Up Internet | 0 | 0.0% |
| Broadband Home | 469 | 84.5% |
| Cellular Data Only | 56 | 10.1% |
| Satellite Internet | 0 | 0.0% |
| No Internet | 30 | 5.4% |
| Total | 555 | 100.0% |
St Peter Summary
Peter, Wisconsin is a small town located in the southeastern corner of the state, in the county of St. Croix. It is situated on the banks of the St. Croix River, which forms the border between Wisconsin and Minnesota. The town was founded in 1854 and has a population of approximately 1,500 people.
Geography
Peter, Wisconsin is located in the southeastern corner of the state, in the county of St. Croix. It is situated on the banks of the St. Croix River, which forms the border between Wisconsin and Minnesota. The town is located in a rural area, with the nearest major city being Minneapolis, Minnesota, which is about 40 miles away. The town is surrounded by rolling hills and forests, and is home to a variety of wildlife, including deer, foxes, and coyotes.
History
Peter, Wisconsin was founded in 1854 by a group of settlers from New York. The town was named after Peter Stuyvesant, the last Dutch governor of New Amsterdam. The settlers were attracted to the area due to its abundance of natural resources, including timber and fertile soil. The town quickly grew and prospered, and by the late 19th century, it had become a thriving agricultural community.
In the early 20th century, the town began to experience a decline in population as many of its residents moved away in search of better economic opportunities. However, the town has experienced a resurgence in recent years, as many people have moved back to the area in search of a more rural lifestyle.
Economy
The economy of Peter, Wisconsin is largely based on agriculture. The town is home to several farms, which produce a variety of crops, including corn, soybeans, and hay. The town also has a number of small businesses, including restaurants, stores, and a local brewery.
Demographics
As of the 2010 census, the population of Peter, Wisconsin was 1,500. The town is predominantly white, with 95.3% of the population identifying as such. The median household income is $50,000, and the median age is 43.
Conclusion
Peter, Wisconsin is a small town located in the southeastern corner of the state, in the county of St. Croix. It is situated on the banks of the St. Croix River, which forms the border between Wisconsin and Minnesota. The town was founded in 1854 and has a population of approximately 1,500 people. The economy of Peter, Wisconsin is largely based on agriculture, and the town is predominantly white. The median household income is $50,000, and the median age is 43.
Common Questions
What is Per Capita Income in St Peter?
Per Capita income in St Peter is $55,926.
What is the Median Family Income in St Peter?
Median Family Income in St Peter is $149,808.
What is the Median Household income in St Peter?
Median Household Income in St Peter is $153,188.
What is Income or Wage Gap in St Peter?
Income or Wage Gap in St Peter is 40.4%.
Women in St Peter earn 59.6 cents for every dollar earned by a man.
What is Inequality or Gini Index in St Peter?
Inequality or Gini Index in St Peter is 0.24.
What is the Total Population of St Peter?
Total Population of St Peter is 1,365.
What is the Total Male Population of St Peter?
Total Male Population of St Peter is 745.
What is the Total Female Population of St Peter?
Total Female Population of St Peter is 620.
What is the Ratio of Males per 100 Females in St Peter?
There are 120.16 Males per 100 Females in St Peter.
What is the Ratio of Females per 100 Males in St Peter?
There are 83.22 Females per 100 Males in St Peter.
What is the Median Population Age in St Peter?
Median Population Age in St Peter is 46.3 Years.
What is the Average Family Size in St Peter
Average Family Size in St Peter is 2.9 People.
What is the Average Household Size in St Peter
Average Household Size in St Peter is 2.5 People.
How Large is the Labor Force in St Peter?
There are 734 People in the Labor Forcein in St Peter.
What is the Percentage of People in the Labor Force in St Peter?
69.8% of People are in the Labor Force in St Peter.
What is the Unemployment Rate in St Peter?
Unemployment Rate in St Peter is 1.2%.