Jackpot, NV Map & Demographics
Jackpot Map
Jackpot Overview
$25,171
PER CAPITA INCOME
$62,692
AVG HOUSEHOLD INCOME
7.7%
WAGE / INCOME GAP [ % ]
92.3¢/ $1
WAGE / INCOME GAP [ $ ]
0.43
INEQUALITY / GINI INDEX
1,215
TOTAL POPULATION
765
MALE POPULATION
450
FEMALE POPULATION
170.00
MALES / 100 FEMALES
58.82
FEMALES / 100 MALES
28.8
MEDIAN AGE
5.5
AVG FAMILY SIZE
3.8
AVG HOUSEHOLD SIZE
866
LABOR FORCE [ PEOPLE ]
89.0%
PERCENT IN LABOR FORCE
14.4%
UNEMPLOYMENT RATE
Jackpot Zip Codes
Jackpot Area Codes
Income in Jackpot
Income Overview in Jackpot
| Characteristic | Number | Measure |
| Per Capita Income | 1,215 | $25,171 |
| Median Family Income | 176 | $0 |
| Mean Family Income | 176 | $83,723 |
| Median Household Income | 316 | $62,692 |
| Mean Household Income | 316 | $71,891 |
| Income Deficit | 176 | $0 |
| Wage / Income Gap (%) | 1,215 | 7.67% |
| Wage / Income Gap ($) | 1,215 | 92.33¢ per $1 |
| Gini / Inequality Index | 1,215 | 0.43 |
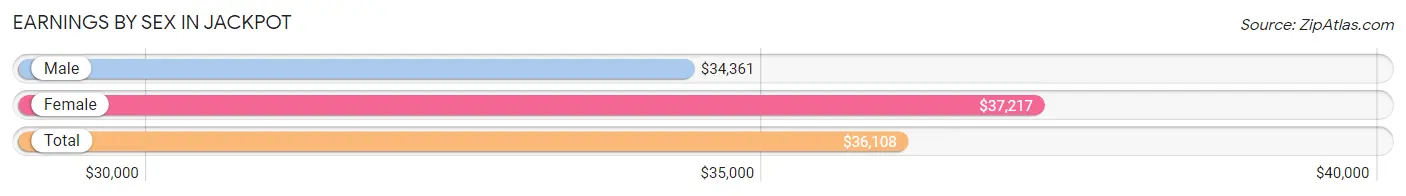
Earnings by Sex in Jackpot
Average Earnings in Jackpot are $36,108, $34,361 for men and $37,217 for women, a difference of 7.7%.
| Sex | Number | Average Earnings |
| Male | 479 (64.6%) | $34,361 |
| Female | 262 (35.4%) | $37,217 |
| Total | 741 (100.0%) | $36,108 |
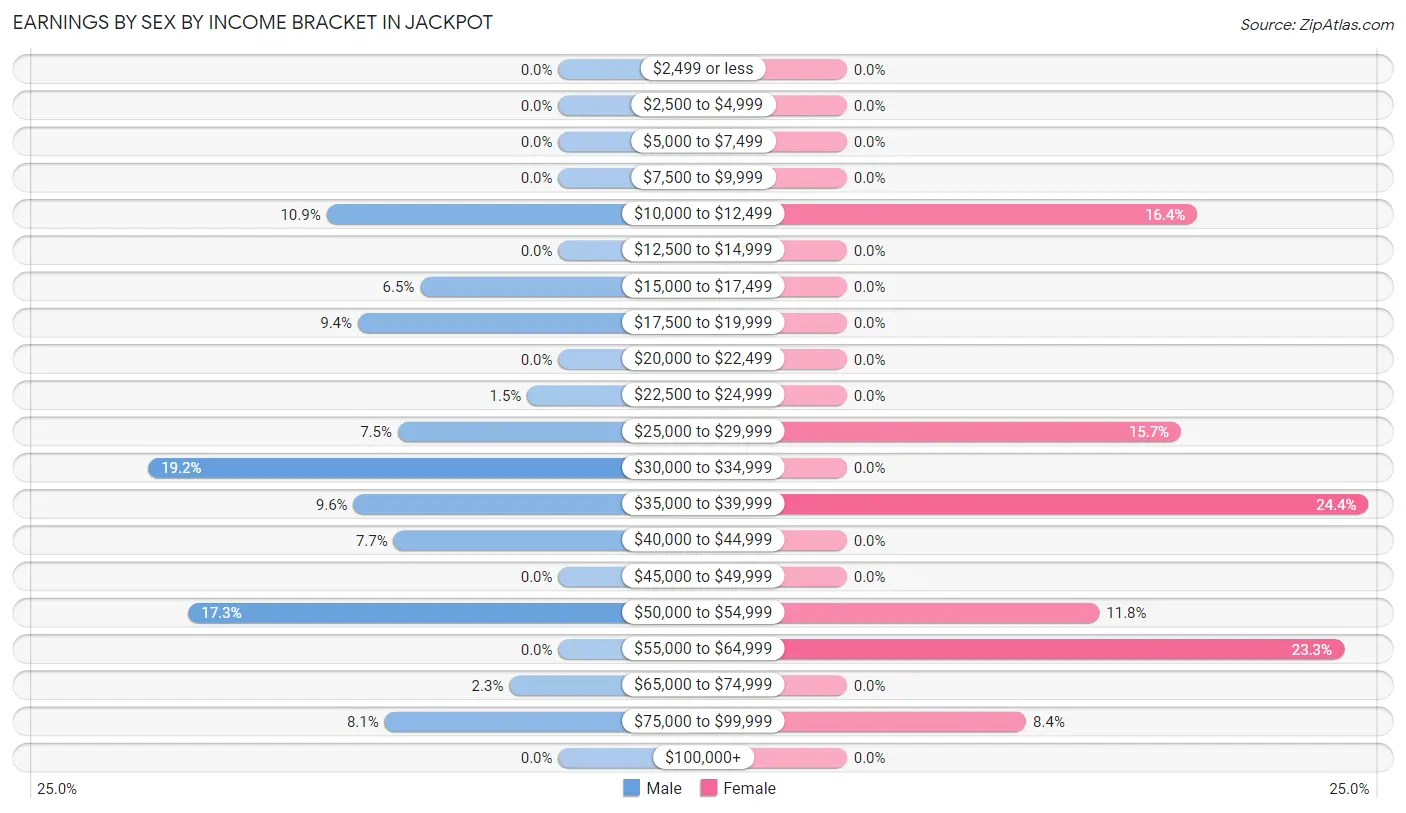
Earnings by Sex by Income Bracket in Jackpot
The most common earnings brackets in Jackpot are $30,000 to $34,999 for men (92 | 19.2%) and $35,000 to $39,999 for women (64 | 24.4%).
| Income | Male | Female |
| $2,499 or less | 0 (0.0%) | 0 (0.0%) |
| $2,500 to $4,999 | 0 (0.0%) | 0 (0.0%) |
| $5,000 to $7,499 | 0 (0.0%) | 0 (0.0%) |
| $7,500 to $9,999 | 0 (0.0%) | 0 (0.0%) |
| $10,000 to $12,499 | 52 (10.9%) | 43 (16.4%) |
| $12,500 to $14,999 | 0 (0.0%) | 0 (0.0%) |
| $15,000 to $17,499 | 31 (6.5%) | 0 (0.0%) |
| $17,500 to $19,999 | 45 (9.4%) | 0 (0.0%) |
| $20,000 to $22,499 | 0 (0.0%) | 0 (0.0%) |
| $22,500 to $24,999 | 7 (1.5%) | 0 (0.0%) |
| $25,000 to $29,999 | 36 (7.5%) | 41 (15.7%) |
| $30,000 to $34,999 | 92 (19.2%) | 0 (0.0%) |
| $35,000 to $39,999 | 46 (9.6%) | 64 (24.4%) |
| $40,000 to $44,999 | 37 (7.7%) | 0 (0.0%) |
| $45,000 to $49,999 | 0 (0.0%) | 0 (0.0%) |
| $50,000 to $54,999 | 83 (17.3%) | 31 (11.8%) |
| $55,000 to $64,999 | 0 (0.0%) | 61 (23.3%) |
| $65,000 to $74,999 | 11 (2.3%) | 0 (0.0%) |
| $75,000 to $99,999 | 39 (8.1%) | 22 (8.4%) |
| $100,000+ | 0 (0.0%) | 0 (0.0%) |
| Total | 479 (100.0%) | 262 (100.0%) |
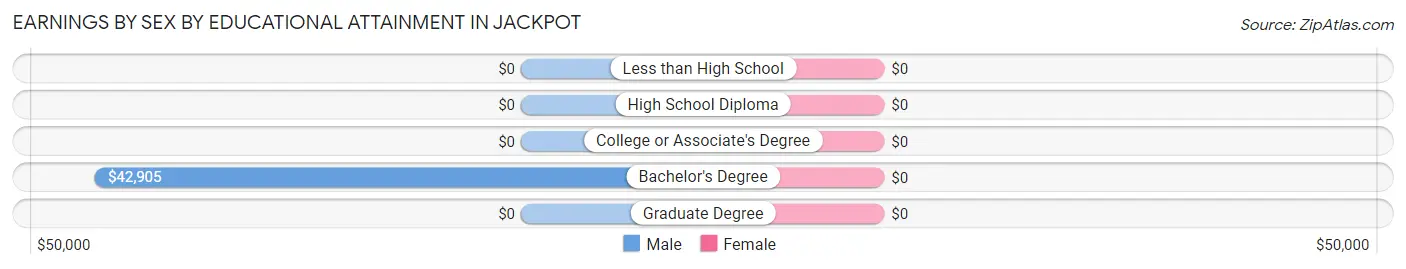
Earnings by Sex by Educational Attainment in Jackpot
| Educational Attainment | Male Income | Female Income |
| Less than High School | - | - |
| High School Diploma | - | - |
| College or Associate's Degree | - | - |
| Bachelor's Degree | $42,905 | $0 |
| Graduate Degree | - | - |
| Total | $42,635 | $38,068 |
Family Income in Jackpot
Family Income Brackets in Jackpot
According to the Jackpot family income data, there are 73 families falling into the $75,000 to $99,999 income range, which is the most common income bracket and makes up 41.5% of all families.
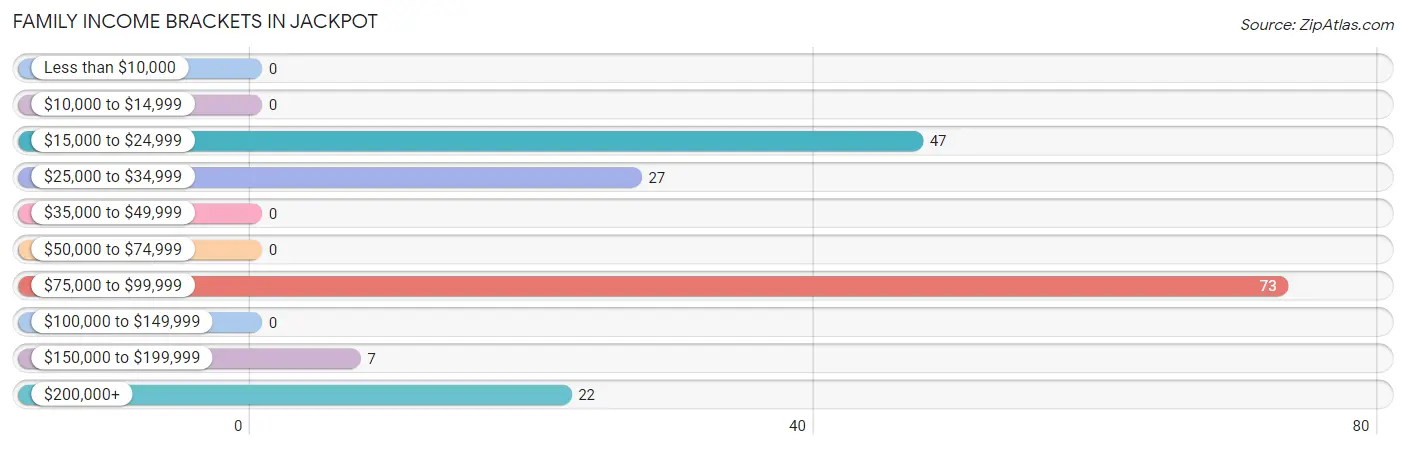
| Income Bracket | # Families | % Families |
| Less than $10,000 | 0 | 0.0% |
| $10,000 to $14,999 | 0 | 0.0% |
| $15,000 to $24,999 | 47 | 26.7% |
| $25,000 to $34,999 | 27 | 15.3% |
| $35,000 to $49,999 | 0 | 0.0% |
| $50,000 to $74,999 | 0 | 0.0% |
| $75,000 to $99,999 | 73 | 41.5% |
| $100,000 to $149,999 | 0 | 0.0% |
| $150,000 to $199,999 | 7 | 4.0% |
| $200,000+ | 22 | 12.5% |
Family Income by Famaliy Size in Jackpot
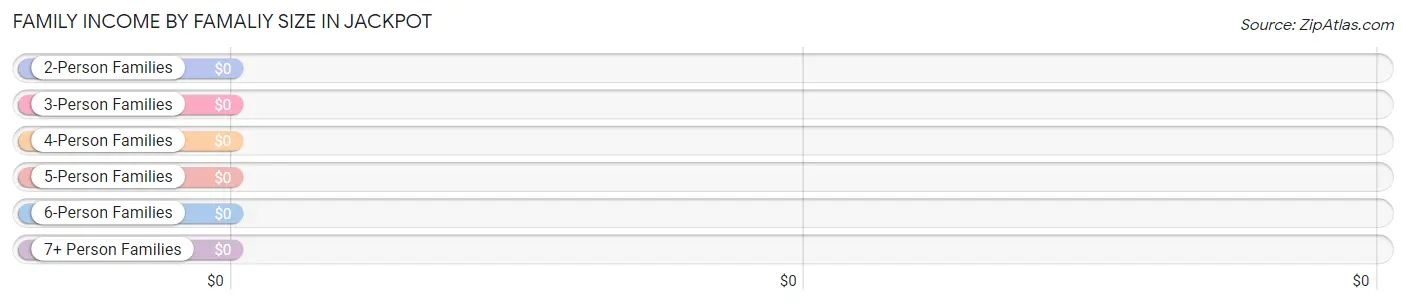
| Income Bracket | # Families | Median Income |
| 2-Person Families | 123 (69.9%) | $0 |
| 3-Person Families | 0 (0.0%) | $0 |
| 4-Person Families | 0 (0.0%) | $0 |
| 5-Person Families | 0 (0.0%) | $0 |
| 6-Person Families | 0 (0.0%) | $0 |
| 7+ Person Families | 53 (30.1%) | $0 |
| Total | 176 (100.0%) | $0 |
Family Income by Number of Earners in Jackpot
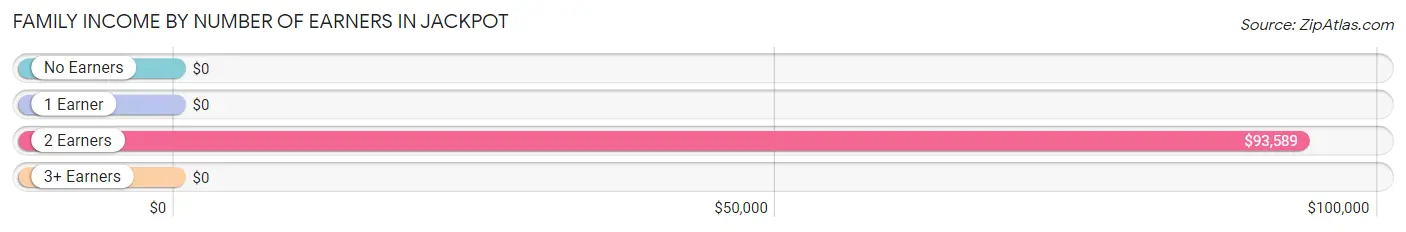
| Number of Earners | # Families | Median Income |
| No Earners | 12 (6.8%) | $0 |
| 1 Earner | 62 (35.2%) | $0 |
| 2 Earners | 49 (27.8%) | $93,589 |
| 3+ Earners | 53 (30.1%) | $0 |
| Total | 176 (100.0%) | $0 |
Household Income in Jackpot
Household Income Brackets in Jackpot
With 106 households falling in the category, the $75,000 to $99,999 income range is the most frequent in Jackpot, accounting for 33.5% of all households.
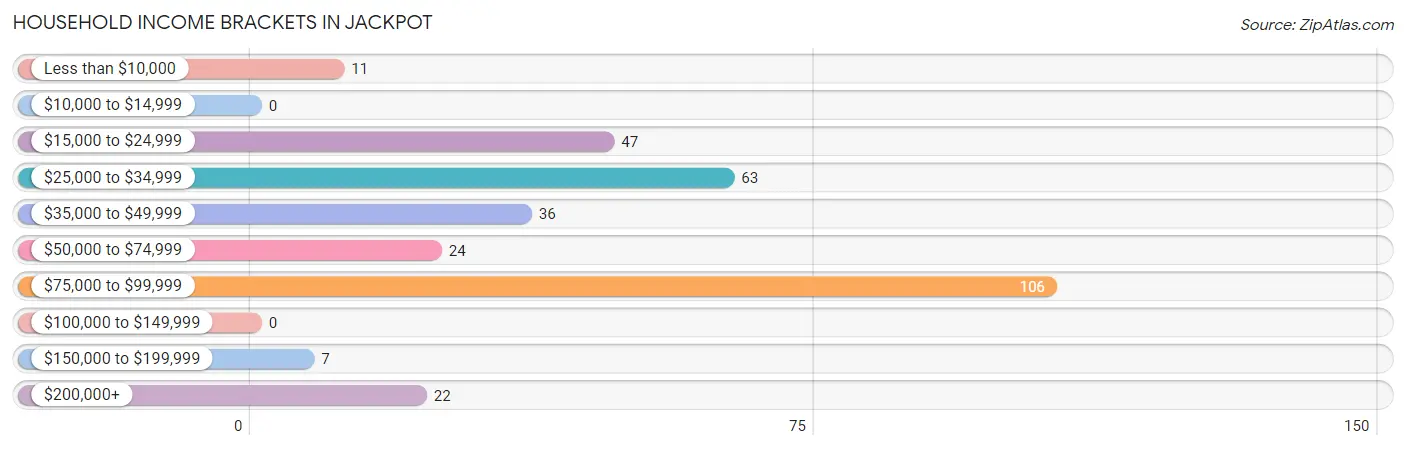
| Income Bracket | # Households | % Households |
| Less than $10,000 | 11 | 3.5% |
| $10,000 to $14,999 | 0 | 0.0% |
| $15,000 to $24,999 | 47 | 14.9% |
| $25,000 to $34,999 | 63 | 19.9% |
| $35,000 to $49,999 | 36 | 11.4% |
| $50,000 to $74,999 | 24 | 7.6% |
| $75,000 to $99,999 | 106 | 33.5% |
| $100,000 to $149,999 | 0 | 0.0% |
| $150,000 to $199,999 | 7 | 2.2% |
| $200,000+ | 22 | 7.0% |
Household Income by Householder Age in Jackpot
The median household income in Jackpot is $62,692, with the highest median household income of $95,040 found in the 45 to 64 years age bracket for the primary householder. A total of 119 households (37.7%) fall into this category.
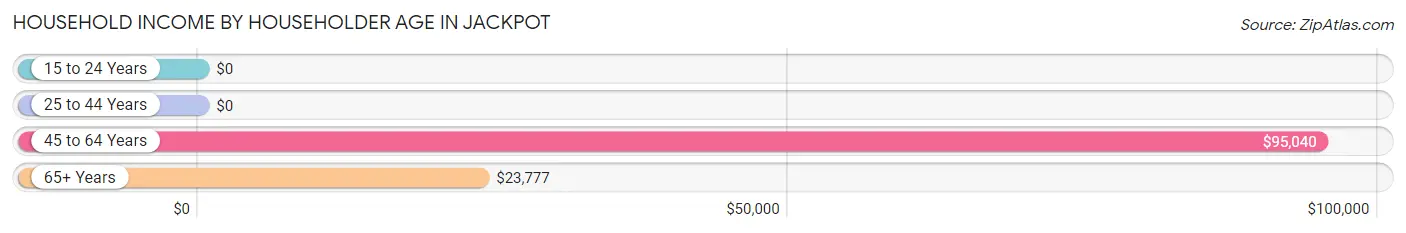
| Income Bracket | # Households | Median Income |
| 15 to 24 Years | 0 (0.0%) | $0 |
| 25 to 44 Years | 127 (40.2%) | $0 |
| 45 to 64 Years | 119 (37.7%) | $95,040 |
| 65+ Years | 70 (22.2%) | $23,777 |
| Total | 316 (100.0%) | $62,692 |
Poverty in Jackpot
Income Below Poverty by Sex and Age in Jackpot
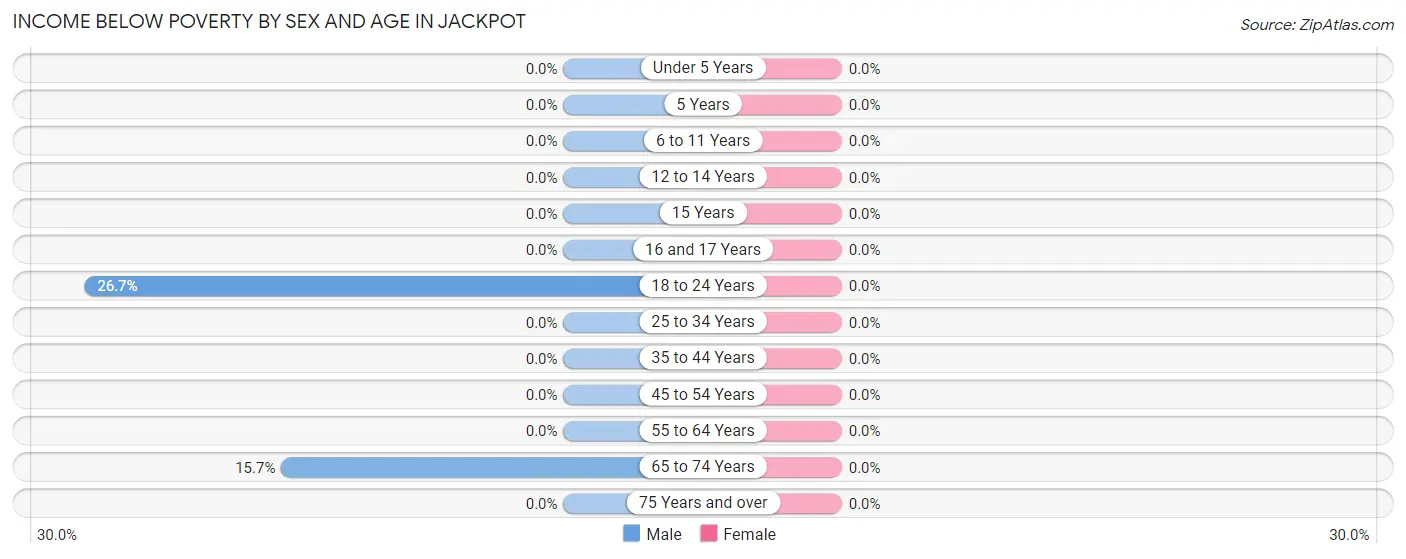
| Age Bracket | Male | Female |
| Under 5 Years | 0 (0.0%) | 0 (0.0%) |
| 5 Years | 0 (0.0%) | 0 (0.0%) |
| 6 to 11 Years | 0 (0.0%) | 0 (0.0%) |
| 12 to 14 Years | 0 (0.0%) | 0 (0.0%) |
| 15 Years | 0 (0.0%) | 0 (0.0%) |
| 16 and 17 Years | 0 (0.0%) | 0 (0.0%) |
| 18 to 24 Years | 52 (26.7%) | 0 (0.0%) |
| 25 to 34 Years | 0 (0.0%) | 0 (0.0%) |
| 35 to 44 Years | 0 (0.0%) | 0 (0.0%) |
| 45 to 54 Years | 0 (0.0%) | 0 (0.0%) |
| 55 to 64 Years | 0 (0.0%) | 0 (0.0%) |
| 65 to 74 Years | 11 (15.7%) | 0 (0.0%) |
| 75 Years and over | 0 (0.0%) | 0 (0.0%) |
| Total | 63 (8.2%) | 0 (0.0%) |
Income Above Poverty by Sex and Age in Jackpot
According to the poverty statistics in Jackpot, males aged 6 to 11 years and females aged under 5 years are the age groups that are most secure financially, with 100.0% of males and 100.0% of females in these age groups living above the poverty line.
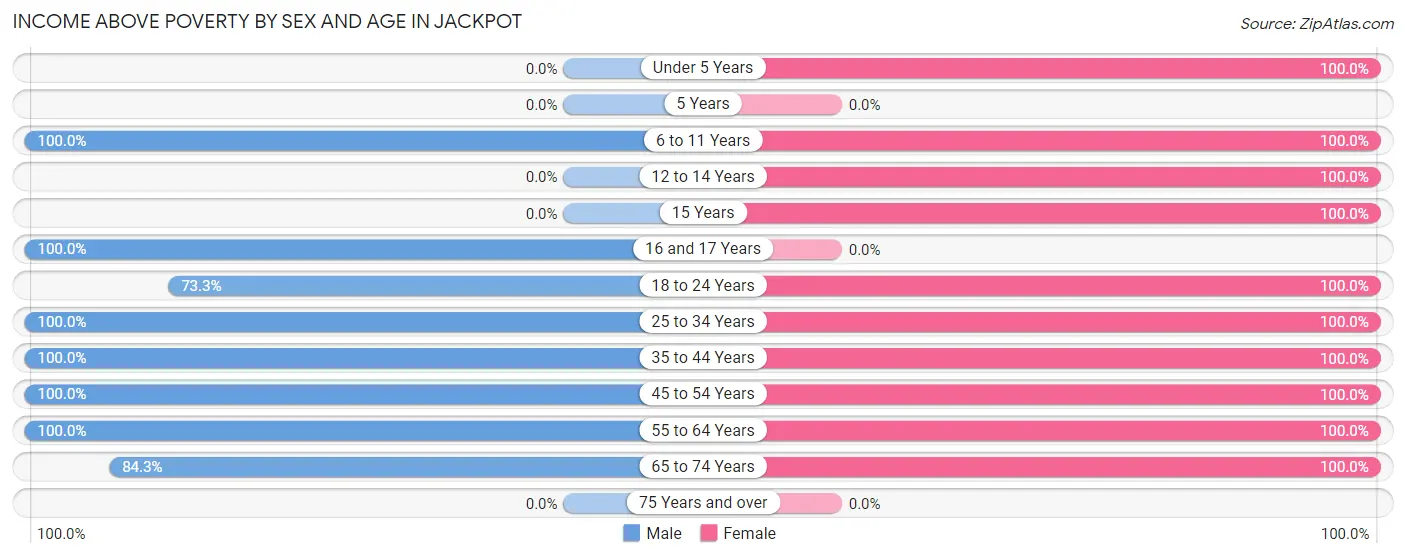
| Age Bracket | Male | Female |
| Under 5 Years | 0 (0.0%) | 25 (100.0%) |
| 5 Years | 0 (0.0%) | 0 (0.0%) |
| 6 to 11 Years | 54 (100.0%) | 96 (100.0%) |
| 12 to 14 Years | 0 (0.0%) | 35 (100.0%) |
| 15 Years | 0 (0.0%) | 32 (100.0%) |
| 16 and 17 Years | 37 (100.0%) | 0 (0.0%) |
| 18 to 24 Years | 143 (73.3%) | 17 (100.0%) |
| 25 to 34 Years | 296 (100.0%) | 31 (100.0%) |
| 35 to 44 Years | 36 (100.0%) | 49 (100.0%) |
| 45 to 54 Years | 22 (100.0%) | 69 (100.0%) |
| 55 to 64 Years | 55 (100.0%) | 53 (100.0%) |
| 65 to 74 Years | 59 (84.3%) | 43 (100.0%) |
| 75 Years and over | 0 (0.0%) | 0 (0.0%) |
| Total | 702 (91.8%) | 450 (100.0%) |
Income Below Poverty Among Married-Couple Families in Jackpot
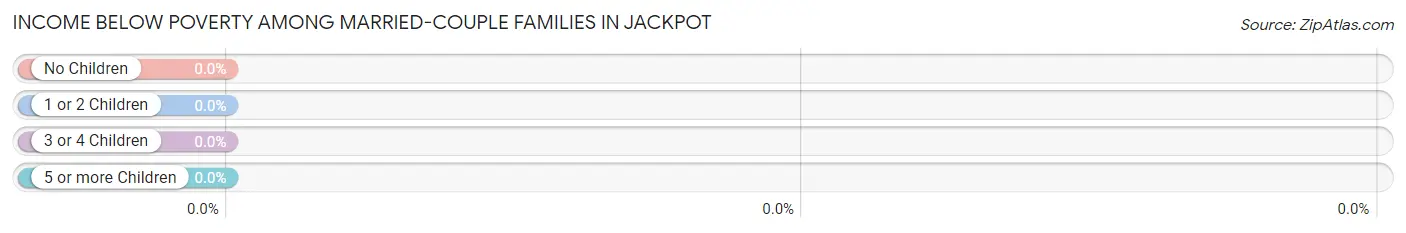
| Children | Above Poverty | Below Poverty |
| No Children | 85 (100.0%) | 0 (0.0%) |
| 1 or 2 Children | 0 (0.0%) | 0 (0.0%) |
| 3 or 4 Children | 31 (100.0%) | 0 (0.0%) |
| 5 or more Children | 0 (0.0%) | 0 (0.0%) |
| Total | 116 (100.0%) | 0 (0.0%) |
Income Below Poverty Among Single-Parent Households in Jackpot
| Children | Single Father | Single Mother |
| No Children | 0 (0.0%) | 0 (0.0%) |
| 1 or 2 Children | 0 (0.0%) | 0 (0.0%) |
| 3 or 4 Children | 0 (0.0%) | 0 (0.0%) |
| 5 or more Children | 0 (0.0%) | 0 (0.0%) |
| Total | 0 (0.0%) | 0 (0.0%) |
Income Below Poverty Among Married-Couple vs Single-Parent Households in Jackpot
| Children | Married-Couple Families | Single-Parent Households |
| No Children | 0 (0.0%) | 0 (0.0%) |
| 1 or 2 Children | 0 (0.0%) | 0 (0.0%) |
| 3 or 4 Children | 0 (0.0%) | 0 (0.0%) |
| 5 or more Children | 0 (0.0%) | 0 (0.0%) |
| Total | 0 (0.0%) | 0 (0.0%) |
Race in Jackpot
The most populous races in Jackpot are Hispanic or Latino (939 | 77.3%), Some other Race (534 | 44.0%), and Two or more Races (392 | 32.3%).
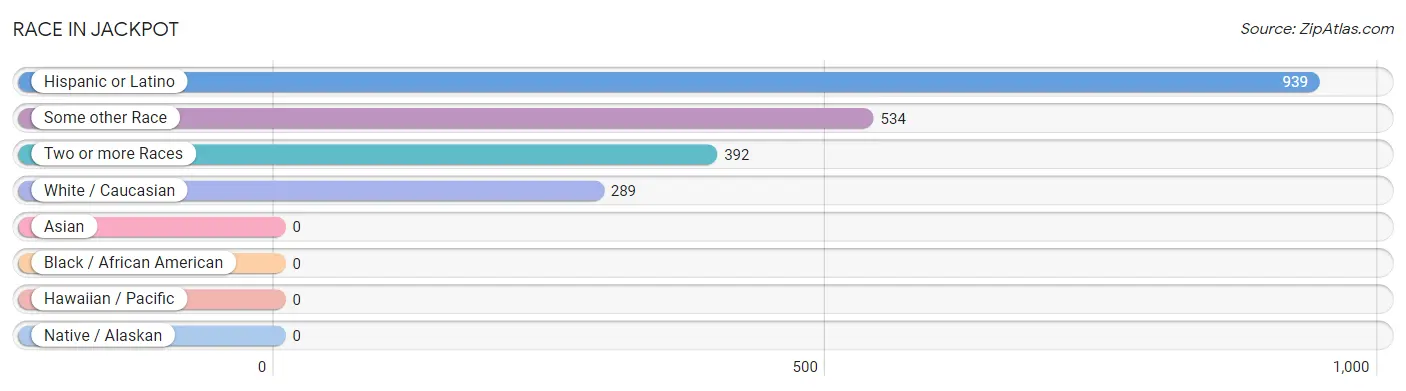
| Race | # Population | % Population |
| Asian | 0 | 0.0% |
| Black / African American | 0 | 0.0% |
| Hawaiian / Pacific | 0 | 0.0% |
| Hispanic or Latino | 939 | 77.3% |
| Native / Alaskan | 0 | 0.0% |
| White / Caucasian | 289 | 23.8% |
| Two or more Races | 392 | 32.3% |
| Some other Race | 534 | 44.0% |
| Total | 1,215 | 100.0% |
Ancestry in Jackpot
The most populous ancestries reported in Jackpot are Mexican (928 | 76.4%), English (145 | 11.9%), German (101 | 8.3%), Indian (Asian) (54 | 4.4%), and Polish (17 | 1.4%), together accounting for 102.5% of all Jackpot residents.
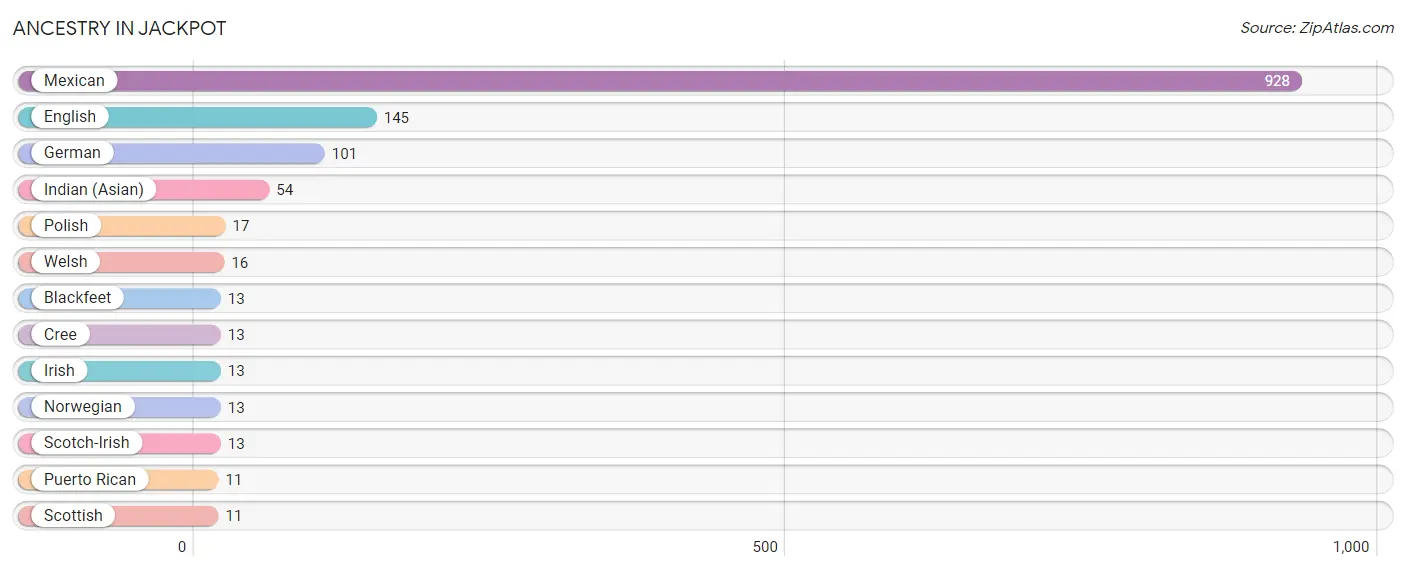
| Ancestry | # Population | % Population |
| Blackfeet | 13 | 1.1% |
| Cree | 13 | 1.1% |
| English | 145 | 11.9% |
| German | 101 | 8.3% |
| Indian (Asian) | 54 | 4.4% |
| Irish | 13 | 1.1% |
| Mexican | 928 | 76.4% |
| Norwegian | 13 | 1.1% |
| Polish | 17 | 1.4% |
| Puerto Rican | 11 | 0.9% |
| Scotch-Irish | 13 | 1.1% |
| Scottish | 11 | 0.9% |
| Welsh | 16 | 1.3% | View All 13 Rows |
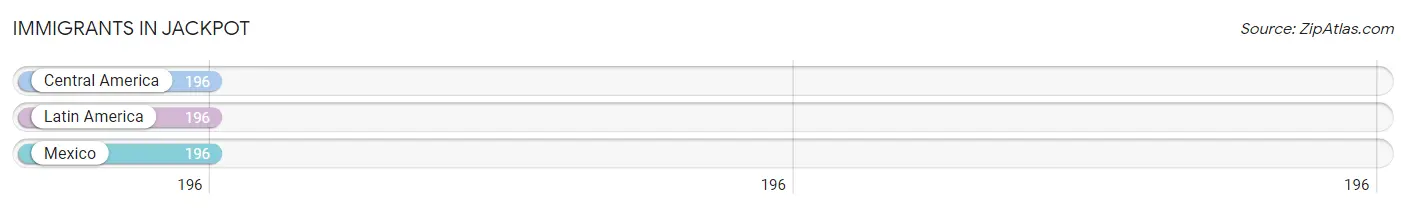
Immigrants in Jackpot
The most numerous immigrant groups reported in Jackpot came from Central America (196 | 16.1%), Latin America (196 | 16.1%), and Mexico (196 | 16.1%), together accounting for 48.4% of all Jackpot residents.
| Immigration Origin | # Population | % Population |
| Central America | 196 | 16.1% |
| Latin America | 196 | 16.1% |
| Mexico | 196 | 16.1% | View All 3 Rows |
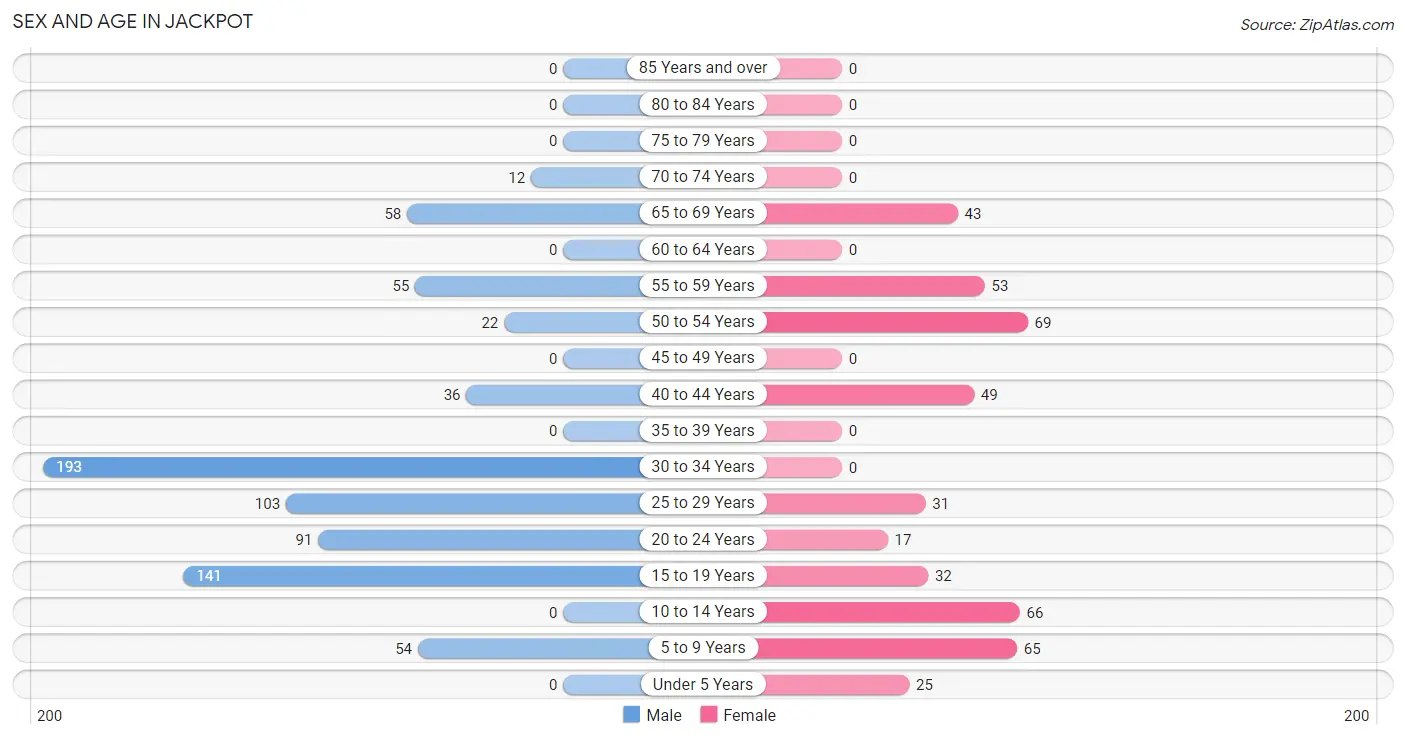
Sex and Age in Jackpot
Sex and Age in Jackpot
The most populous age groups in Jackpot are 30 to 34 Years (193 | 25.2%) for men and 50 to 54 Years (69 | 15.3%) for women.
| Age Bracket | Male | Female |
| Under 5 Years | 0 (0.0%) | 25 (5.6%) |
| 5 to 9 Years | 54 (7.1%) | 65 (14.4%) |
| 10 to 14 Years | 0 (0.0%) | 66 (14.7%) |
| 15 to 19 Years | 141 (18.4%) | 32 (7.1%) |
| 20 to 24 Years | 91 (11.9%) | 17 (3.8%) |
| 25 to 29 Years | 103 (13.5%) | 31 (6.9%) |
| 30 to 34 Years | 193 (25.2%) | 0 (0.0%) |
| 35 to 39 Years | 0 (0.0%) | 0 (0.0%) |
| 40 to 44 Years | 36 (4.7%) | 49 (10.9%) |
| 45 to 49 Years | 0 (0.0%) | 0 (0.0%) |
| 50 to 54 Years | 22 (2.9%) | 69 (15.3%) |
| 55 to 59 Years | 55 (7.2%) | 53 (11.8%) |
| 60 to 64 Years | 0 (0.0%) | 0 (0.0%) |
| 65 to 69 Years | 58 (7.6%) | 43 (9.6%) |
| 70 to 74 Years | 12 (1.6%) | 0 (0.0%) |
| 75 to 79 Years | 0 (0.0%) | 0 (0.0%) |
| 80 to 84 Years | 0 (0.0%) | 0 (0.0%) |
| 85 Years and over | 0 (0.0%) | 0 (0.0%) |
| Total | 765 (100.0%) | 450 (100.0%) |
Families and Households in Jackpot
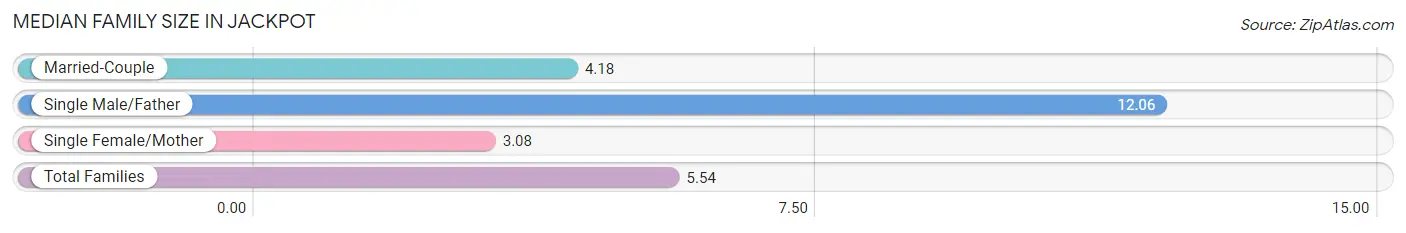
Median Family Size in Jackpot
The median family size in Jackpot is 5.54 persons per family, with single male/father families (34 | 19.3%) accounting for the largest median family size of 12.06 persons per family. On the other hand, single female/mother families (26 | 14.8%) represent the smallest median family size with 3.08 persons per family.
| Family Type | # Families | Family Size |
| Married-Couple | 116 (65.9%) | 4.18 |
| Single Male/Father | 34 (19.3%) | 12.06 |
| Single Female/Mother | 26 (14.8%) | 3.08 |
| Total Families | 176 (100.0%) | 5.54 |
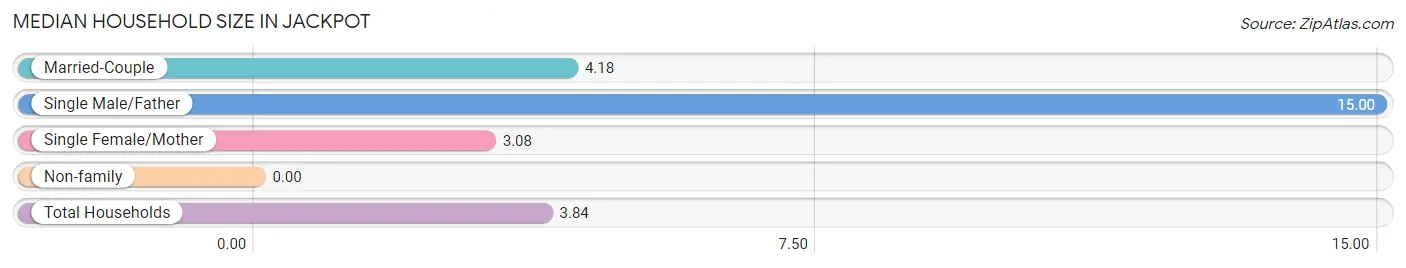
Median Household Size in Jackpot
| Household Type | # Households | Household Size |
| Married-Couple | 116 (36.7%) | 4.18 |
| Single Male/Father | 34 (10.8%) | 15.00 |
| Single Female/Mother | 26 (8.2%) | 3.08 |
| Non-family | 140 (44.3%) | - |
| Total Households | 316 (100.0%) | 3.84 |
Household Size by Marriage Status in Jackpot
Out of a total of 316 households in Jackpot, 176 (55.7%) are family households, while 140 (44.3%) are nonfamily households. The most numerous type of family households are 2-person households, comprising 123, and the most common type of nonfamily households are 1-person households, comprising 140.
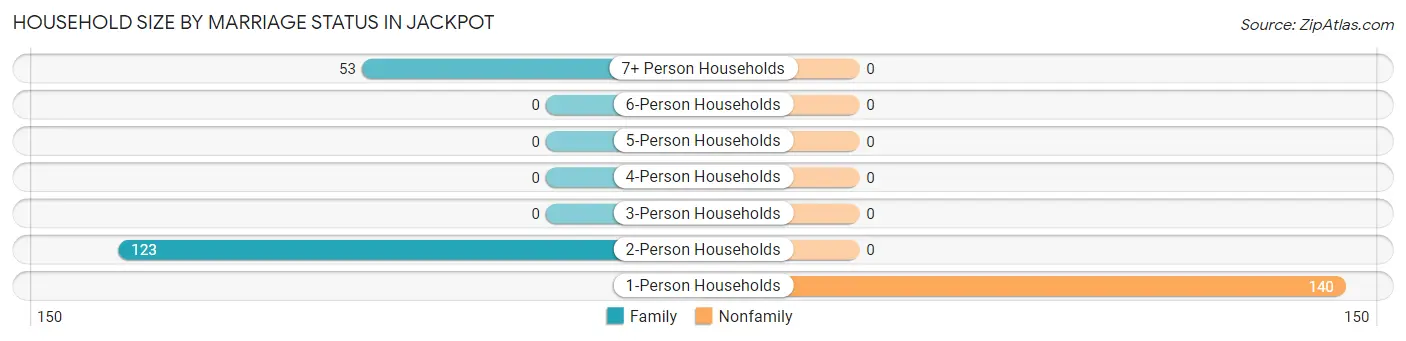
| Household Size | Family Households | Nonfamily Households |
| 1-Person Households | - | 140 (44.3%) |
| 2-Person Households | 123 (38.9%) | 0 (0.0%) |
| 3-Person Households | 0 (0.0%) | 0 (0.0%) |
| 4-Person Households | 0 (0.0%) | 0 (0.0%) |
| 5-Person Households | 0 (0.0%) | 0 (0.0%) |
| 6-Person Households | 0 (0.0%) | 0 (0.0%) |
| 7+ Person Households | 53 (16.8%) | 0 (0.0%) |
| Total | 176 (55.7%) | 140 (44.3%) |
Female Fertility in Jackpot
Fertility by Age in Jackpot
| Age Bracket | Women with Births | Births / 1,000 Women |
| 15 to 19 years | 0 (0.0%) | 0.0 |
| 20 to 34 years | 0 (0.0%) | 0.0 |
| 35 to 50 years | 0 (0.0%) | 0.0 |
| Total | 0 (0.0%) | 0.0 |
Fertility by Age by Marriage Status in Jackpot
| Age Bracket | Married | Unmarried |
| 15 to 19 years | 0 (0.0%) | 0 (0.0%) |
| 20 to 34 years | 0 (0.0%) | 0 (0.0%) |
| 35 to 50 years | 0 (0.0%) | 0 (0.0%) |
| Total | 0 (0.0%) | 0 (0.0%) |
Fertility by Education in Jackpot
| Educational Attainment | Women with Births | Births / 1,000 Women |
| Less than High School | 0 (0.0%) | 0.0 |
| High School Diploma | 0 (0.0%) | 0.0 |
| College or Associate's Degree | 0 (0.0%) | 0.0 |
| Bachelor's Degree | 0 (0.0%) | 0.0 |
| Graduate Degree | 0 (0.0%) | 0.0 |
| Total | 0 (0.0%) | 0.0 |
Fertility by Education by Marriage Status in Jackpot
| Educational Attainment | Married | Unmarried |
| Less than High School | 0 (0.0%) | 0 (0.0%) |
| High School Diploma | 0 (0.0%) | 0 (0.0%) |
| College or Associate's Degree | 0 (0.0%) | 0 (0.0%) |
| Bachelor's Degree | 0 (0.0%) | 0 (0.0%) |
| Graduate Degree | 0 (0.0%) | 0 (0.0%) |
| Total | 0 (0.0%) | 0 (0.0%) |
Employment Characteristics in Jackpot
Employment by Class of Employer in Jackpot
Among the 705 employed individuals in Jackpot, private company employees (594 | 84.3%), self-employed (not incorporated) (52 | 7.4%), and local government employees (46 | 6.5%) make up the most common classes of employment.
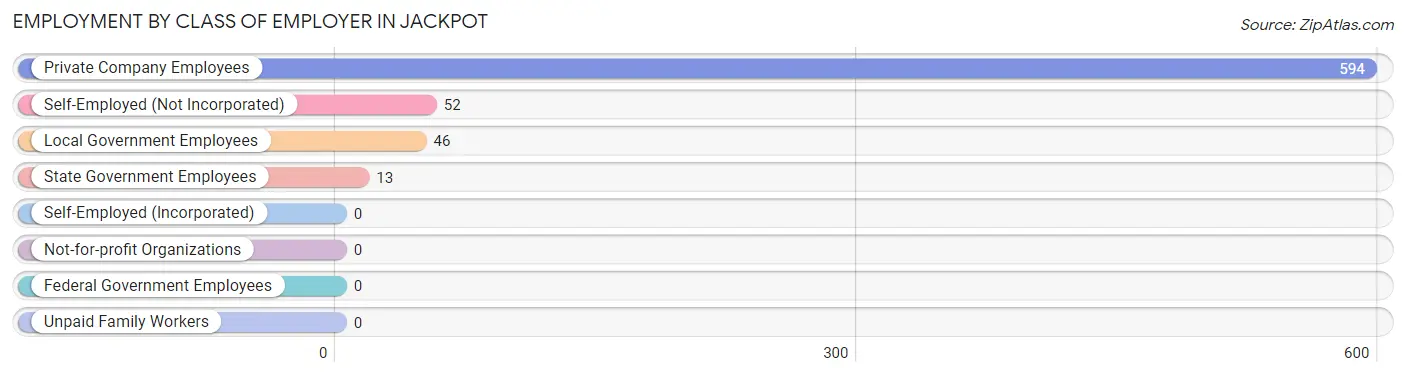
| Employer Class | # Employees | % Employees |
| Private Company Employees | 594 | 84.3% |
| Self-Employed (Incorporated) | 0 | 0.0% |
| Self-Employed (Not Incorporated) | 52 | 7.4% |
| Not-for-profit Organizations | 0 | 0.0% |
| Local Government Employees | 46 | 6.5% |
| State Government Employees | 13 | 1.8% |
| Federal Government Employees | 0 | 0.0% |
| Unpaid Family Workers | 0 | 0.0% |
| Total | 705 | 100.0% |
Employment Status by Age in Jackpot
According to the labor force statistics for Jackpot, out of the total population over 16 years of age (973), 89.0% or 866 individuals are in the labor force, with 14.4% or 125 of them unemployed. The age group with the highest labor force participation rate is 20 to 24 years, with 100.0% or 108 individuals in the labor force. Within the labor force, the 16 to 19 years age range has the highest percentage of unemployed individuals, with 50.0% or 52 of them being unemployed.
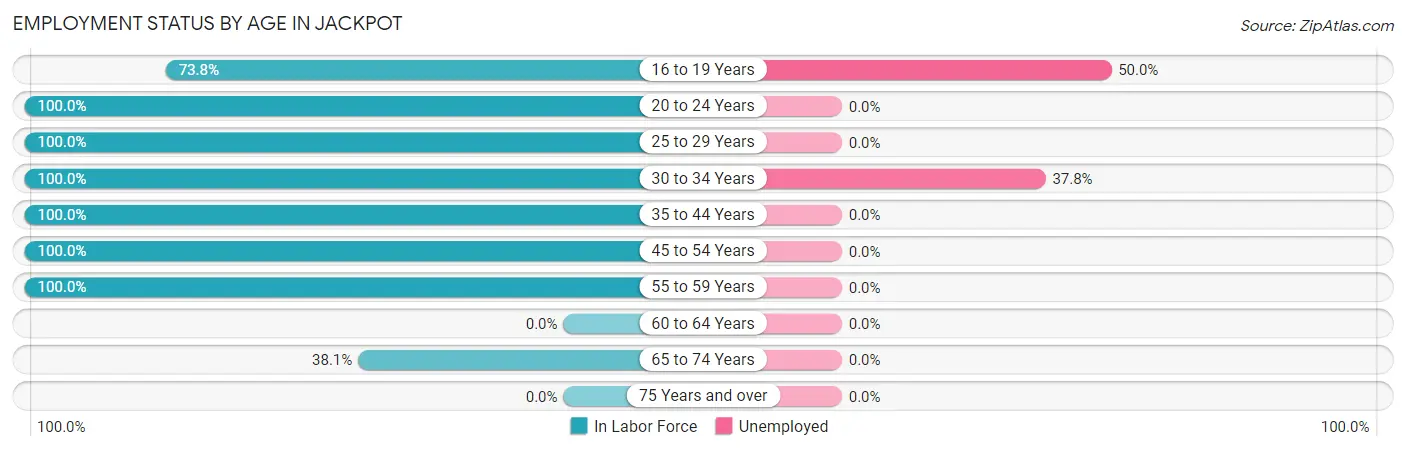
| Age Bracket | In Labor Force | Unemployed |
| 16 to 19 Years | 104 (73.8%) | 52 (50.0%) |
| 20 to 24 Years | 108 (100.0%) | 0 (0.0%) |
| 25 to 29 Years | 134 (100.0%) | 0 (0.0%) |
| 30 to 34 Years | 193 (100.0%) | 73 (37.8%) |
| 35 to 44 Years | 85 (100.0%) | 0 (0.0%) |
| 45 to 54 Years | 91 (100.0%) | 0 (0.0%) |
| 55 to 59 Years | 108 (100.0%) | 0 (0.0%) |
| 60 to 64 Years | 0 (0.0%) | 0 (0.0%) |
| 65 to 74 Years | 43 (38.1%) | 0 (0.0%) |
| 75 Years and over | 0 (0.0%) | 0 (0.0%) |
| Total | 866 (89.0%) | 125 (14.4%) |
Employment Status by Educational Attainment in Jackpot
According to labor force statistics for Jackpot, 100.0% of individuals (611) out of the total population between 25 and 64 years of age (611) are in the labor force, with 11.9% or 73 of them being unemployed. The group with the highest labor force participation rate are those with the educational attainment of less than high school, with 100.0% or 90 individuals in the labor force. Within the labor force, individuals with high school diploma education have the highest percentage of unemployment, with 27.7% or 73 of them being unemployed.
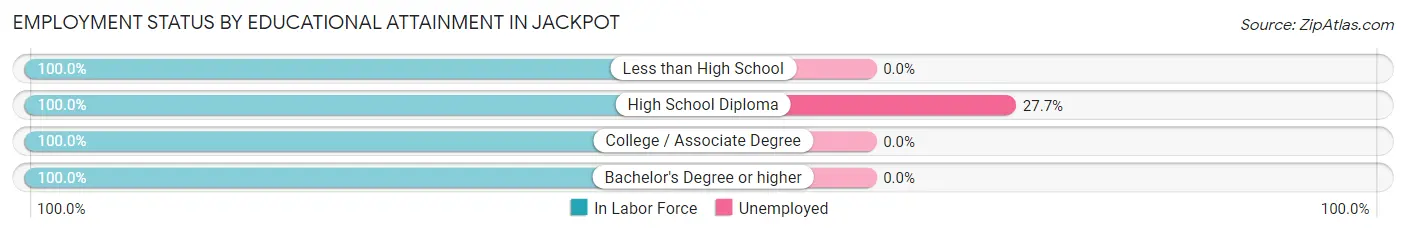
| Educational Attainment | In Labor Force | Unemployed |
| Less than High School | 90 (100.0%) | 0 (0.0%) |
| High School Diploma | 264 (100.0%) | 73 (27.7%) |
| College / Associate Degree | 90 (100.0%) | 0 (0.0%) |
| Bachelor's Degree or higher | 167 (100.0%) | 0 (0.0%) |
| Total | 611 (100.0%) | 73 (11.9%) |
Employment Occupations by Sex in Jackpot
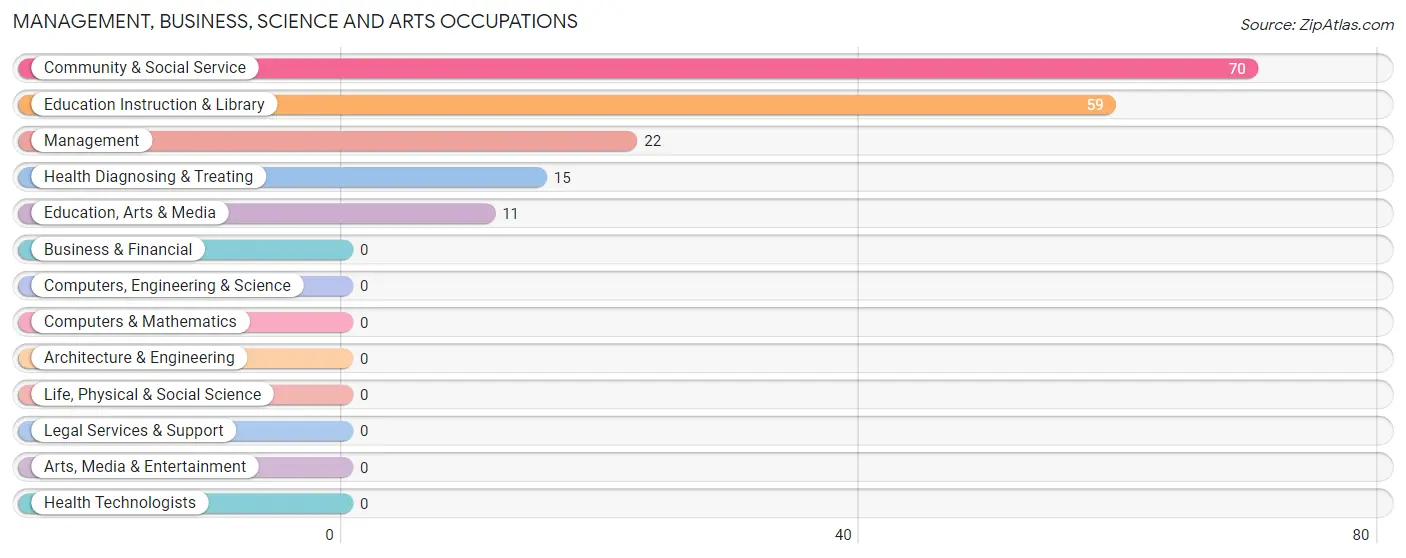
Management, Business, Science and Arts Occupations
The most common Management, Business, Science and Arts occupations in Jackpot are Community & Social Service (70 | 9.5%), Education Instruction & Library (59 | 8.0%), Management (22 | 3.0%), Health Diagnosing & Treating (15 | 2.0%), and Education, Arts & Media (11 | 1.5%).
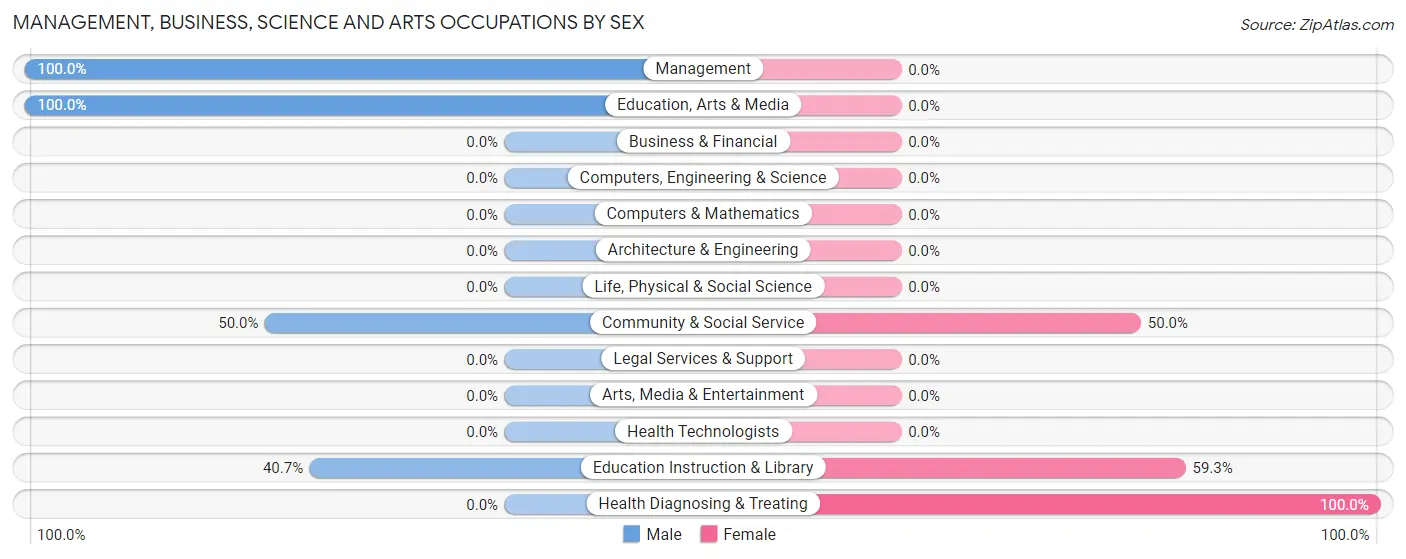
Management, Business, Science and Arts Occupations by Sex
Within the Management, Business, Science and Arts occupations in Jackpot, the most male-oriented occupations are Management (100.0%), Education, Arts & Media (100.0%), and Community & Social Service (50.0%), while the most female-oriented occupations are Health Diagnosing & Treating (100.0%), Education Instruction & Library (59.3%), and Community & Social Service (50.0%).
| Occupation | Male | Female |
| Management | 22 (100.0%) | 0 (0.0%) |
| Business & Financial | 0 (0.0%) | 0 (0.0%) |
| Computers, Engineering & Science | 0 (0.0%) | 0 (0.0%) |
| Computers & Mathematics | 0 (0.0%) | 0 (0.0%) |
| Architecture & Engineering | 0 (0.0%) | 0 (0.0%) |
| Life, Physical & Social Science | 0 (0.0%) | 0 (0.0%) |
| Community & Social Service | 35 (50.0%) | 35 (50.0%) |
| Education, Arts & Media | 11 (100.0%) | 0 (0.0%) |
| Legal Services & Support | 0 (0.0%) | 0 (0.0%) |
| Education Instruction & Library | 24 (40.7%) | 35 (59.3%) |
| Arts, Media & Entertainment | 0 (0.0%) | 0 (0.0%) |
| Health Diagnosing & Treating | 0 (0.0%) | 15 (100.0%) |
| Health Technologists | 0 (0.0%) | 0 (0.0%) |
| Total (Category) | 57 (53.3%) | 50 (46.7%) |
| Total (Overall) | 479 (64.6%) | 262 (35.4%) |
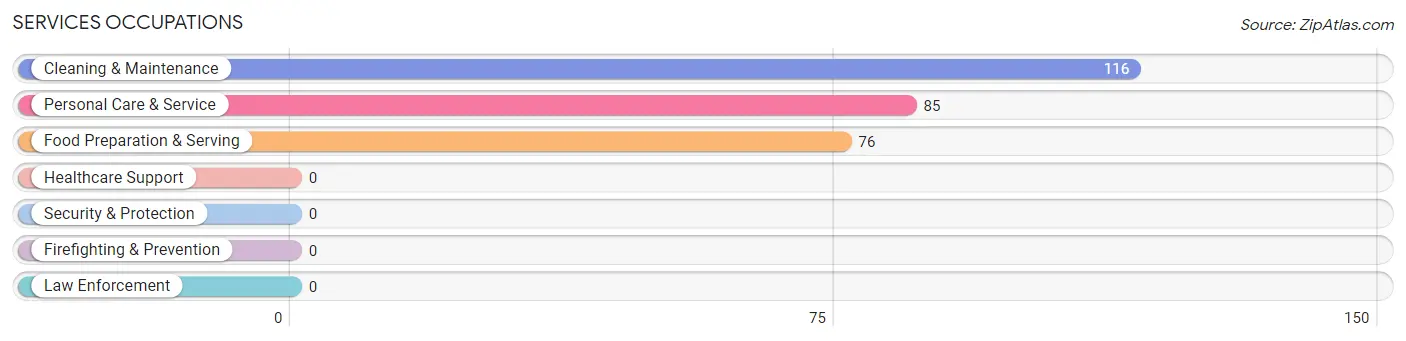
Services Occupations
The most common Services occupations in Jackpot are Cleaning & Maintenance (116 | 15.7%), Personal Care & Service (85 | 11.5%), and Food Preparation & Serving (76 | 10.3%).
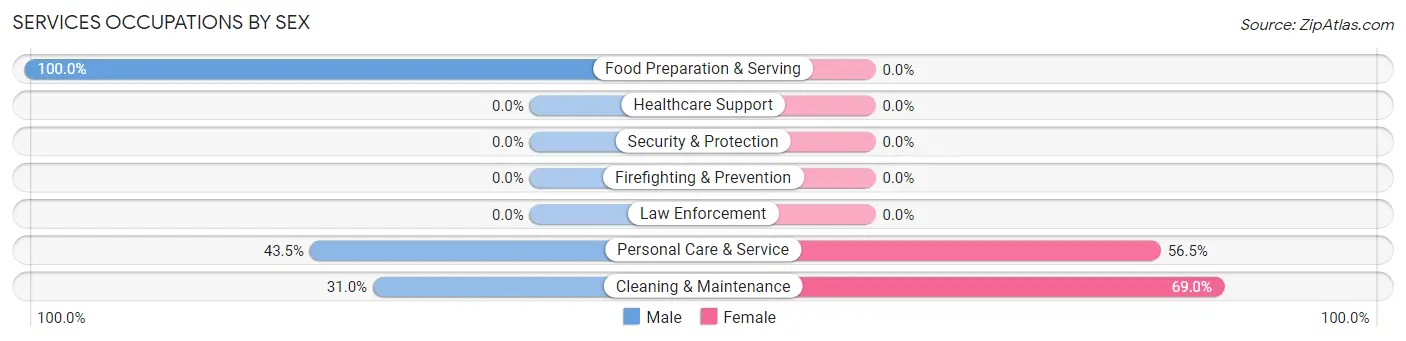
Services Occupations by Sex
Within the Services occupations in Jackpot, the most male-oriented occupations are Food Preparation & Serving (100.0%), Personal Care & Service (43.5%), and Cleaning & Maintenance (31.0%), while the most female-oriented occupations are Cleaning & Maintenance (69.0%), and Personal Care & Service (56.5%).
| Occupation | Male | Female |
| Healthcare Support | 0 (0.0%) | 0 (0.0%) |
| Security & Protection | 0 (0.0%) | 0 (0.0%) |
| Firefighting & Prevention | 0 (0.0%) | 0 (0.0%) |
| Law Enforcement | 0 (0.0%) | 0 (0.0%) |
| Food Preparation & Serving | 76 (100.0%) | 0 (0.0%) |
| Cleaning & Maintenance | 36 (31.0%) | 80 (69.0%) |
| Personal Care & Service | 37 (43.5%) | 48 (56.5%) |
| Total (Category) | 149 (53.8%) | 128 (46.2%) |
| Total (Overall) | 479 (64.6%) | 262 (35.4%) |
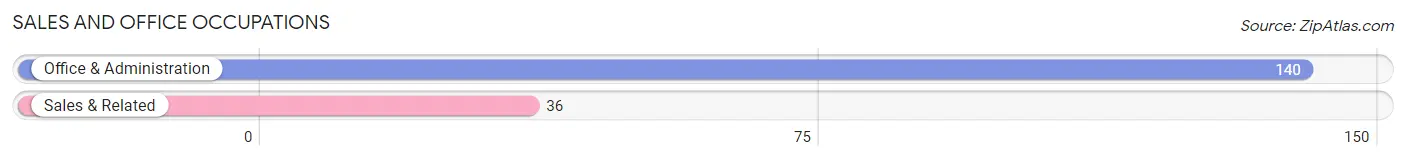
Sales and Office Occupations
The most common Sales and Office occupations in Jackpot are Office & Administration (140 | 18.9%), and Sales & Related (36 | 4.9%).
Sales and Office Occupations by Sex
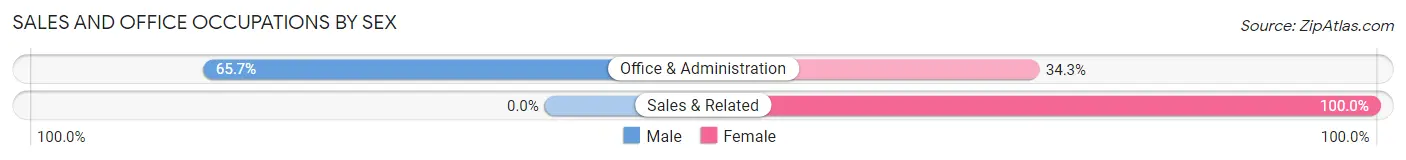
| Occupation | Male | Female |
| Sales & Related | 0 (0.0%) | 36 (100.0%) |
| Office & Administration | 92 (65.7%) | 48 (34.3%) |
| Total (Category) | 92 (52.3%) | 84 (47.7%) |
| Total (Overall) | 479 (64.6%) | 262 (35.4%) |
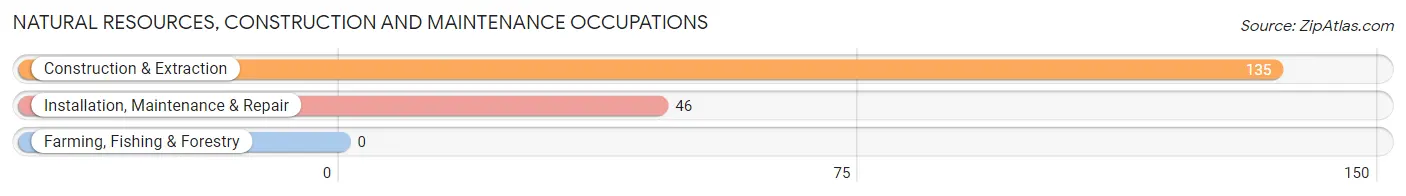
Natural Resources, Construction and Maintenance Occupations
The most common Natural Resources, Construction and Maintenance occupations in Jackpot are Construction & Extraction (135 | 18.2%), and Installation, Maintenance & Repair (46 | 6.2%).
Natural Resources, Construction and Maintenance Occupations by Sex
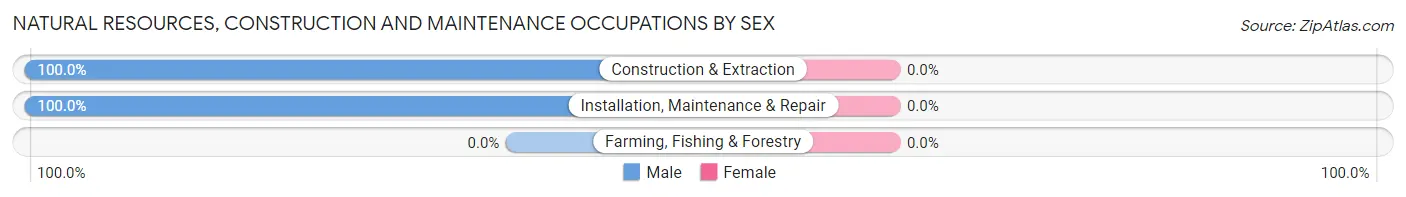
| Occupation | Male | Female |
| Farming, Fishing & Forestry | 0 (0.0%) | 0 (0.0%) |
| Construction & Extraction | 135 (100.0%) | 0 (0.0%) |
| Installation, Maintenance & Repair | 46 (100.0%) | 0 (0.0%) |
| Total (Category) | 181 (100.0%) | 0 (0.0%) |
| Total (Overall) | 479 (64.6%) | 262 (35.4%) |
Production, Transportation and Moving Occupations
Production, Transportation and Moving Occupations by Sex
| Occupation | Male | Female |
| Production | 0 (0.0%) | 0 (0.0%) |
| Transportation | 0 (0.0%) | 0 (0.0%) |
| Material Moving | 0 (0.0%) | 0 (0.0%) |
| Total (Category) | 0 (0.0%) | 0 (0.0%) |
| Total (Overall) | 479 (64.6%) | 262 (35.4%) |
Employment Industries by Sex in Jackpot
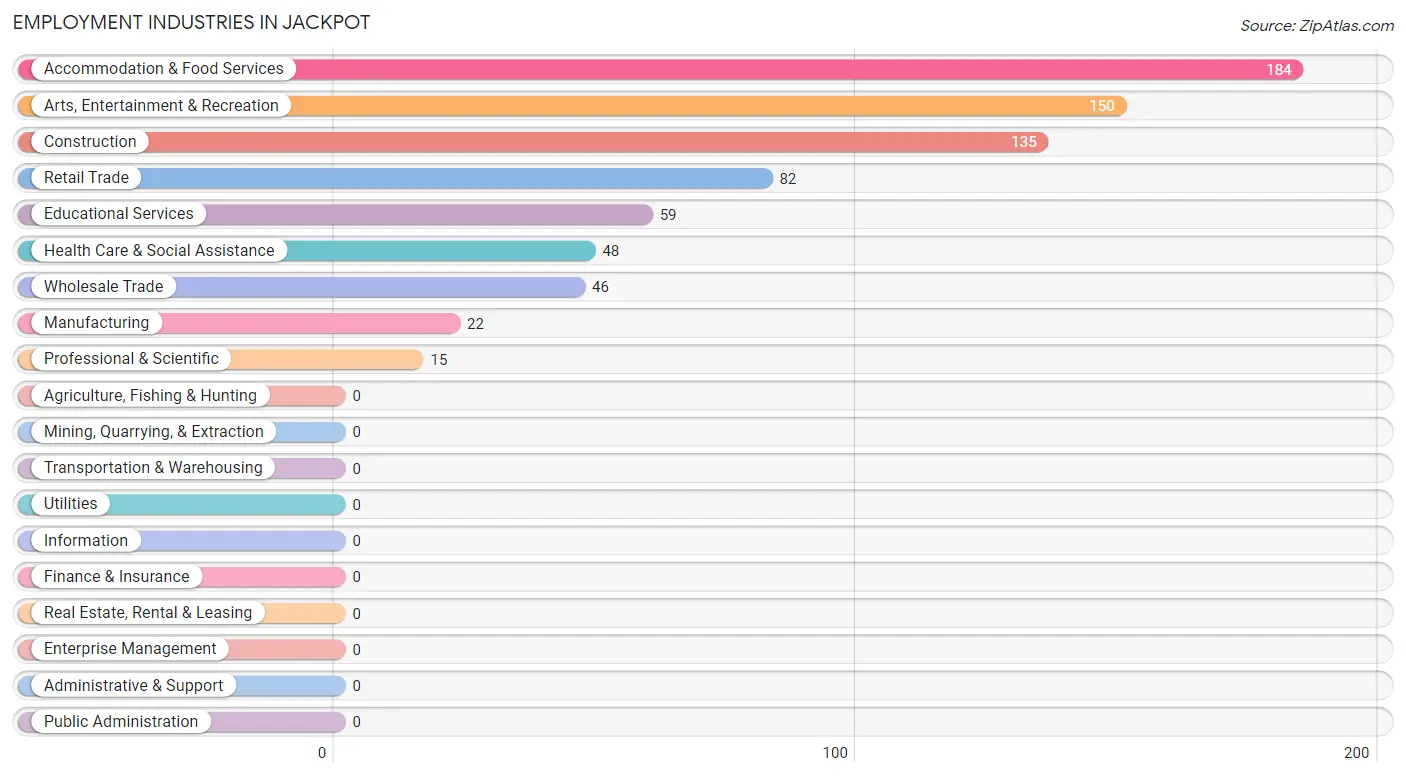
Employment Industries in Jackpot
The major employment industries in Jackpot include Accommodation & Food Services (184 | 24.8%), Arts, Entertainment & Recreation (150 | 20.2%), Construction (135 | 18.2%), Retail Trade (82 | 11.1%), and Educational Services (59 | 8.0%).
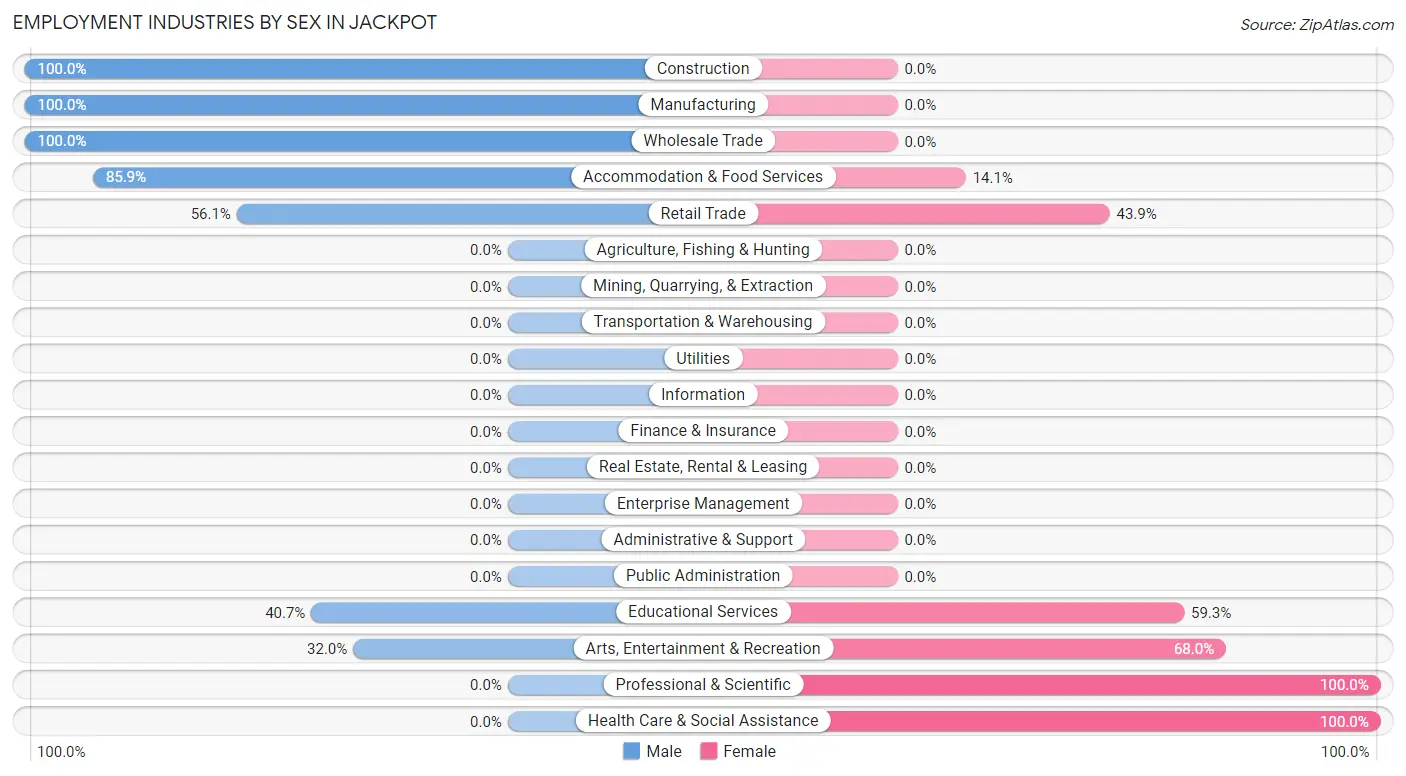
Employment Industries by Sex in Jackpot
The Jackpot industries that see more men than women are Construction (100.0%), Manufacturing (100.0%), and Wholesale Trade (100.0%), whereas the industries that tend to have a higher number of women are Professional & Scientific (100.0%), Health Care & Social Assistance (100.0%), and Arts, Entertainment & Recreation (68.0%).
| Industry | Male | Female |
| Agriculture, Fishing & Hunting | 0 (0.0%) | 0 (0.0%) |
| Mining, Quarrying, & Extraction | 0 (0.0%) | 0 (0.0%) |
| Construction | 135 (100.0%) | 0 (0.0%) |
| Manufacturing | 22 (100.0%) | 0 (0.0%) |
| Wholesale Trade | 46 (100.0%) | 0 (0.0%) |
| Retail Trade | 46 (56.1%) | 36 (43.9%) |
| Transportation & Warehousing | 0 (0.0%) | 0 (0.0%) |
| Utilities | 0 (0.0%) | 0 (0.0%) |
| Information | 0 (0.0%) | 0 (0.0%) |
| Finance & Insurance | 0 (0.0%) | 0 (0.0%) |
| Real Estate, Rental & Leasing | 0 (0.0%) | 0 (0.0%) |
| Professional & Scientific | 0 (0.0%) | 15 (100.0%) |
| Enterprise Management | 0 (0.0%) | 0 (0.0%) |
| Administrative & Support | 0 (0.0%) | 0 (0.0%) |
| Educational Services | 24 (40.7%) | 35 (59.3%) |
| Health Care & Social Assistance | 0 (0.0%) | 48 (100.0%) |
| Arts, Entertainment & Recreation | 48 (32.0%) | 102 (68.0%) |
| Accommodation & Food Services | 158 (85.9%) | 26 (14.1%) |
| Public Administration | 0 (0.0%) | 0 (0.0%) |
| Total | 479 (64.6%) | 262 (35.4%) |
Education in Jackpot
School Enrollment in Jackpot
The most common levels of schooling among the 400 students in Jackpot are elementary school (150 | 37.5%), high school (121 | 30.2%), and college / undergraduate (53 | 13.3%).
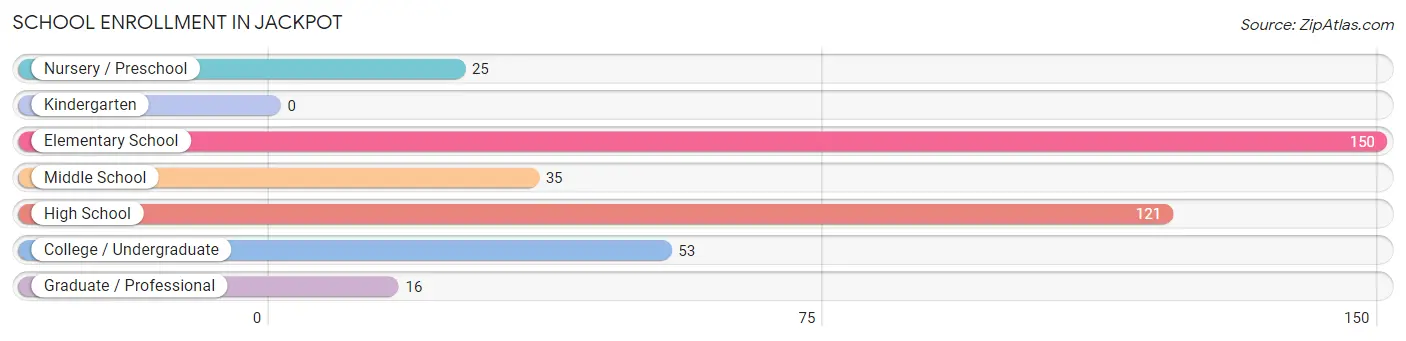
| School Level | # Students | % Students |
| Nursery / Preschool | 25 | 6.2% |
| Kindergarten | 0 | 0.0% |
| Elementary School | 150 | 37.5% |
| Middle School | 35 | 8.7% |
| High School | 121 | 30.2% |
| College / Undergraduate | 53 | 13.3% |
| Graduate / Professional | 16 | 4.0% |
| Total | 400 | 100.0% |
School Enrollment by Age by Funding Source in Jackpot
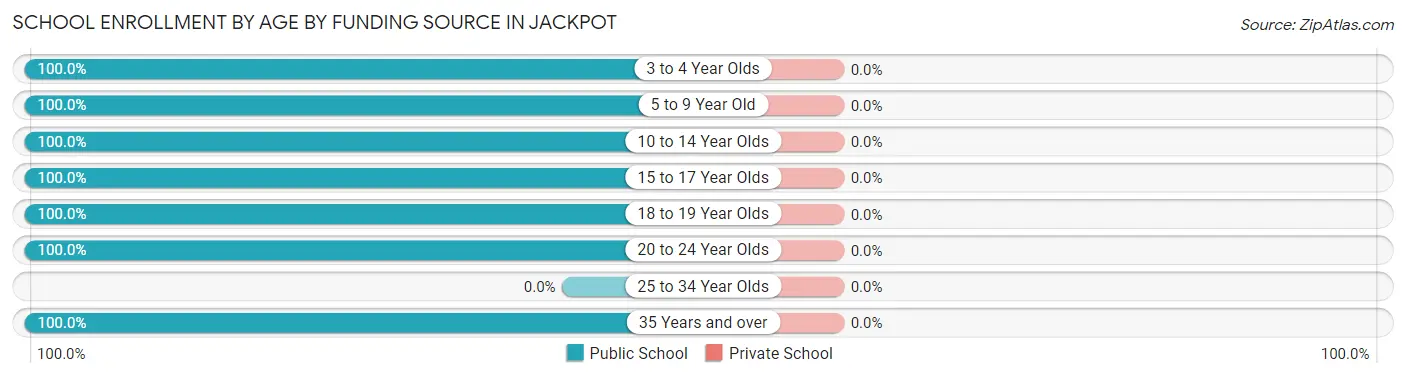
| Age Bracket | Public School | Private School |
| 3 to 4 Year Olds | 25 (100.0%) | 0 (0.0%) |
| 5 to 9 Year Old | 119 (100.0%) | 0 (0.0%) |
| 10 to 14 Year Olds | 66 (100.0%) | 0 (0.0%) |
| 15 to 17 Year Olds | 69 (100.0%) | 0 (0.0%) |
| 18 to 19 Year Olds | 52 (100.0%) | 0 (0.0%) |
| 20 to 24 Year Olds | 17 (100.0%) | 0 (0.0%) |
| 25 to 34 Year Olds | 0 (0.0%) | 0 (0.0%) |
| 35 Years and over | 52 (100.0%) | 0 (0.0%) |
| Total | 400 (100.0%) | 0 (0.0%) |
Educational Attainment by Field of Study in Jackpot
Business (65 | 31.2%), engineering (36 | 17.3%), psychology (31 | 14.9%), visual & performing arts (29 | 13.9%), and education (19 | 9.1%) are the most common fields of study among 208 individuals in Jackpot who have obtained a bachelor's degree or higher.
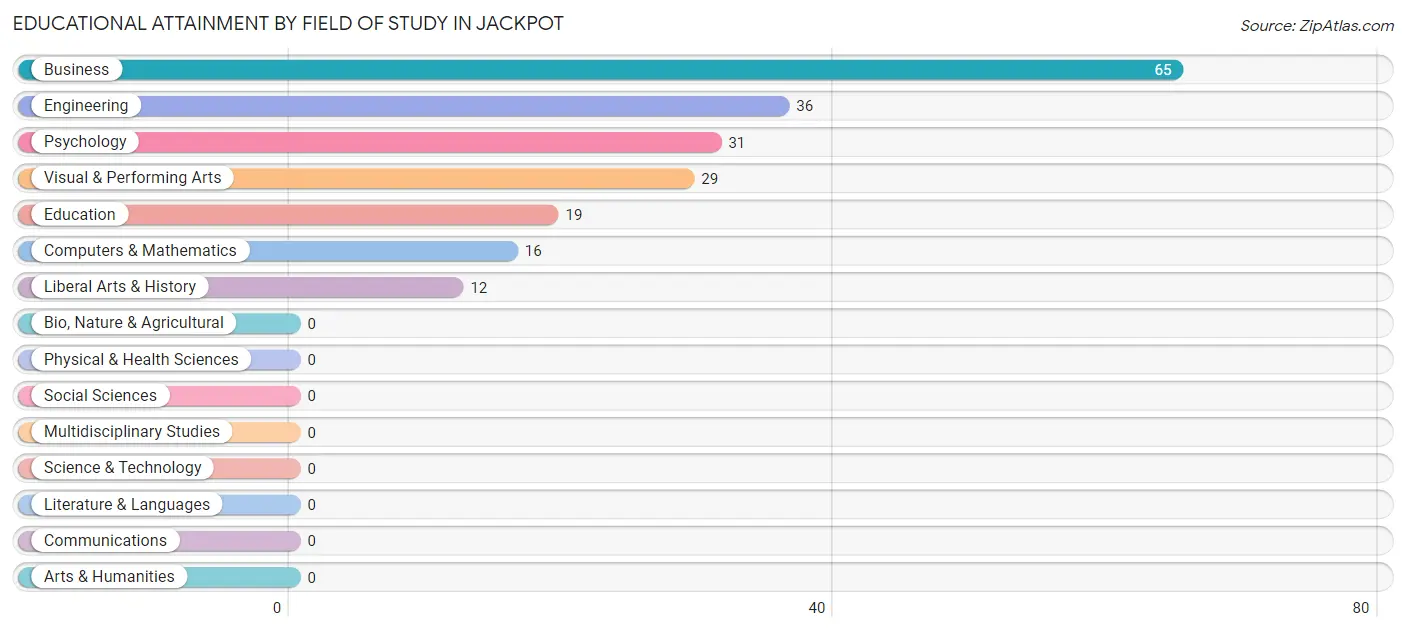
| Field of Study | # Graduates | % Graduates |
| Computers & Mathematics | 16 | 7.7% |
| Bio, Nature & Agricultural | 0 | 0.0% |
| Physical & Health Sciences | 0 | 0.0% |
| Psychology | 31 | 14.9% |
| Social Sciences | 0 | 0.0% |
| Engineering | 36 | 17.3% |
| Multidisciplinary Studies | 0 | 0.0% |
| Science & Technology | 0 | 0.0% |
| Business | 65 | 31.2% |
| Education | 19 | 9.1% |
| Literature & Languages | 0 | 0.0% |
| Liberal Arts & History | 12 | 5.8% |
| Visual & Performing Arts | 29 | 13.9% |
| Communications | 0 | 0.0% |
| Arts & Humanities | 0 | 0.0% |
| Total | 208 | 100.0% |
Transportation & Commute in Jackpot
Vehicle Availability by Sex in Jackpot
The most prevalent vehicle ownership categories in Jackpot are males with 3 vehicles (378, accounting for 85.3%) and females with 3 vehicles (80, making up 144.3%).
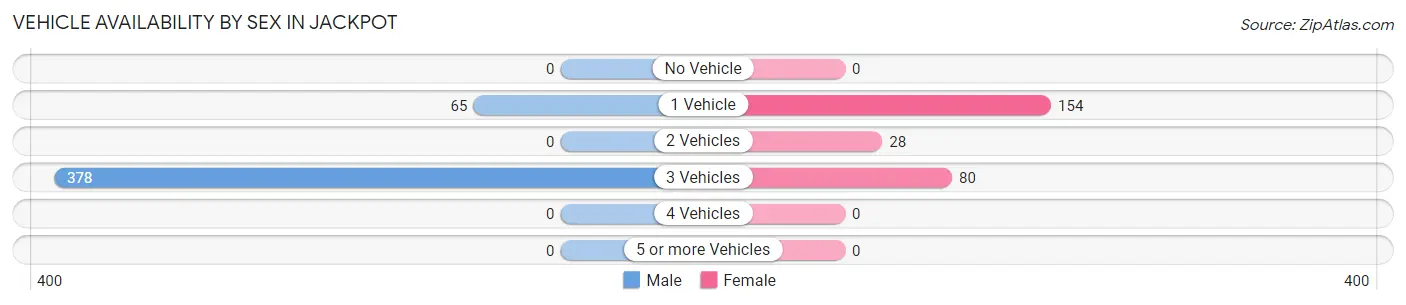
| Vehicles Available | Male | Female |
| No Vehicle | 0 (0.0%) | 0 (0.0%) |
| 1 Vehicle | 65 (14.7%) | 154 (58.8%) |
| 2 Vehicles | 0 (0.0%) | 28 (10.7%) |
| 3 Vehicles | 378 (85.3%) | 80 (30.5%) |
| 4 Vehicles | 0 (0.0%) | 0 (0.0%) |
| 5 or more Vehicles | 0 (0.0%) | 0 (0.0%) |
| Total | 443 (100.0%) | 262 (100.0%) |
Commute Time in Jackpot
The most frequently occuring commute durations in Jackpot are 5 to 9 minutes (248 commuters, 43.2%), less than 5 minutes (244 commuters, 42.5%), and 10 to 14 minutes (49 commuters, 8.5%).
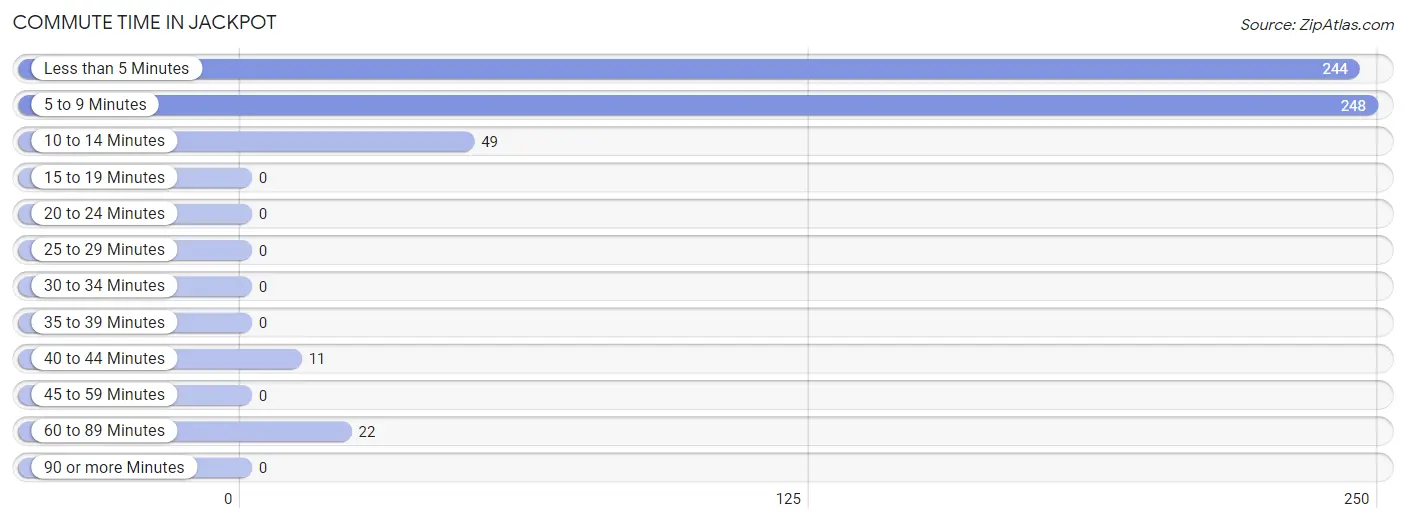
| Commute Time | # Commuters | % Commuters |
| Less than 5 Minutes | 244 | 42.5% |
| 5 to 9 Minutes | 248 | 43.2% |
| 10 to 14 Minutes | 49 | 8.5% |
| 15 to 19 Minutes | 0 | 0.0% |
| 20 to 24 Minutes | 0 | 0.0% |
| 25 to 29 Minutes | 0 | 0.0% |
| 30 to 34 Minutes | 0 | 0.0% |
| 35 to 39 Minutes | 0 | 0.0% |
| 40 to 44 Minutes | 11 | 1.9% |
| 45 to 59 Minutes | 0 | 0.0% |
| 60 to 89 Minutes | 22 | 3.8% |
| 90 or more Minutes | 0 | 0.0% |
Commute Time by Sex in Jackpot
The most common commute times in Jackpot are 5 to 9 minutes (190 commuters, 52.8%) for males and less than 5 minutes (107 commuters, 50.0%) for females.
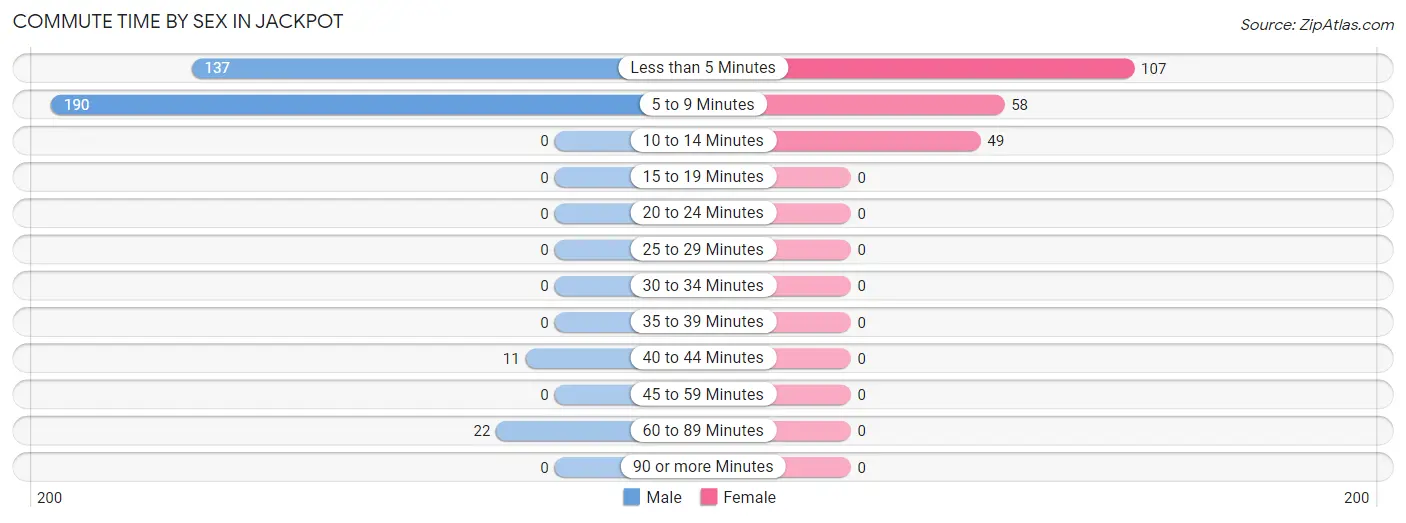
| Commute Time | Male | Female |
| Less than 5 Minutes | 137 (38.1%) | 107 (50.0%) |
| 5 to 9 Minutes | 190 (52.8%) | 58 (27.1%) |
| 10 to 14 Minutes | 0 (0.0%) | 49 (22.9%) |
| 15 to 19 Minutes | 0 (0.0%) | 0 (0.0%) |
| 20 to 24 Minutes | 0 (0.0%) | 0 (0.0%) |
| 25 to 29 Minutes | 0 (0.0%) | 0 (0.0%) |
| 30 to 34 Minutes | 0 (0.0%) | 0 (0.0%) |
| 35 to 39 Minutes | 0 (0.0%) | 0 (0.0%) |
| 40 to 44 Minutes | 11 (3.1%) | 0 (0.0%) |
| 45 to 59 Minutes | 0 (0.0%) | 0 (0.0%) |
| 60 to 89 Minutes | 22 (6.1%) | 0 (0.0%) |
| 90 or more Minutes | 0 (0.0%) | 0 (0.0%) |
Time of Departure to Work by Sex in Jackpot
The most frequent times of departure to work in Jackpot are 12:00 PM to 3:59 PM (91, 25.3%) for males and 7:30 AM to 7:59 AM (52, 24.3%) for females.
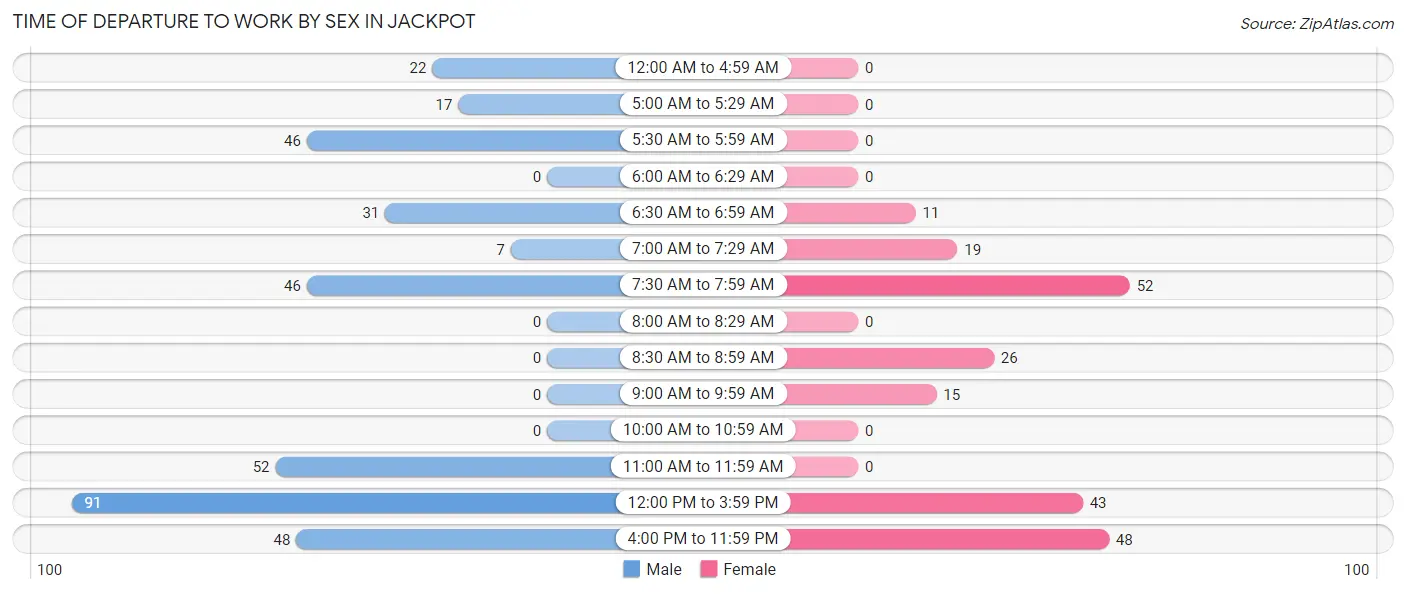
| Time of Departure | Male | Female |
| 12:00 AM to 4:59 AM | 22 (6.1%) | 0 (0.0%) |
| 5:00 AM to 5:29 AM | 17 (4.7%) | 0 (0.0%) |
| 5:30 AM to 5:59 AM | 46 (12.8%) | 0 (0.0%) |
| 6:00 AM to 6:29 AM | 0 (0.0%) | 0 (0.0%) |
| 6:30 AM to 6:59 AM | 31 (8.6%) | 11 (5.1%) |
| 7:00 AM to 7:29 AM | 7 (1.9%) | 19 (8.9%) |
| 7:30 AM to 7:59 AM | 46 (12.8%) | 52 (24.3%) |
| 8:00 AM to 8:29 AM | 0 (0.0%) | 0 (0.0%) |
| 8:30 AM to 8:59 AM | 0 (0.0%) | 26 (12.1%) |
| 9:00 AM to 9:59 AM | 0 (0.0%) | 15 (7.0%) |
| 10:00 AM to 10:59 AM | 0 (0.0%) | 0 (0.0%) |
| 11:00 AM to 11:59 AM | 52 (14.4%) | 0 (0.0%) |
| 12:00 PM to 3:59 PM | 91 (25.3%) | 43 (20.1%) |
| 4:00 PM to 11:59 PM | 48 (13.3%) | 48 (22.4%) |
| Total | 360 (100.0%) | 214 (100.0%) |
Housing Occupancy in Jackpot
Occupancy by Ownership in Jackpot
Of the total 316 dwellings in Jackpot, owner-occupied units account for 138 (43.7%), while renter-occupied units make up 178 (56.3%).
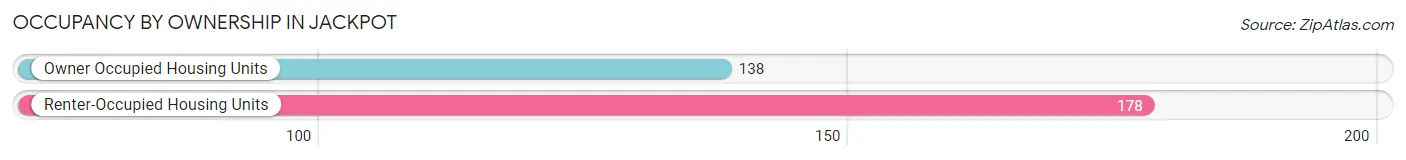
| Occupancy | # Housing Units | % Housing Units |
| Owner Occupied Housing Units | 138 | 43.7% |
| Renter-Occupied Housing Units | 178 | 56.3% |
| Total Occupied Housing Units | 316 | 100.0% |
Occupancy by Household Size in Jackpot
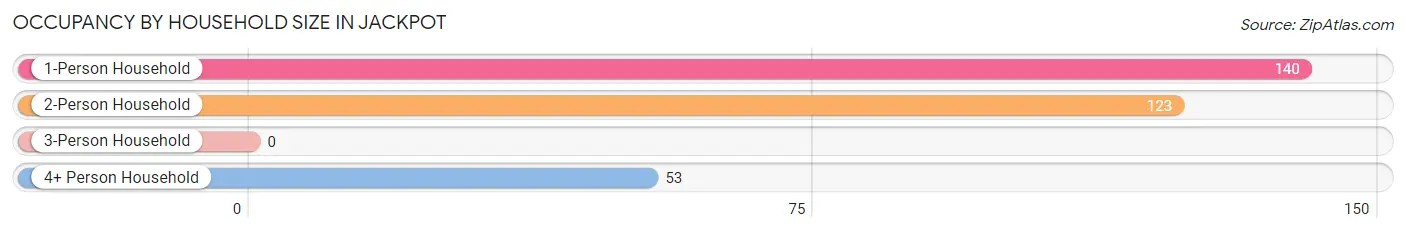
| Household Size | # Housing Units | % Housing Units |
| 1-Person Household | 140 | 44.3% |
| 2-Person Household | 123 | 38.9% |
| 3-Person Household | 0 | 0.0% |
| 4+ Person Household | 53 | 16.8% |
| Total Housing Units | 316 | 100.0% |
Occupancy by Ownership by Household Size in Jackpot
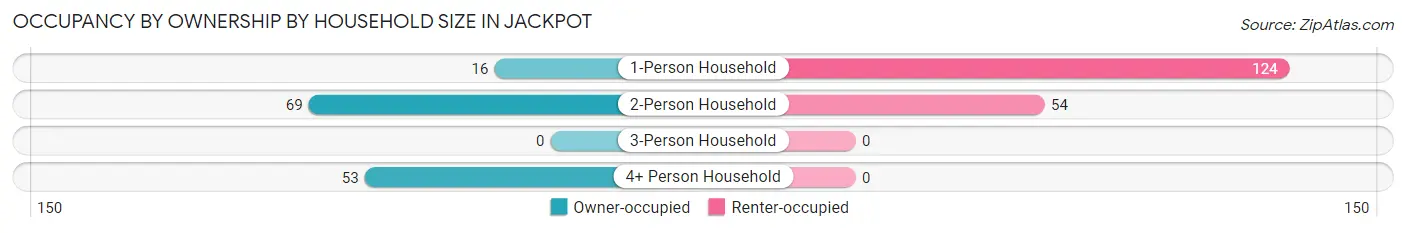
| Household Size | Owner-occupied | Renter-occupied |
| 1-Person Household | 16 (11.4%) | 124 (88.6%) |
| 2-Person Household | 69 (56.1%) | 54 (43.9%) |
| 3-Person Household | 0 (0.0%) | 0 (0.0%) |
| 4+ Person Household | 53 (100.0%) | 0 (0.0%) |
| Total Housing Units | 138 (43.7%) | 178 (56.3%) |
Occupancy by Educational Attainment in Jackpot
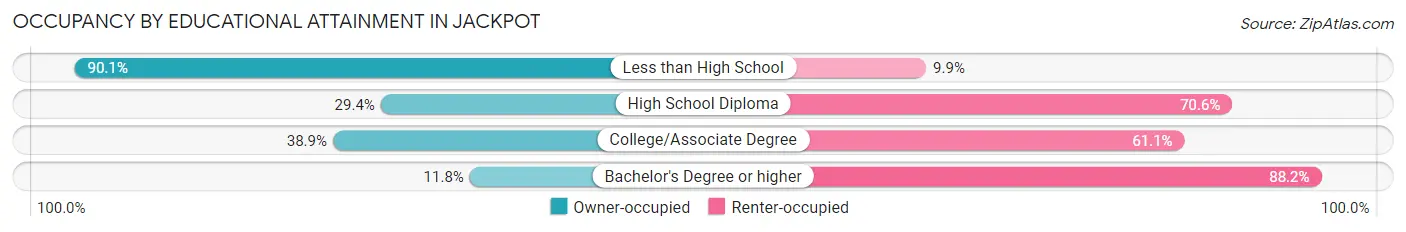
| Household Size | Owner-occupied | Renter-occupied |
| Less than High School | 100 (90.1%) | 11 (9.9%) |
| High School Diploma | 15 (29.4%) | 36 (70.6%) |
| College/Associate Degree | 7 (38.9%) | 11 (61.1%) |
| Bachelor's Degree or higher | 16 (11.8%) | 120 (88.2%) |
Occupancy by Age of Householder in Jackpot
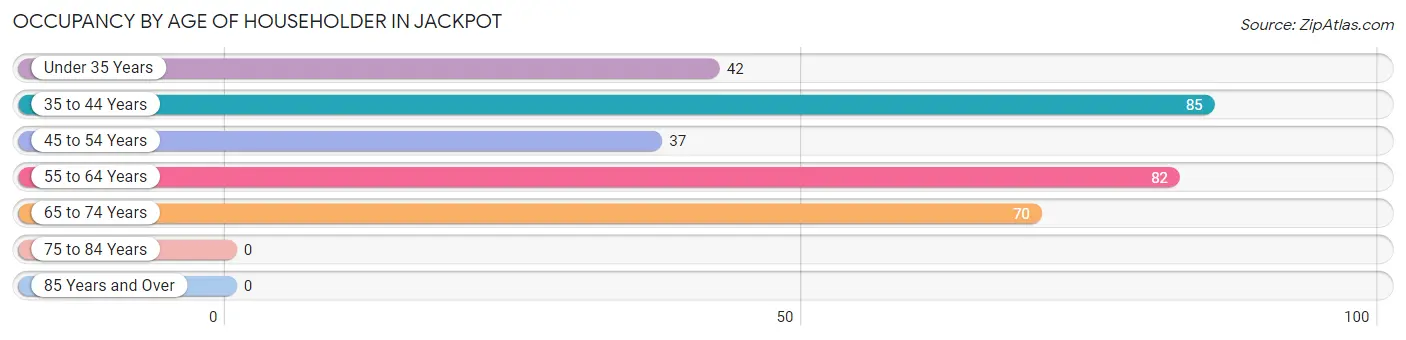
| Age Bracket | # Households | % Households |
| Under 35 Years | 42 | 13.3% |
| 35 to 44 Years | 85 | 26.9% |
| 45 to 54 Years | 37 | 11.7% |
| 55 to 64 Years | 82 | 26.0% |
| 65 to 74 Years | 70 | 22.2% |
| 75 to 84 Years | 0 | 0.0% |
| 85 Years and Over | 0 | 0.0% |
| Total | 316 | 100.0% |
Housing Finances in Jackpot
Median Income by Occupancy in Jackpot
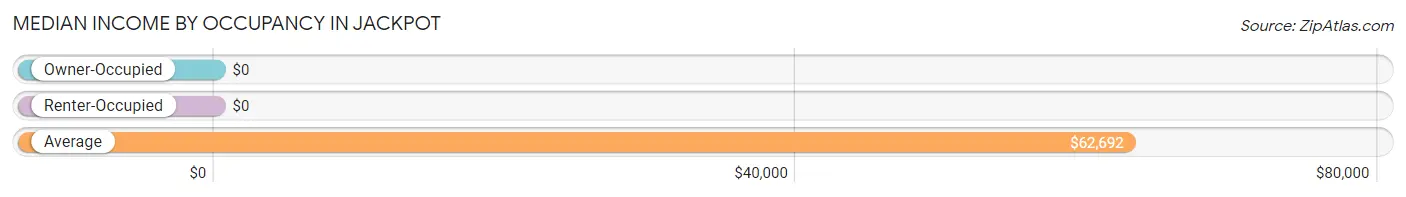
| Occupancy Type | # Households | Median Income |
| Owner-Occupied | 138 (43.7%) | $0 |
| Renter-Occupied | 178 (56.3%) | $0 |
| Average | 316 (100.0%) | $62,692 |
Occupancy by Householder Income Bracket in Jackpot
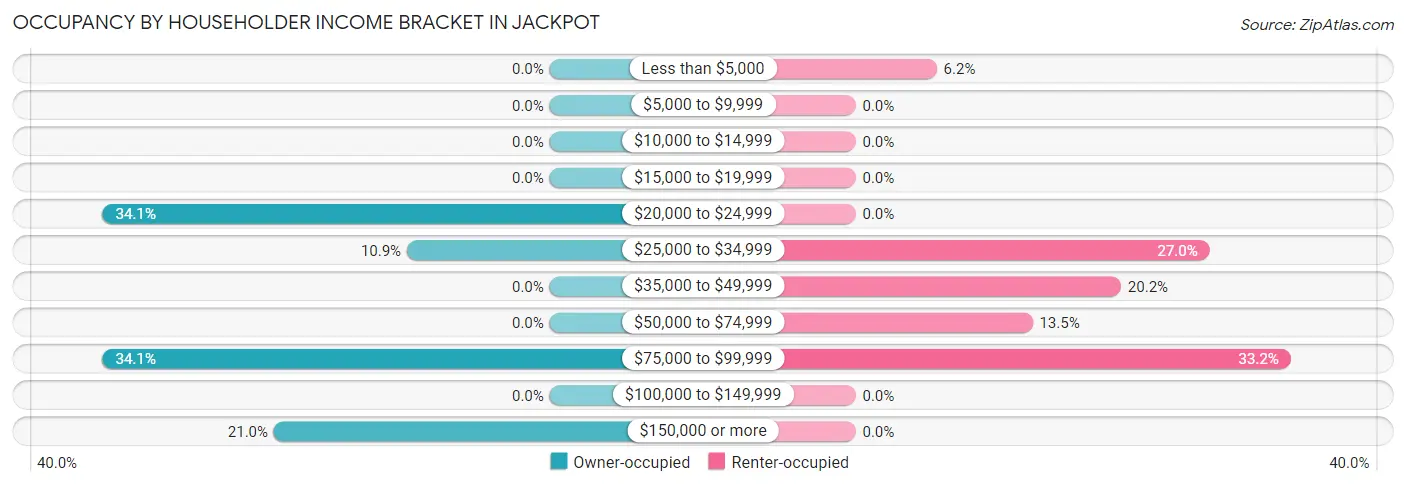
| Income Bracket | Owner-occupied | Renter-occupied |
| Less than $5,000 | 0 (0.0%) | 11 (6.2%) |
| $5,000 to $9,999 | 0 (0.0%) | 0 (0.0%) |
| $10,000 to $14,999 | 0 (0.0%) | 0 (0.0%) |
| $15,000 to $19,999 | 0 (0.0%) | 0 (0.0%) |
| $20,000 to $24,999 | 47 (34.1%) | 0 (0.0%) |
| $25,000 to $34,999 | 15 (10.9%) | 48 (27.0%) |
| $35,000 to $49,999 | 0 (0.0%) | 36 (20.2%) |
| $50,000 to $74,999 | 0 (0.0%) | 24 (13.5%) |
| $75,000 to $99,999 | 47 (34.1%) | 59 (33.2%) |
| $100,000 to $149,999 | 0 (0.0%) | 0 (0.0%) |
| $150,000 or more | 29 (21.0%) | 0 (0.0%) |
| Total | 138 (100.0%) | 178 (100.0%) |
Monthly Housing Cost Tiers in Jackpot
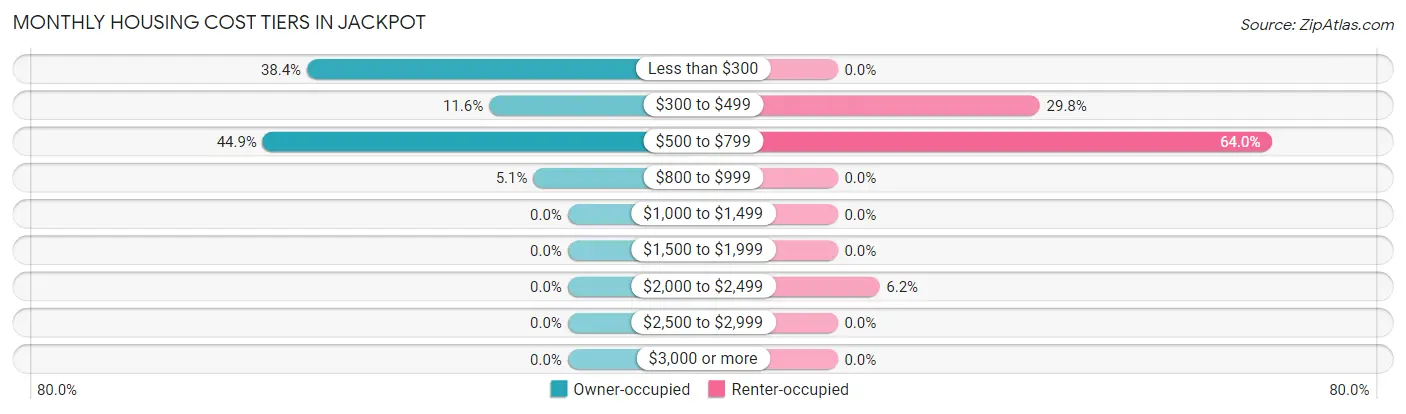
| Monthly Cost | Owner-occupied | Renter-occupied |
| Less than $300 | 53 (38.4%) | 0 (0.0%) |
| $300 to $499 | 16 (11.6%) | 53 (29.8%) |
| $500 to $799 | 62 (44.9%) | 114 (64.0%) |
| $800 to $999 | 7 (5.1%) | 0 (0.0%) |
| $1,000 to $1,499 | 0 (0.0%) | 0 (0.0%) |
| $1,500 to $1,999 | 0 (0.0%) | 0 (0.0%) |
| $2,000 to $2,499 | 0 (0.0%) | 11 (6.2%) |
| $2,500 to $2,999 | 0 (0.0%) | 0 (0.0%) |
| $3,000 or more | 0 (0.0%) | 0 (0.0%) |
| Total | 138 (100.0%) | 178 (100.0%) |
Physical Housing Characteristics in Jackpot
Housing Structures in Jackpot
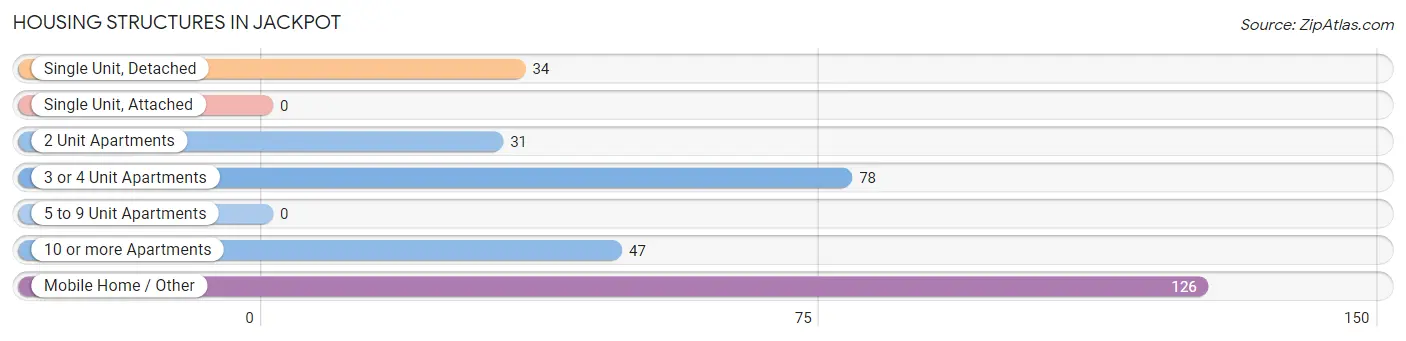
| Structure Type | # Housing Units | % Housing Units |
| Single Unit, Detached | 34 | 10.8% |
| Single Unit, Attached | 0 | 0.0% |
| 2 Unit Apartments | 31 | 9.8% |
| 3 or 4 Unit Apartments | 78 | 24.7% |
| 5 to 9 Unit Apartments | 0 | 0.0% |
| 10 or more Apartments | 47 | 14.9% |
| Mobile Home / Other | 126 | 39.9% |
| Total | 316 | 100.0% |
Housing Structures by Occupancy in Jackpot
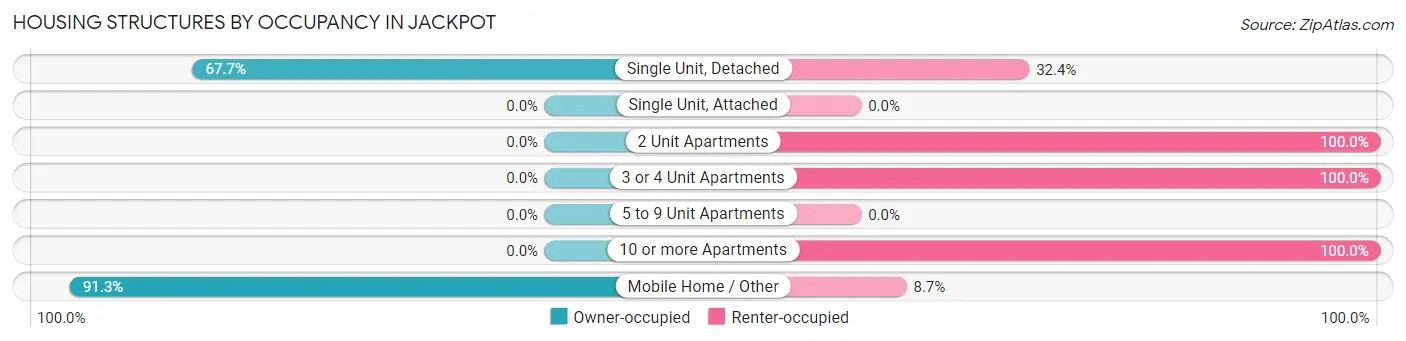
| Structure Type | Owner-occupied | Renter-occupied |
| Single Unit, Detached | 23 (67.6%) | 11 (32.4%) |
| Single Unit, Attached | 0 (0.0%) | 0 (0.0%) |
| 2 Unit Apartments | 0 (0.0%) | 31 (100.0%) |
| 3 or 4 Unit Apartments | 0 (0.0%) | 78 (100.0%) |
| 5 to 9 Unit Apartments | 0 (0.0%) | 0 (0.0%) |
| 10 or more Apartments | 0 (0.0%) | 47 (100.0%) |
| Mobile Home / Other | 115 (91.3%) | 11 (8.7%) |
| Total | 138 (43.7%) | 178 (56.3%) |
Housing Structures by Number of Rooms in Jackpot
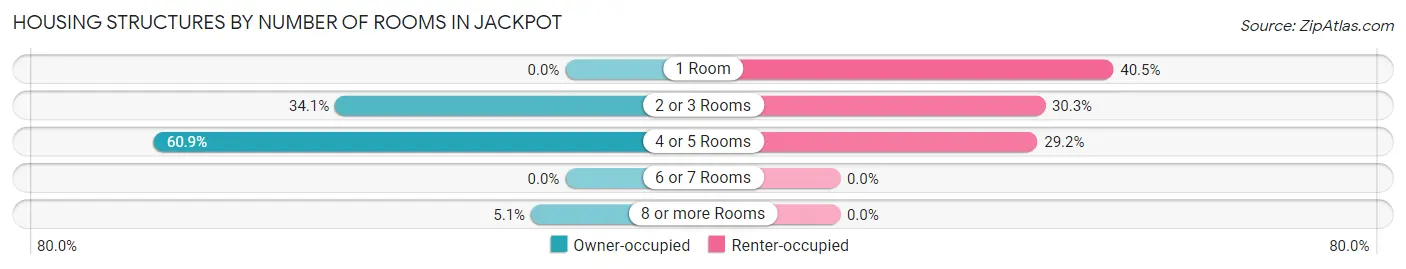
| Number of Rooms | Owner-occupied | Renter-occupied |
| 1 Room | 0 (0.0%) | 72 (40.5%) |
| 2 or 3 Rooms | 47 (34.1%) | 54 (30.3%) |
| 4 or 5 Rooms | 84 (60.9%) | 52 (29.2%) |
| 6 or 7 Rooms | 0 (0.0%) | 0 (0.0%) |
| 8 or more Rooms | 7 (5.1%) | 0 (0.0%) |
| Total | 138 (100.0%) | 178 (100.0%) |
Housing Structure by Heating Type in Jackpot
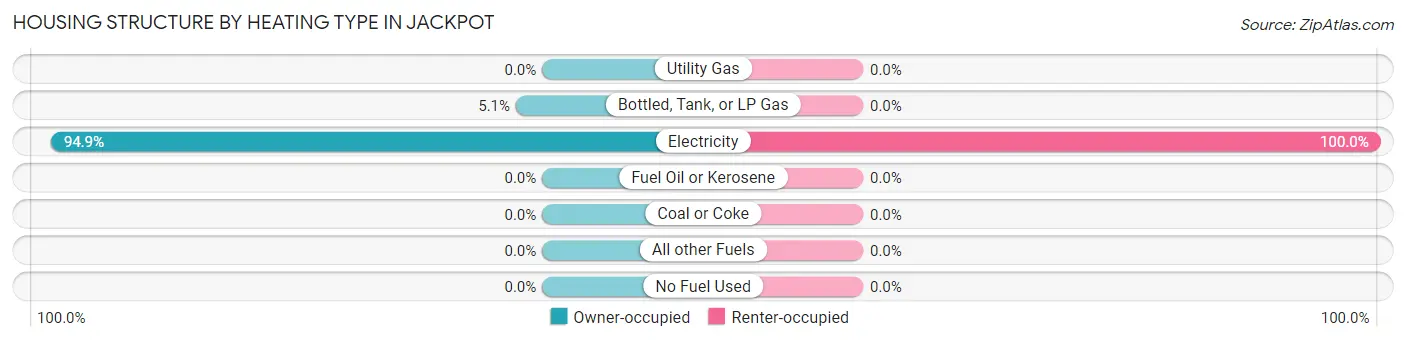
| Heating Type | Owner-occupied | Renter-occupied |
| Utility Gas | 0 (0.0%) | 0 (0.0%) |
| Bottled, Tank, or LP Gas | 7 (5.1%) | 0 (0.0%) |
| Electricity | 131 (94.9%) | 178 (100.0%) |
| Fuel Oil or Kerosene | 0 (0.0%) | 0 (0.0%) |
| Coal or Coke | 0 (0.0%) | 0 (0.0%) |
| All other Fuels | 0 (0.0%) | 0 (0.0%) |
| No Fuel Used | 0 (0.0%) | 0 (0.0%) |
| Total | 138 (100.0%) | 178 (100.0%) |
Household Vehicle Usage in Jackpot
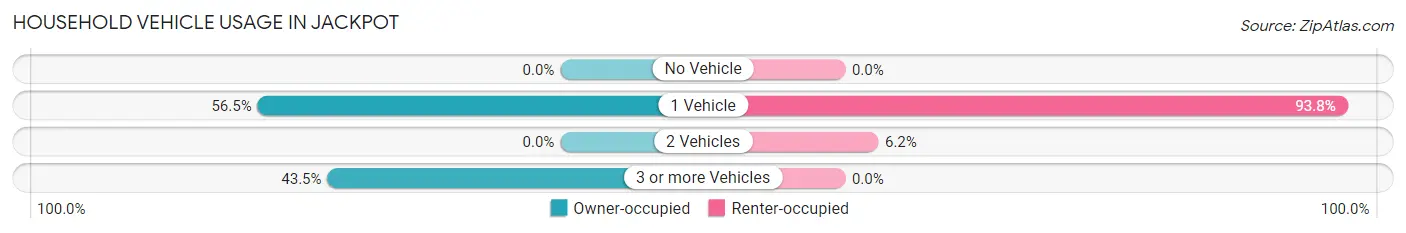
| Vehicles per Household | Owner-occupied | Renter-occupied |
| No Vehicle | 0 (0.0%) | 0 (0.0%) |
| 1 Vehicle | 78 (56.5%) | 167 (93.8%) |
| 2 Vehicles | 0 (0.0%) | 11 (6.2%) |
| 3 or more Vehicles | 60 (43.5%) | 0 (0.0%) |
| Total | 138 (100.0%) | 178 (100.0%) |
Real Estate & Mortgages in Jackpot
Real Estate and Mortgage Overview in Jackpot
| Characteristic | Without Mortgage | With Mortgage |
| Housing Units | 91 | 47 |
| Median Property Value | - | - |
| Median Household Income | $96,169 | $0 |
| Monthly Housing Costs | $283 | $0 |
| Real Estate Taxes | $199 | $0 |
Property Value by Mortgage Status in Jackpot
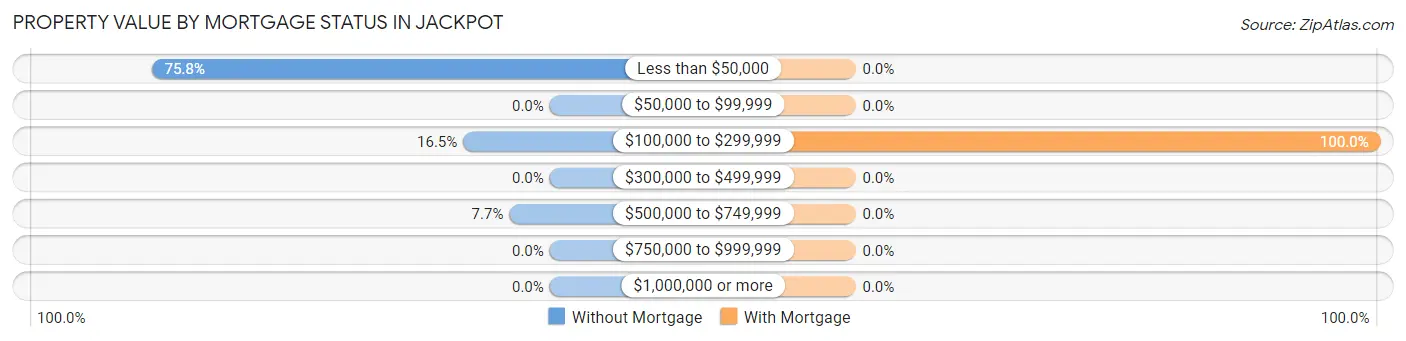
| Property Value | Without Mortgage | With Mortgage |
| Less than $50,000 | 69 (75.8%) | 0 (0.0%) |
| $50,000 to $99,999 | 0 (0.0%) | 0 (0.0%) |
| $100,000 to $299,999 | 15 (16.5%) | 47 (100.0%) |
| $300,000 to $499,999 | 0 (0.0%) | 0 (0.0%) |
| $500,000 to $749,999 | 7 (7.7%) | 0 (0.0%) |
| $750,000 to $999,999 | 0 (0.0%) | 0 (0.0%) |
| $1,000,000 or more | 0 (0.0%) | 0 (0.0%) |
| Total | 91 (100.0%) | 47 (100.0%) |
Household Income by Mortgage Status in Jackpot
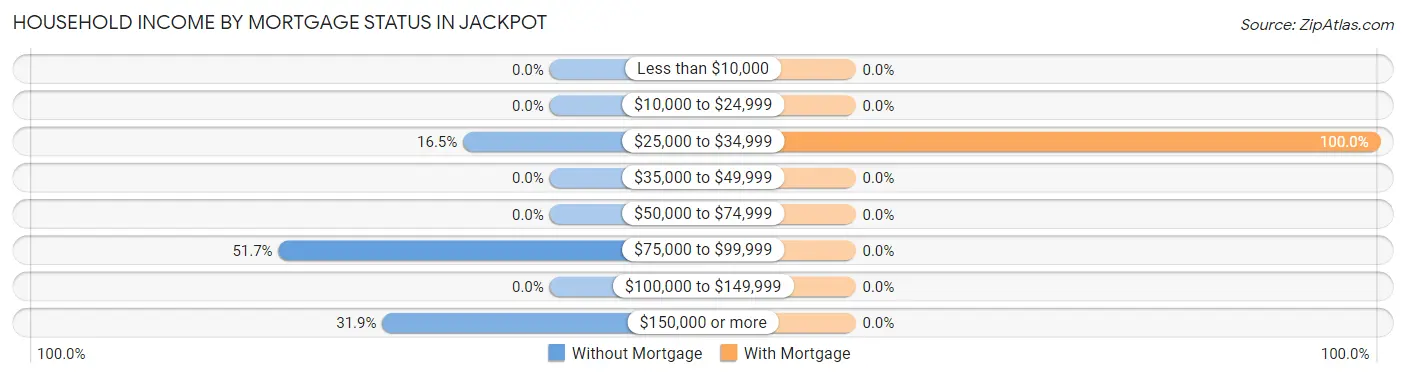
| Household Income | Without Mortgage | With Mortgage |
| Less than $10,000 | 0 (0.0%) | 0 (0.0%) |
| $10,000 to $24,999 | 0 (0.0%) | 0 (0.0%) |
| $25,000 to $34,999 | 15 (16.5%) | 47 (100.0%) |
| $35,000 to $49,999 | 0 (0.0%) | 0 (0.0%) |
| $50,000 to $74,999 | 0 (0.0%) | 0 (0.0%) |
| $75,000 to $99,999 | 47 (51.6%) | 0 (0.0%) |
| $100,000 to $149,999 | 0 (0.0%) | 0 (0.0%) |
| $150,000 or more | 29 (31.9%) | 0 (0.0%) |
| Total | 91 (100.0%) | 47 (100.0%) |
Property Value to Household Income Ratio in Jackpot
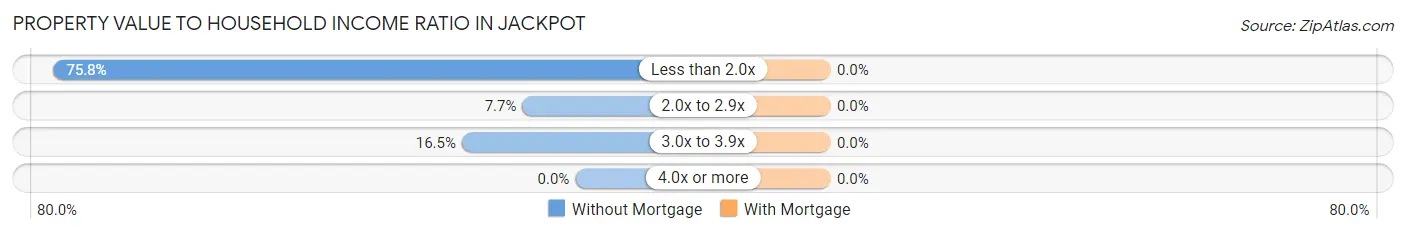
| Value-to-Income Ratio | Without Mortgage | With Mortgage |
| Less than 2.0x | 69 (75.8%) | 0 (0.0%) |
| 2.0x to 2.9x | 7 (7.7%) | 0 (0.0%) |
| 3.0x to 3.9x | 15 (16.5%) | 0 (0.0%) |
| 4.0x or more | 0 (0.0%) | 0 (0.0%) |
| Total | 91 (100.0%) | 47 (100.0%) |
Real Estate Taxes by Mortgage Status in Jackpot
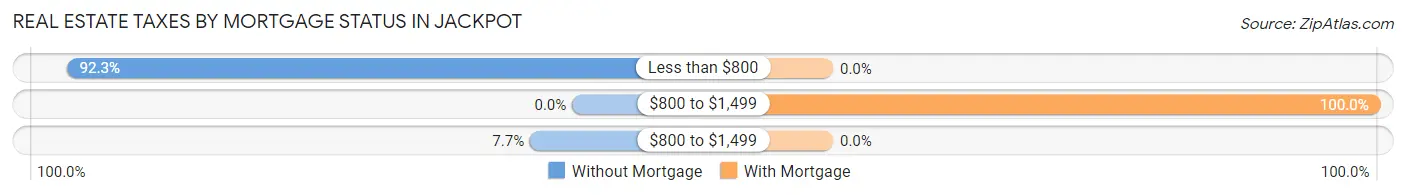
| Property Taxes | Without Mortgage | With Mortgage |
| Less than $800 | 84 (92.3%) | 0 (0.0%) |
| $800 to $1,499 | 0 (0.0%) | 47 (100.0%) |
| $800 to $1,499 | 7 (7.7%) | 0 (0.0%) |
| Total | 91 (100.0%) | 47 (100.0%) |
Health & Disability in Jackpot
Health Insurance Coverage by Age in Jackpot
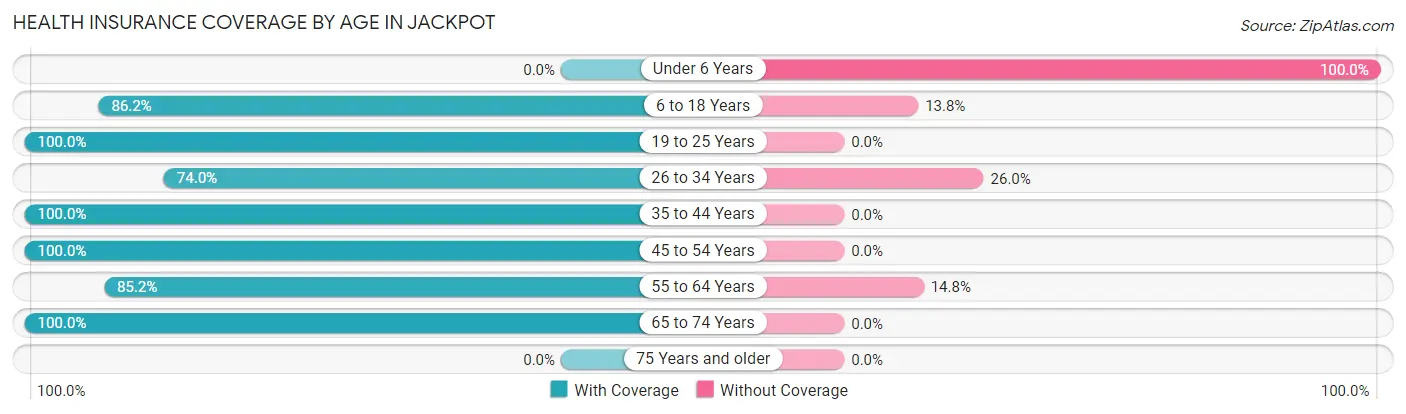
| Age Bracket | With Coverage | Without Coverage |
| Under 6 Years | 0 (0.0%) | 25 (100.0%) |
| 6 to 18 Years | 219 (86.2%) | 35 (13.8%) |
| 19 to 25 Years | 258 (100.0%) | 0 (0.0%) |
| 26 to 34 Years | 208 (74.0%) | 73 (26.0%) |
| 35 to 44 Years | 85 (100.0%) | 0 (0.0%) |
| 45 to 54 Years | 91 (100.0%) | 0 (0.0%) |
| 55 to 64 Years | 92 (85.2%) | 16 (14.8%) |
| 65 to 74 Years | 113 (100.0%) | 0 (0.0%) |
| 75 Years and older | 0 (0.0%) | 0 (0.0%) |
| Total | 1,066 (87.7%) | 149 (12.3%) |
Health Insurance Coverage by Citizenship Status in Jackpot
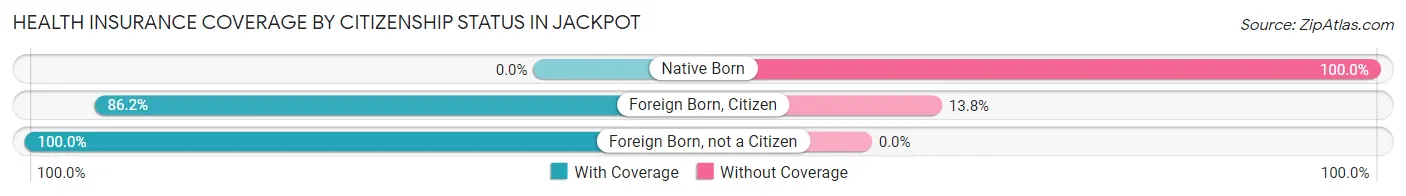
| Citizenship Status | With Coverage | Without Coverage |
| Native Born | 0 (0.0%) | 25 (100.0%) |
| Foreign Born, Citizen | 219 (86.2%) | 35 (13.8%) |
| Foreign Born, not a Citizen | 258 (100.0%) | 0 (0.0%) |
Health Insurance Coverage by Household Income in Jackpot
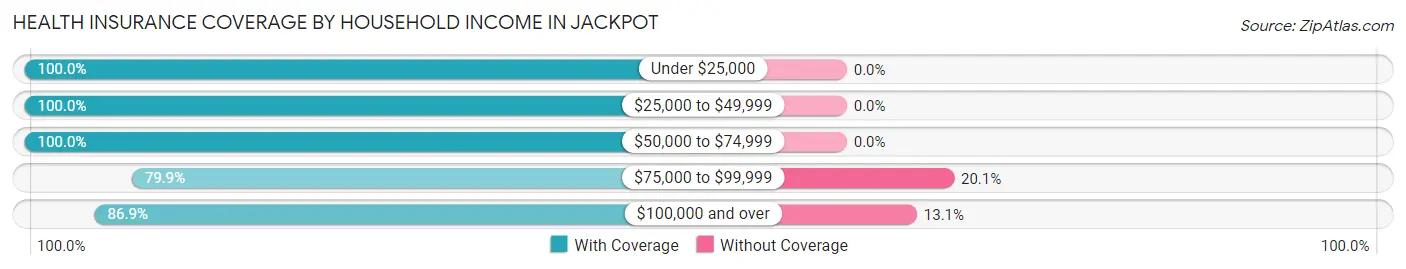
| Household Income | With Coverage | Without Coverage |
| Under $25,000 | 101 (100.0%) | 0 (0.0%) |
| $25,000 to $49,999 | 190 (100.0%) | 0 (0.0%) |
| $50,000 to $74,999 | 24 (100.0%) | 0 (0.0%) |
| $75,000 to $99,999 | 354 (79.9%) | 89 (20.1%) |
| $100,000 and over | 397 (86.9%) | 60 (13.1%) |
Public vs Private Health Insurance Coverage by Age in Jackpot
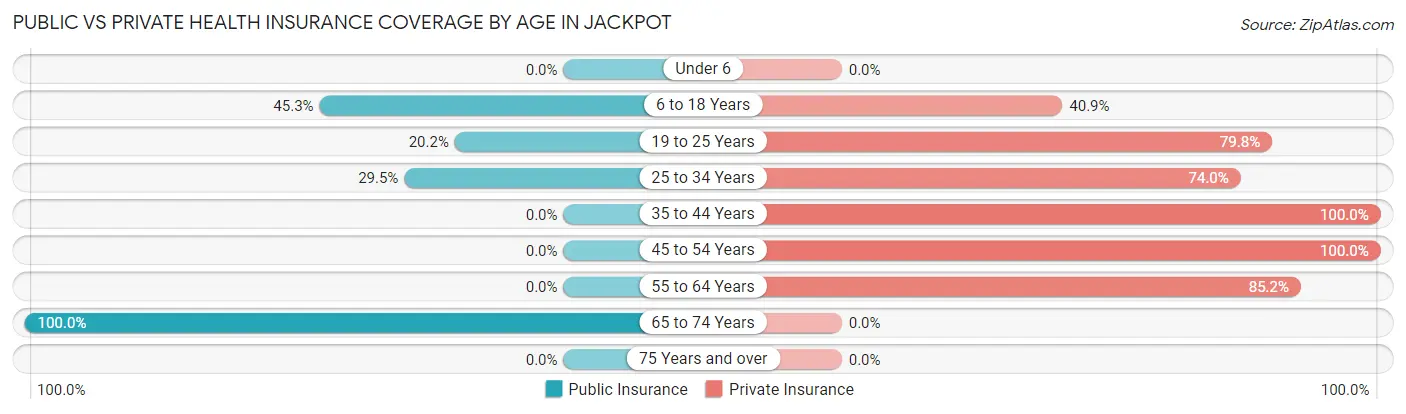
| Age Bracket | Public Insurance | Private Insurance |
| Under 6 | 0 (0.0%) | 0 (0.0%) |
| 6 to 18 Years | 115 (45.3%) | 104 (40.9%) |
| 19 to 25 Years | 52 (20.2%) | 206 (79.8%) |
| 25 to 34 Years | 83 (29.5%) | 208 (74.0%) |
| 35 to 44 Years | 0 (0.0%) | 85 (100.0%) |
| 45 to 54 Years | 0 (0.0%) | 91 (100.0%) |
| 55 to 64 Years | 0 (0.0%) | 92 (85.2%) |
| 65 to 74 Years | 113 (100.0%) | 0 (0.0%) |
| 75 Years and over | 0 (0.0%) | 0 (0.0%) |
| Total | 363 (29.9%) | 786 (64.7%) |
Disability Status by Sex by Age in Jackpot
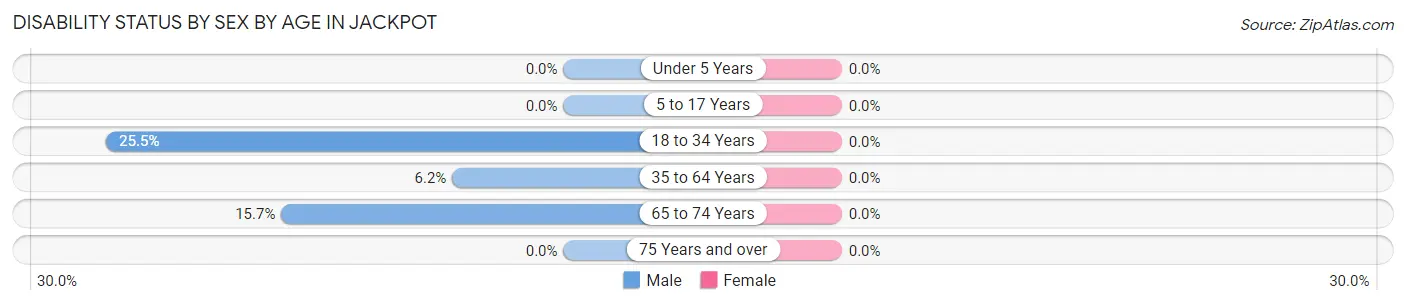
| Age Bracket | Male | Female |
| Under 5 Years | 0 (0.0%) | 0 (0.0%) |
| 5 to 17 Years | 0 (0.0%) | 0 (0.0%) |
| 18 to 34 Years | 125 (25.5%) | 0 (0.0%) |
| 35 to 64 Years | 7 (6.2%) | 0 (0.0%) |
| 65 to 74 Years | 11 (15.7%) | 0 (0.0%) |
| 75 Years and over | 0 (0.0%) | 0 (0.0%) |
Disability Class by Sex by Age in Jackpot
Disability Class: Hearing Difficulty
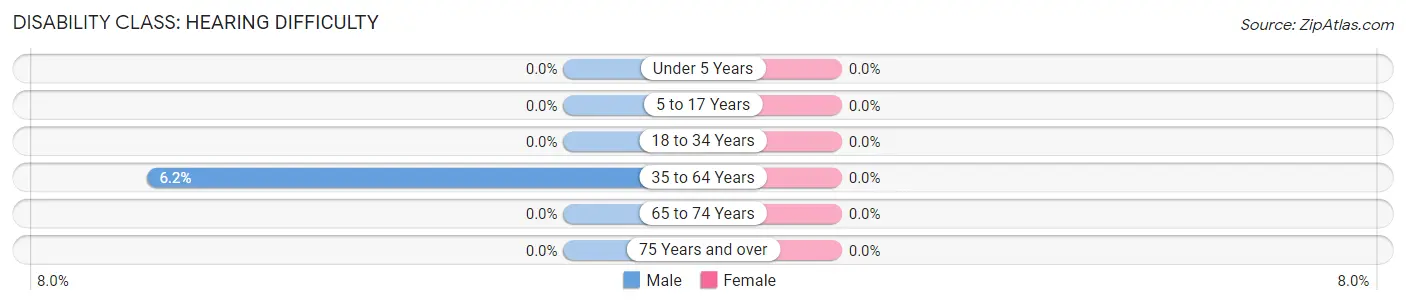
| Age Bracket | Male | Female |
| Under 5 Years | 0 (0.0%) | 0 (0.0%) |
| 5 to 17 Years | 0 (0.0%) | 0 (0.0%) |
| 18 to 34 Years | 0 (0.0%) | 0 (0.0%) |
| 35 to 64 Years | 7 (6.2%) | 0 (0.0%) |
| 65 to 74 Years | 0 (0.0%) | 0 (0.0%) |
| 75 Years and over | 0 (0.0%) | 0 (0.0%) |
Disability Class: Vision Difficulty
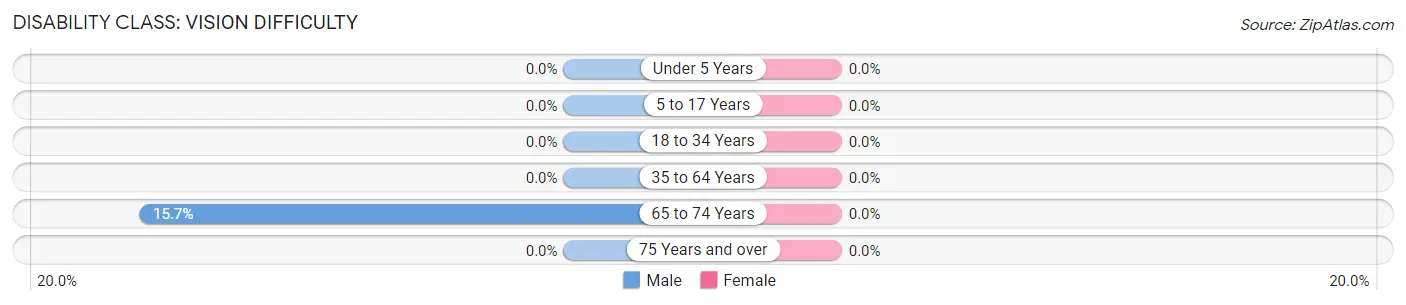
| Age Bracket | Male | Female |
| Under 5 Years | 0 (0.0%) | 0 (0.0%) |
| 5 to 17 Years | 0 (0.0%) | 0 (0.0%) |
| 18 to 34 Years | 0 (0.0%) | 0 (0.0%) |
| 35 to 64 Years | 0 (0.0%) | 0 (0.0%) |
| 65 to 74 Years | 11 (15.7%) | 0 (0.0%) |
| 75 Years and over | 0 (0.0%) | 0 (0.0%) |
Disability Class: Cognitive Difficulty
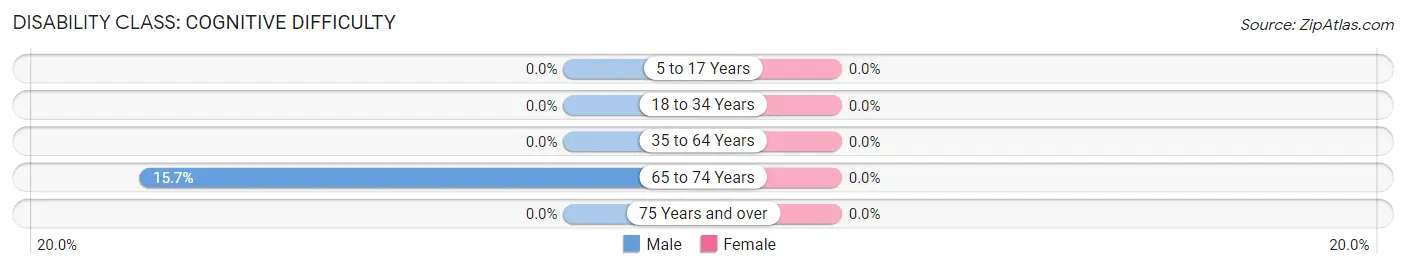
| Age Bracket | Male | Female |
| 5 to 17 Years | 0 (0.0%) | 0 (0.0%) |
| 18 to 34 Years | 0 (0.0%) | 0 (0.0%) |
| 35 to 64 Years | 0 (0.0%) | 0 (0.0%) |
| 65 to 74 Years | 11 (15.7%) | 0 (0.0%) |
| 75 Years and over | 0 (0.0%) | 0 (0.0%) |
Disability Class: Ambulatory Difficulty
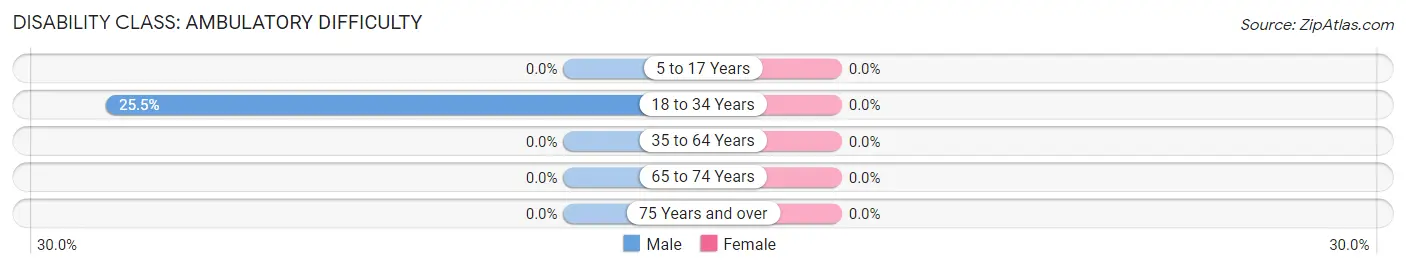
| Age Bracket | Male | Female |
| 5 to 17 Years | 0 (0.0%) | 0 (0.0%) |
| 18 to 34 Years | 125 (25.5%) | 0 (0.0%) |
| 35 to 64 Years | 0 (0.0%) | 0 (0.0%) |
| 65 to 74 Years | 0 (0.0%) | 0 (0.0%) |
| 75 Years and over | 0 (0.0%) | 0 (0.0%) |
Disability Class: Self-Care Difficulty
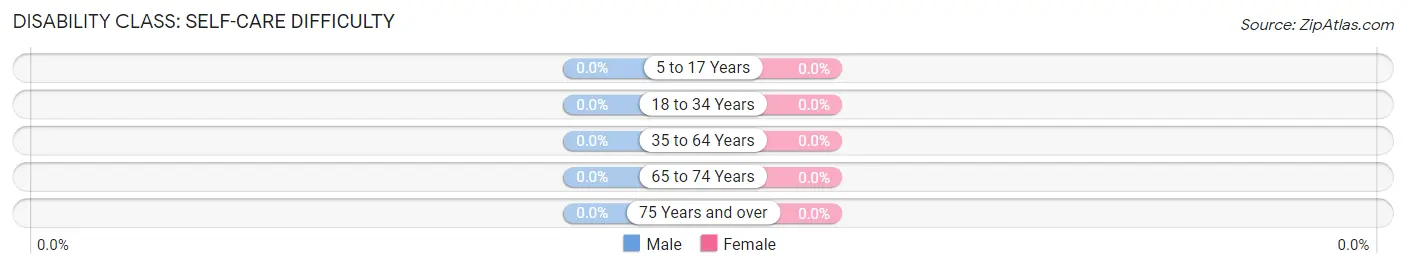
| Age Bracket | Male | Female |
| 5 to 17 Years | 0 (0.0%) | 0 (0.0%) |
| 18 to 34 Years | 0 (0.0%) | 0 (0.0%) |
| 35 to 64 Years | 0 (0.0%) | 0 (0.0%) |
| 65 to 74 Years | 0 (0.0%) | 0 (0.0%) |
| 75 Years and over | 0 (0.0%) | 0 (0.0%) |
Technology Access in Jackpot
Computing Device Access in Jackpot
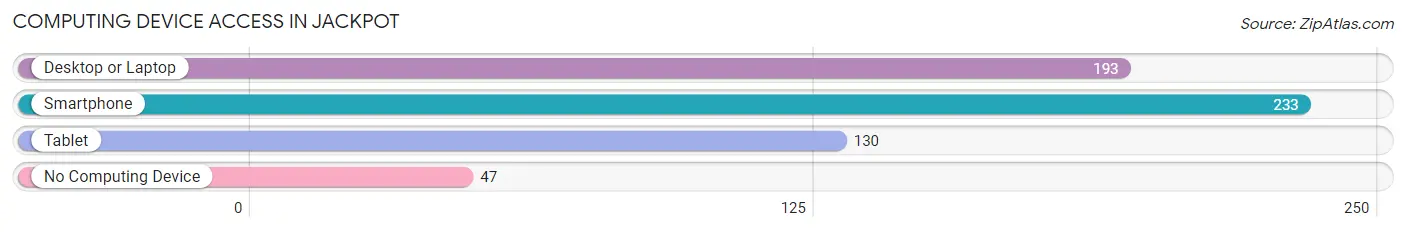
| Device Type | # Households | % Households |
| Desktop or Laptop | 193 | 61.1% |
| Smartphone | 233 | 73.7% |
| Tablet | 130 | 41.1% |
| No Computing Device | 47 | 14.9% |
| Total | 316 | 100.0% |
Internet Access in Jackpot
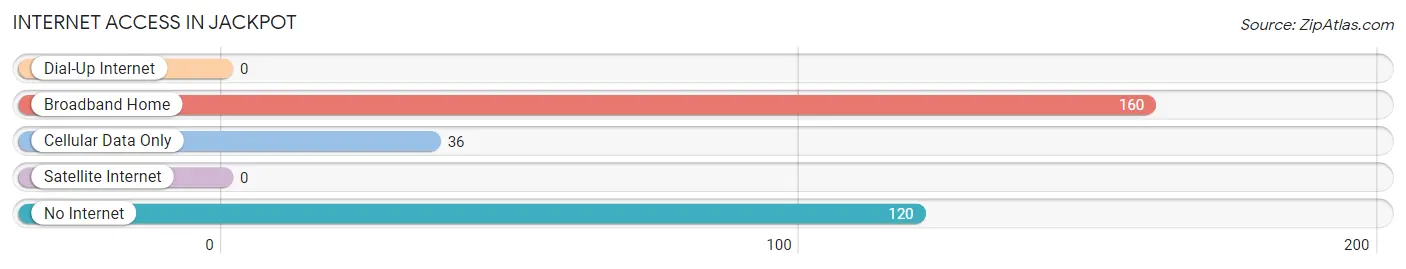
| Internet Type | # Households | % Households |
| Dial-Up Internet | 0 | 0.0% |
| Broadband Home | 160 | 50.6% |
| Cellular Data Only | 36 | 11.4% |
| Satellite Internet | 0 | 0.0% |
| No Internet | 120 | 38.0% |
| Total | 316 | 100.0% |
Jackpot Summary
Jackpot, Nevada is a small town located in Elko County, in the northeastern corner of the state. It is situated on the Idaho border, just south of the city of Twin Falls, Idaho. The town was founded in the early 1900s as a railroad stop, and has since grown to become a popular destination for gambling, entertainment, and outdoor recreation.
Geography
Jackpot is located in the high desert of northeastern Nevada, at an elevation of 5,837 feet. The town is situated in the Humboldt River Valley, and is surrounded by the Jarbidge Mountains to the east, the Owyhee Mountains to the south, and the Snake River Plain to the west. The climate in Jackpot is semi-arid, with hot summers and cold winters. The average annual precipitation is 8.5 inches, and the average annual temperature is 48.3 degrees Fahrenheit.
Economy
The economy of Jackpot is largely based on tourism and gambling. The town is home to several casinos, including the Cactus Petes Resort Casino, the Barton's Club 93, and the Four Jacks Hotel and Casino. These casinos offer a variety of gaming options, including slots, table games, and video poker. In addition to the casinos, Jackpot is home to several restaurants, bars, and other entertainment venues.
The town is also home to several businesses that provide services to the local community. These include a grocery store, a gas station, a post office, and a bank. The town also has a small airport, which serves as a hub for air travel to and from the surrounding area.
Demographics
As of the 2010 census, the population of Jackpot was 1,195. The racial makeup of the town was 94.3% White, 0.3% African American, 0.7% Native American, 0.2% Asian, 0.1% Pacific Islander, 2.2% from other races, and 2.4% from two or more races. Hispanic or Latino of any race were 5.3% of the population.
The median household income in Jackpot was $37,917, and the median family income was $41,250. The per capita income for the town was $19,945. About 11.2% of families and 13.2% of the population were below the poverty line, including 16.2% of those under age 18 and 8.3% of those age 65 or over.
Conclusion
Jackpot, Nevada is a small town located in Elko County, in the northeastern corner of the state. It is situated on the Idaho border, just south of the city of Twin Falls, Idaho. The town was founded in the early 1900s as a railroad stop, and has since grown to become a popular destination for gambling, entertainment, and outdoor recreation. The economy of Jackpot is largely based on tourism and gambling, and the town is home to several casinos, restaurants, bars, and other businesses. As of the 2010 census, the population of Jackpot was 1,195. The median household income in Jackpot was $37,917, and the median family income was $41,250. Jackpot is a unique and vibrant community, offering visitors and residents alike a variety of activities and attractions.
Common Questions
What is Per Capita Income in Jackpot?
Per Capita income in Jackpot is $25,171.
What is the Median Household income in Jackpot?
Median Household Income in Jackpot is $62,692.
What is Income or Wage Gap in Jackpot?
Income or Wage Gap in Jackpot is 7.7%.
Women in Jackpot earn 92.3 cents for every dollar earned by a man.
What is Inequality or Gini Index in Jackpot?
Inequality or Gini Index in Jackpot is 0.43.
What is the Total Population of Jackpot?
Total Population of Jackpot is 1,215.
What is the Total Male Population of Jackpot?
Total Male Population of Jackpot is 765.
What is the Total Female Population of Jackpot?
Total Female Population of Jackpot is 450.
What is the Ratio of Males per 100 Females in Jackpot?
There are 170.00 Males per 100 Females in Jackpot.
What is the Ratio of Females per 100 Males in Jackpot?
There are 58.82 Females per 100 Males in Jackpot.
What is the Median Population Age in Jackpot?
Median Population Age in Jackpot is 28.8 Years.
What is the Average Family Size in Jackpot
Average Family Size in Jackpot is 5.5 People.
What is the Average Household Size in Jackpot
Average Household Size in Jackpot is 3.8 People.
How Large is the Labor Force in Jackpot?
There are 866 People in the Labor Forcein in Jackpot.
What is the Percentage of People in the Labor Force in Jackpot?
89.0% of People are in the Labor Force in Jackpot.
What is the Unemployment Rate in Jackpot?
Unemployment Rate in Jackpot is 14.4%.