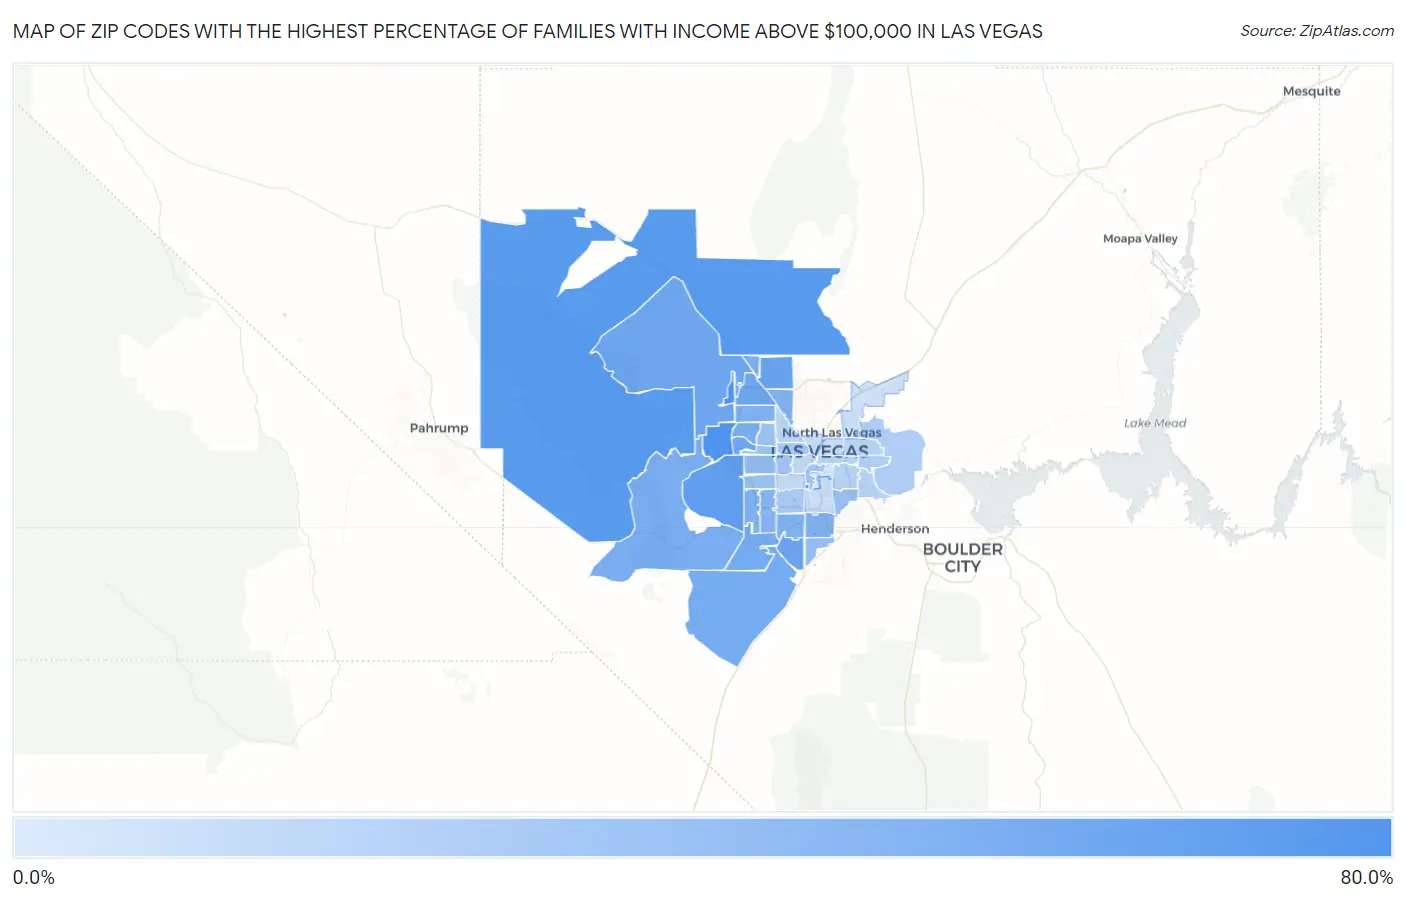
Zip Codes with the Highest Percentage of Families with Income Above $100,000 in Las Vegas, NV
RELATED REPORTS & OPTIONS
Family Income | $100k+
Las Vegas
Compare Zip Codes
Map of Zip Codes with the Highest Percentage of Families with Income Above $100,000 in Las Vegas
10.5%
78.7%
Zip Codes with the Highest Percentage of Families with Income Above $100,000 in Las Vegas, NV
| Zip Code | Families with Income > $100k | vs State | vs National | |
| 1. | 89158 | 78.7% | 41.4%(+37.3)#4 | 46.1%(+32.6)#1,179 |
| 2. | 89138 | 74.0% | 41.4%(+32.6)#9 | 46.1%(+27.9)#1,880 |
| 3. | 89124 | 69.6% | 41.4%(+28.2)#14 | 46.1%(+23.5)#2,701 |
| 4. | 89135 | 64.5% | 41.4%(+23.1)#22 | 46.1%(+18.4)#3,872 |
| 5. | 89131 | 60.2% | 41.4%(+18.8)#30 | 46.1%(+14.1)#5,064 |
| 6. | 89141 | 59.4% | 41.4%(+18.0)#32 | 46.1%(+13.3)#5,317 |
| 7. | 89166 | 57.8% | 41.4%(+16.4)#35 | 46.1%(+11.7)#5,836 |
| 8. | 89149 | 57.1% | 41.4%(+15.7)#36 | 46.1%(+11.0)#6,057 |
| 9. | 89144 | 56.3% | 41.4%(+14.9)#40 | 46.1%(+10.2)#6,316 |
| 10. | 89178 | 54.2% | 41.4%(+12.8)#45 | 46.1%(+8.10)#7,092 |
| 11. | 89179 | 54.2% | 41.4%(+12.8)#46 | 46.1%(+8.10)#7,100 |
| 12. | 89134 | 51.8% | 41.4%(+10.4)#50 | 46.1%(+5.70)#8,059 |
| 13. | 89161 | 51.4% | 41.4%(+10.0)#51 | 46.1%(+5.30)#8,265 |
| 14. | 89143 | 50.3% | 41.4%(+8.90)#53 | 46.1%(+4.20)#8,695 |
| 15. | 89123 | 49.0% | 41.4%(+7.60)#57 | 46.1%(+2.90)#9,255 |
| 16. | 89129 | 48.8% | 41.4%(+7.40)#58 | 46.1%(+2.70)#9,345 |
| 17. | 89139 | 48.6% | 41.4%(+7.20)#59 | 46.1%(+2.50)#9,443 |
| 18. | 89130 | 48.6% | 41.4%(+7.20)#60 | 46.1%(+2.50)#9,446 |
| 19. | 89148 | 48.5% | 41.4%(+7.10)#61 | 46.1%(+2.40)#9,496 |
| 20. | 89113 | 46.3% | 41.4%(+4.90)#68 | 46.1%(+0.200)#10,647 |
| 21. | 89117 | 40.1% | 41.4%(-1.30)#83 | 46.1%(-6.00)#14,307 |
| 22. | 89120 | 38.4% | 41.4%(-3.00)#91 | 46.1%(-7.70)#15,472 |
| 23. | 89183 | 37.6% | 41.4%(-3.80)#92 | 46.1%(-8.50)#16,034 |
| 24. | 89147 | 37.0% | 41.4%(-4.40)#93 | 46.1%(-9.10)#16,491 |
| 25. | 89128 | 35.4% | 41.4%(-6.00)#100 | 46.1%(-10.7)#17,596 |
| 26. | 89145 | 35.1% | 41.4%(-6.30)#103 | 46.1%(-11.0)#17,817 |
| 27. | 89109 | 34.3% | 41.4%(-7.10)#105 | 46.1%(-11.8)#18,379 |
| 28. | 89146 | 32.6% | 41.4%(-8.80)#109 | 46.1%(-13.5)#19,594 |
| 29. | 89118 | 30.8% | 41.4%(-10.6)#113 | 46.1%(-15.3)#20,852 |
| 30. | 89107 | 30.0% | 41.4%(-11.4)#117 | 46.1%(-16.1)#21,401 |
| 31. | 89156 | 27.8% | 41.4%(-13.6)#123 | 46.1%(-18.3)#22,905 |
| 32. | 89142 | 26.0% | 41.4%(-15.4)#124 | 46.1%(-20.1)#24,088 |
| 33. | 89121 | 24.5% | 41.4%(-16.9)#129 | 46.1%(-21.6)#24,986 |
| 34. | 89122 | 24.4% | 41.4%(-17.0)#131 | 46.1%(-21.7)#25,060 |
| 35. | 89104 | 22.7% | 41.4%(-18.7)#134 | 46.1%(-23.4)#25,945 |
| 36. | 89108 | 22.3% | 41.4%(-19.1)#136 | 46.1%(-23.8)#26,145 |
| 37. | 89110 | 22.1% | 41.4%(-19.3)#138 | 46.1%(-24.0)#26,238 |
| 38. | 89102 | 19.6% | 41.4%(-21.8)#143 | 46.1%(-26.5)#27,413 |
| 39. | 89103 | 19.2% | 41.4%(-22.2)#144 | 46.1%(-26.9)#27,593 |
| 40. | 89119 | 18.0% | 41.4%(-23.4)#146 | 46.1%(-28.1)#28,060 |
| 41. | 89106 | 16.4% | 41.4%(-25.0)#150 | 46.1%(-29.7)#28,663 |
| 42. | 89115 | 15.2% | 41.4%(-26.2)#151 | 46.1%(-30.9)#29,030 |
| 43. | 89101 | 14.9% | 41.4%(-26.5)#152 | 46.1%(-31.2)#29,133 |
| 44. | 89169 | 10.5% | 41.4%(-30.9)#154 | 46.1%(-35.6)#30,247 |
1
Common Questions
What are the Top 10 Zip Codes with the Highest Percentage of Families with Income Above $100,000 in Las Vegas, NV?
Top 10 Zip Codes with the Highest Percentage of Families with Income Above $100,000 in Las Vegas, NV are:
What zip code has the Highest Percentage of Families with Income Above $100,000 in Las Vegas, NV?
89158 has the Highest Percentage of Families with Income Above $100,000 in Las Vegas, NV with 78.7%.
What is the Percentage of Families with Income Above $100,000 in Las Vegas, NV?
Percentage of Families with Income Above $100,000 in Las Vegas is 39.1%.
What is the Percentage of Families with Income Above $100,000 in Nevada?
Percentage of Families with Income Above $100,000 in Nevada is 41.4%.
What is the Percentage of Families with Income Above $100,000 in the United States?
Percentage of Families with Income Above $100,000 in the United States is 46.1%.