Zip Codes with the Highest Percentage of Families with Income Above $100,000 in Nevada
RELATED REPORTS & OPTIONS
Family Income | $100k+
Nevada
Compare Zip Codes
Map of Zip Codes with the Highest Percentage of Families with Income Above $100,000 in Nevada
30.0%
100.0%
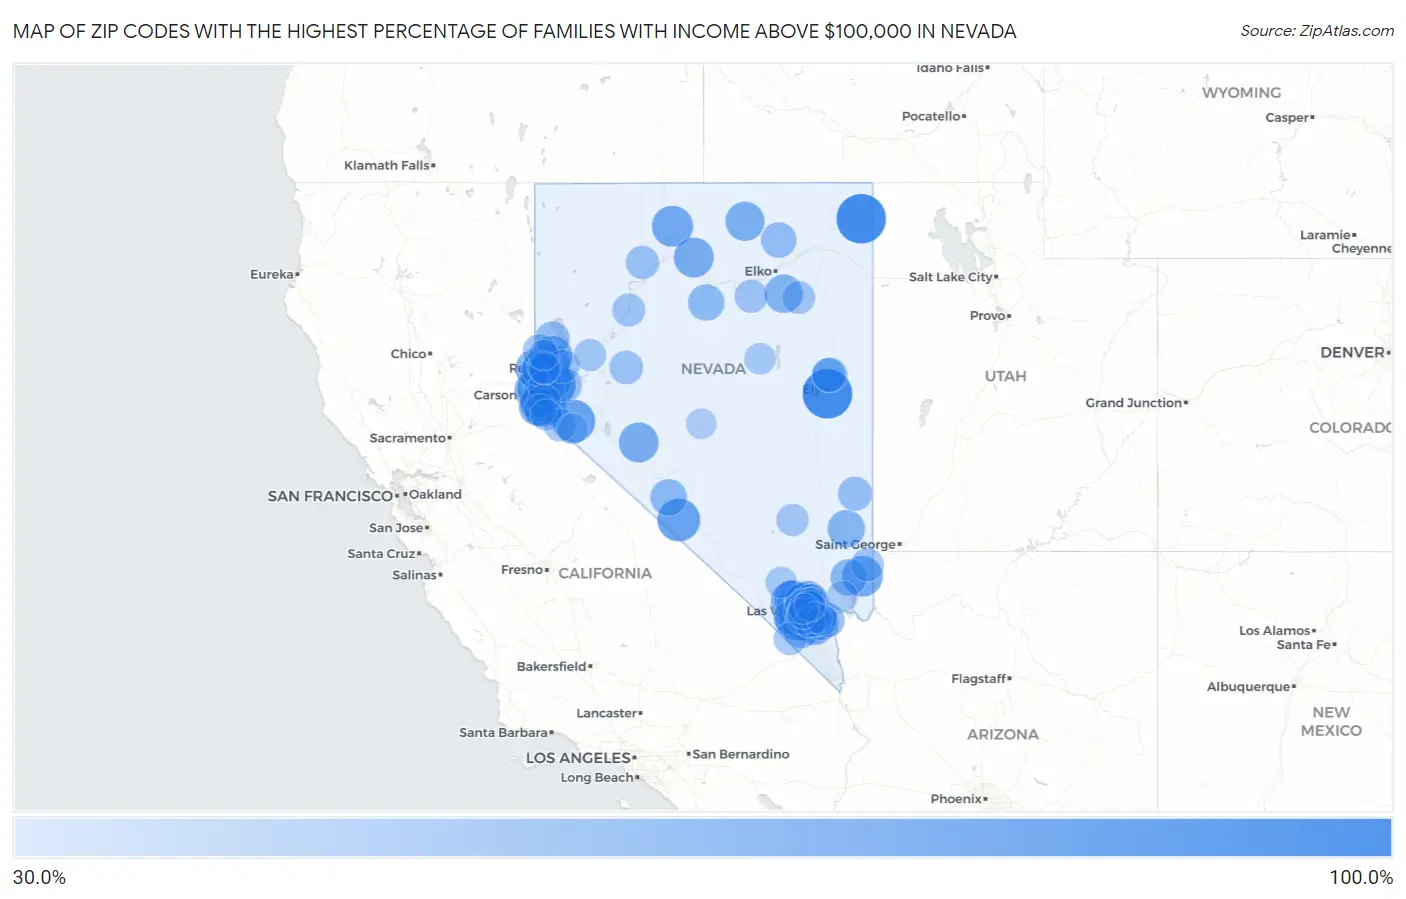
Zip Codes with the Highest Percentage of Families with Income Above $100,000 in Nevada
| Zip Code | Families with Income > $100k | vs State | vs National | |
| 1. | 89315 | 100.0% | 41.4% (+58.6)#1 | 46.1% (+53.9)#168 |
| 2. | 89830 | 100.0% | 41.4% (+58.6)#2 | 46.1% (+53.9)#194 |
| 3. | 89440 | 80.4% | 41.4% (+39.0)#3 | 46.1% (+34.3)#983 |
| 4. | 89158 | 78.7% | 41.4% (+37.3)#4 | 46.1% (+32.6)#1,179 |
| 5. | 89430 | 77.3% | 41.4% (+35.9)#5 | 46.1% (+31.2)#1,373 |
| 6. | 89013 | 77.1% | 41.4% (+35.7)#6 | 46.1% (+31.0)#1,397 |
| 7. | 89004 | 76.6% | 41.4% (+35.2)#7 | 46.1% (+30.5)#1,475 |
| 8. | 89519 | 75.0% | 41.4% (+33.6)#8 | 46.1% (+28.9)#1,700 |
| 9. | 89138 | 74.0% | 41.4% (+32.6)#9 | 46.1% (+27.9)#1,880 |
| 10. | 89426 | 71.2% | 41.4% (+29.8)#10 | 46.1% (+25.1)#2,376 |
| 11. | 89411 | 71.1% | 41.4% (+29.7)#11 | 46.1% (+25.0)#2,391 |
| 12. | 89402 | 70.2% | 41.4% (+28.8)#12 | 46.1% (+24.1)#2,569 |
| 13. | 89451 | 70.0% | 41.4% (+28.6)#13 | 46.1% (+23.9)#2,601 |
| 14. | 89124 | 69.6% | 41.4% (+28.2)#14 | 46.1% (+23.5)#2,701 |
| 15. | 89007 | 69.4% | 41.4% (+28.0)#15 | 46.1% (+23.3)#2,749 |
| 16. | 89441 | 68.6% | 41.4% (+27.2)#16 | 46.1% (+22.5)#2,900 |
| 17. | 89414 | 67.2% | 41.4% (+25.8)#17 | 46.1% (+21.1)#3,213 |
| 18. | 89420 | 66.7% | 41.4% (+25.3)#18 | 46.1% (+20.6)#3,323 |
| 19. | 89511 | 66.6% | 41.4% (+25.2)#19 | 46.1% (+20.5)#3,336 |
| 20. | 89448 | 66.0% | 41.4% (+24.6)#20 | 46.1% (+19.9)#3,505 |
| 21. | 89834 | 64.7% | 41.4% (+23.3)#21 | 46.1% (+18.6)#3,840 |
| 22. | 89135 | 64.5% | 41.4% (+23.1)#22 | 46.1% (+18.4)#3,872 |
| 23. | 89439 | 63.6% | 41.4% (+22.2)#23 | 46.1% (+17.5)#4,126 |
| 24. | 89703 | 63.2% | 41.4% (+21.8)#24 | 46.1% (+17.1)#4,229 |
| 25. | 89521 | 62.9% | 41.4% (+21.5)#25 | 46.1% (+16.8)#4,298 |
| 26. | 89085 | 61.9% | 41.4% (+20.5)#26 | 46.1% (+15.8)#4,581 |
| 27. | 89815 | 61.3% | 41.4% (+19.9)#27 | 46.1% (+15.2)#4,754 |
| 28. | 89436 | 61.1% | 41.4% (+19.7)#28 | 46.1% (+15.0)#4,811 |
| 29. | 89052 | 60.2% | 41.4% (+18.8)#29 | 46.1% (+14.1)#5,063 |
| 30. | 89131 | 60.2% | 41.4% (+18.8)#30 | 46.1% (+14.1)#5,064 |
| 31. | 89044 | 59.5% | 41.4% (+18.1)#31 | 46.1% (+13.4)#5,291 |
| 32. | 89141 | 59.4% | 41.4% (+18.0)#32 | 46.1% (+13.3)#5,317 |
| 33. | 89008 | 58.8% | 41.4% (+17.4)#33 | 46.1% (+12.7)#5,528 |
| 34. | 89413 | 58.5% | 41.4% (+17.1)#34 | 46.1% (+12.4)#5,627 |
| 35. | 89166 | 57.8% | 41.4% (+16.4)#35 | 46.1% (+11.7)#5,836 |
| 36. | 89149 | 57.1% | 41.4% (+15.7)#36 | 46.1% (+11.0)#6,057 |
| 37. | 89509 | 57.1% | 41.4% (+15.7)#37 | 46.1% (+11.0)#6,059 |
| 38. | 89012 | 56.7% | 41.4% (+15.3)#38 | 46.1% (+10.6)#6,177 |
| 39. | 89423 | 56.5% | 41.4% (+15.1)#39 | 46.1% (+10.4)#6,255 |
| 40. | 89144 | 56.3% | 41.4% (+14.9)#40 | 46.1% (+10.2)#6,316 |
| 41. | 89021 | 56.3% | 41.4% (+14.9)#41 | 46.1% (+10.2)#6,330 |
| 42. | 89047 | 56.1% | 41.4% (+14.7)#42 | 46.1% (+10.0)#6,421 |
| 43. | 89820 | 55.4% | 41.4% (+14.0)#43 | 46.1% (+9.30)#6,666 |
| 44. | 89523 | 54.9% | 41.4% (+13.5)#44 | 46.1% (+8.80)#6,827 |
| 45. | 89178 | 54.2% | 41.4% (+12.8)#45 | 46.1% (+8.10)#7,092 |
| 46. | 89179 | 54.2% | 41.4% (+12.8)#46 | 46.1% (+8.10)#7,100 |
| 47. | 89704 | 53.8% | 41.4% (+12.4)#47 | 46.1% (+7.70)#7,245 |
| 48. | 89002 | 52.5% | 41.4% (+11.1)#48 | 46.1% (+6.40)#7,745 |
| 49. | 89801 | 52.3% | 41.4% (+10.9)#49 | 46.1% (+6.20)#7,840 |
| 50. | 89134 | 51.8% | 41.4% (+10.4)#50 | 46.1% (+5.70)#8,059 |
| 51. | 89161 | 51.4% | 41.4% (+10.0)#51 | 46.1% (+5.30)#8,265 |
| 52. | 89318 | 50.6% | 41.4% (+9.20)#52 | 46.1% (+4.50)#8,594 |
| 53. | 89143 | 50.3% | 41.4% (+8.90)#53 | 46.1% (+4.20)#8,695 |
| 54. | 89510 | 49.6% | 41.4% (+8.20)#54 | 46.1% (+3.50)#9,035 |
| 55. | 89084 | 49.3% | 41.4% (+7.90)#55 | 46.1% (+3.20)#9,146 |
| 56. | 89005 | 49.1% | 41.4% (+7.70)#56 | 46.1% (+3.00)#9,230 |
| 57. | 89123 | 49.0% | 41.4% (+7.60)#57 | 46.1% (+2.90)#9,255 |
| 58. | 89129 | 48.8% | 41.4% (+7.40)#58 | 46.1% (+2.70)#9,345 |
| 59. | 89139 | 48.6% | 41.4% (+7.20)#59 | 46.1% (+2.50)#9,443 |
| 60. | 89130 | 48.6% | 41.4% (+7.20)#60 | 46.1% (+2.50)#9,446 |
| 61. | 89148 | 48.5% | 41.4% (+7.10)#61 | 46.1% (+2.40)#9,496 |
| 62. | 89508 | 48.5% | 41.4% (+7.10)#62 | 46.1% (+2.40)#9,511 |
| 63. | 89011 | 48.1% | 41.4% (+6.70)#63 | 46.1% (+2.00)#9,692 |
| 64. | 89042 | 47.8% | 41.4% (+6.40)#64 | 46.1% (+1.70)#9,885 |
| 65. | 89074 | 47.3% | 41.4% (+5.90)#65 | 46.1% (+1.20)#10,125 |
| 66. | 89301 | 46.7% | 41.4% (+5.30)#66 | 46.1% (+0.600)#10,459 |
| 67. | 89403 | 46.6% | 41.4% (+5.20)#67 | 46.1% (+0.500)#10,506 |
| 68. | 89113 | 46.3% | 41.4% (+4.90)#68 | 46.1% (+0.200)#10,647 |
| 69. | 89434 | 46.3% | 41.4% (+4.90)#69 | 46.1% (+0.200)#10,651 |
| 70. | 89406 | 46.2% | 41.4% (+4.80)#70 | 46.1% (+0.100)#10,701 |
| 71. | 89705 | 46.2% | 41.4% (+4.80)#71 | 46.1% (+0.100)#10,713 |
| 72. | 89445 | 45.2% | 41.4% (+3.80)#72 | 46.1% (-0.900)#11,222 |
| 73. | 89822 | 44.5% | 41.4% (+3.10)#73 | 46.1% (-1.60)#11,634 |
| 74. | 89419 | 44.0% | 41.4% (+2.60)#74 | 46.1% (-2.10)#11,912 |
| 75. | 89034 | 44.0% | 41.4% (+2.60)#75 | 46.1% (-2.10)#11,924 |
| 76. | 89410 | 43.7% | 41.4% (+2.30)#76 | 46.1% (-2.40)#12,081 |
| 77. | 89833 | 43.4% | 41.4% (+2.00)#77 | 46.1% (-2.70)#12,292 |
| 78. | 89019 | 43.1% | 41.4% (+1.70)#78 | 46.1% (-3.00)#12,447 |
| 79. | 89081 | 42.7% | 41.4% (+1.30)#79 | 46.1% (-3.40)#12,681 |
| 80. | 89001 | 41.9% | 41.4% (+0.500)#80 | 46.1% (-4.20)#13,204 |
| 81. | 89503 | 41.7% | 41.4% (+0.300)#81 | 46.1% (-4.40)#13,276 |
| 82. | 89408 | 41.2% | 41.4% (-0.200)#82 | 46.1% (-4.90)#13,593 |
| 83. | 89117 | 40.1% | 41.4% (-1.30)#83 | 46.1% (-6.00)#14,307 |
| 84. | 89449 | 40.0% | 41.4% (-1.40)#84 | 46.1% (-6.10)#14,416 |
| 85. | 89014 | 39.8% | 41.4% (-1.60)#85 | 46.1% (-6.30)#14,539 |
| 86. | 89501 | 39.4% | 41.4% (-2.00)#86 | 46.1% (-6.70)#14,815 |
| 87. | 89316 | 39.2% | 41.4% (-2.20)#87 | 46.1% (-6.90)#14,969 |
| 88. | 89031 | 38.8% | 41.4% (-2.60)#88 | 46.1% (-7.30)#15,200 |
| 89. | 89460 | 38.7% | 41.4% (-2.70)#89 | 46.1% (-7.40)#15,271 |
| 90. | 89018 | 38.7% | 41.4% (-2.70)#90 | 46.1% (-7.40)#15,307 |
| 91. | 89120 | 38.4% | 41.4% (-3.00)#91 | 46.1% (-7.70)#15,472 |
| 92. | 89183 | 37.6% | 41.4% (-3.80)#92 | 46.1% (-8.50)#16,034 |
| 93. | 89147 | 37.0% | 41.4% (-4.40)#93 | 46.1% (-9.10)#16,491 |
| 94. | 89040 | 36.9% | 41.4% (-4.50)#94 | 46.1% (-9.20)#16,588 |
| 95. | 89444 | 36.8% | 41.4% (-4.60)#95 | 46.1% (-9.30)#16,647 |
| 96. | 89506 | 36.5% | 41.4% (-4.90)#96 | 46.1% (-9.60)#16,814 |
| 97. | 89015 | 36.4% | 41.4% (-5.00)#97 | 46.1% (-9.70)#16,873 |
| 98. | 89032 | 36.2% | 41.4% (-5.20)#98 | 46.1% (-9.90)#17,023 |
| 99. | 89045 | 35.7% | 41.4% (-5.70)#99 | 46.1% (-10.4)#17,430 |
| 100. | 89128 | 35.4% | 41.4% (-6.00)#100 | 46.1% (-10.7)#17,596 |
1
2Common Questions
What are the Top 10 Zip Codes with the Highest Percentage of Families with Income Above $100,000 in Nevada?
Top 10 Zip Codes with the Highest Percentage of Families with Income Above $100,000 in Nevada are:
What zip code has the Highest Percentage of Families with Income Above $100,000 in Nevada?
89315 has the Highest Percentage of Families with Income Above $100,000 in Nevada with 100.0%.
What is the Percentage of Families with Income Above $100,000 in the State of Nevada?
Percentage of Families with Income Above $100,000 in Nevada is 41.4%.
What is the Percentage of Families with Income Above $100,000 in the United States?
Percentage of Families with Income Above $100,000 in the United States is 46.1%.