Smith Valley, NV Map & Demographics
Smith Valley Map
Smith Valley Overview
$40,570
PER CAPITA INCOME
$93,250
AVG FAMILY INCOME
$49,226
AVG HOUSEHOLD INCOME
11.1%
WAGE / INCOME GAP [ % ]
88.9¢/ $1
WAGE / INCOME GAP [ $ ]
$5,776
FAMILY INCOME DEFICIT
0.41
INEQUALITY / GINI INDEX
1,646
TOTAL POPULATION
841
MALE POPULATION
805
FEMALE POPULATION
104.47
MALES / 100 FEMALES
95.72
FEMALES / 100 MALES
63.2
MEDIAN AGE
2.4
AVG FAMILY SIZE
1.9
AVG HOUSEHOLD SIZE
576
LABOR FORCE [ PEOPLE ]
37.3%
PERCENT IN LABOR FORCE
1.0%
UNEMPLOYMENT RATE
Income in Smith Valley
Income Overview in Smith Valley
Per Capita Income in Smith Valley is $40,570, while median incomes of families and households are $93,250 and $49,226 respectively.
| Characteristic | Number | Measure |
| Per Capita Income | 1,646 | $40,570 |
| Median Family Income | 508 | $93,250 |
| Mean Family Income | 508 | $91,701 |
| Median Household Income | 879 | $49,226 |
| Mean Household Income | 879 | $71,977 |
| Income Deficit | 508 | $5,776 |
| Wage / Income Gap (%) | 1,646 | 11.09% |
| Wage / Income Gap ($) | 1,646 | 88.91¢ per $1 |
| Gini / Inequality Index | 1,646 | 0.41 |
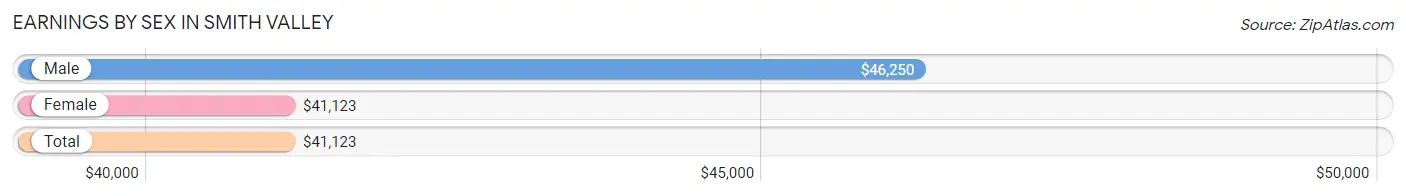
Earnings by Sex in Smith Valley
Average Earnings in Smith Valley are $41,123, $46,250 for men and $41,123 for women, a difference of 11.1%.
| Sex | Number | Average Earnings |
| Male | 264 (41.2%) | $46,250 |
| Female | 377 (58.8%) | $41,123 |
| Total | 641 (100.0%) | $41,123 |
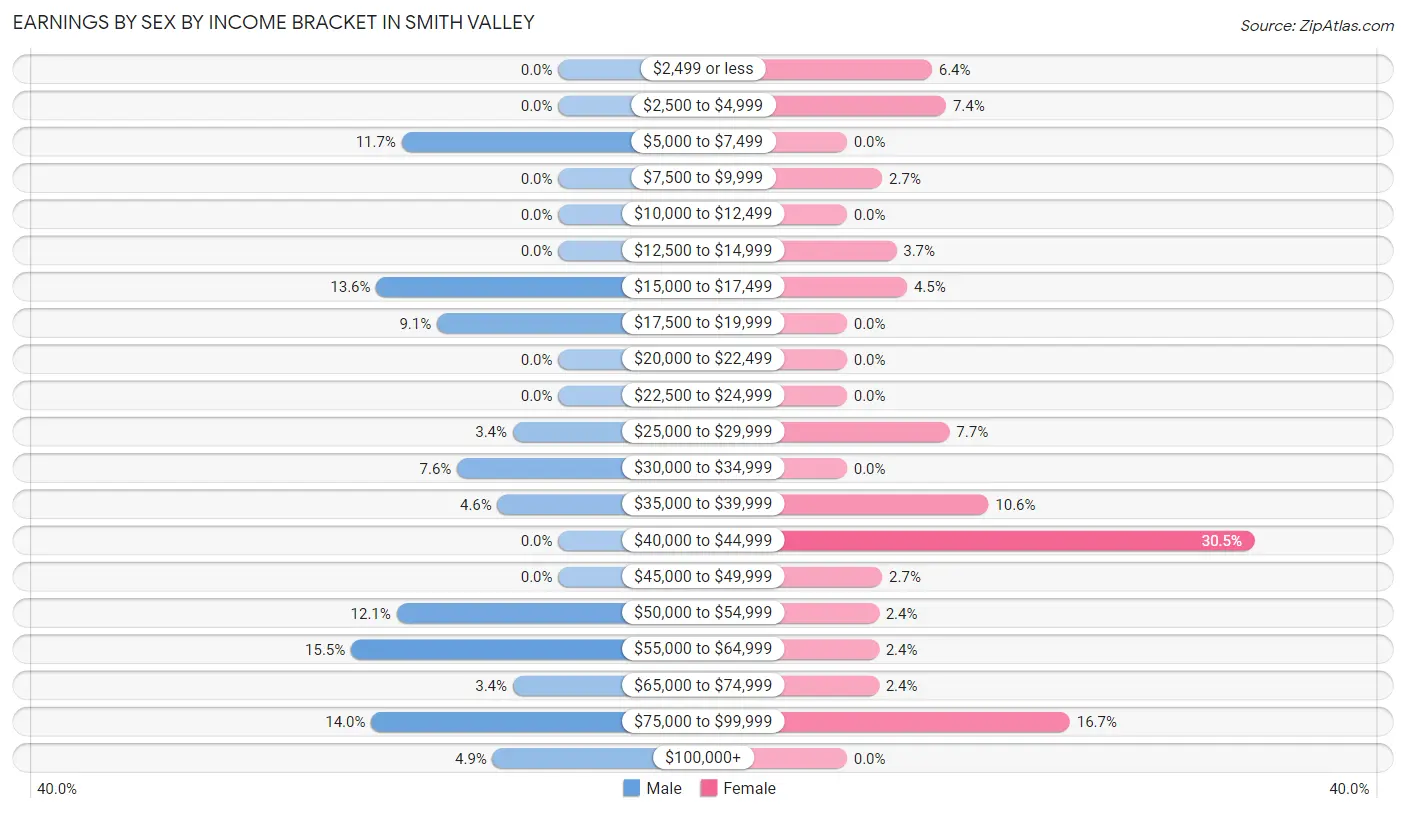
Earnings by Sex by Income Bracket in Smith Valley
The most common earnings brackets in Smith Valley are $55,000 to $64,999 for men (41 | 15.5%) and $40,000 to $44,999 for women (115 | 30.5%).
| Income | Male | Female |
| $2,499 or less | 0 (0.0%) | 24 (6.4%) |
| $2,500 to $4,999 | 0 (0.0%) | 28 (7.4%) |
| $5,000 to $7,499 | 31 (11.7%) | 0 (0.0%) |
| $7,500 to $9,999 | 0 (0.0%) | 10 (2.6%) |
| $10,000 to $12,499 | 0 (0.0%) | 0 (0.0%) |
| $12,500 to $14,999 | 0 (0.0%) | 14 (3.7%) |
| $15,000 to $17,499 | 36 (13.6%) | 17 (4.5%) |
| $17,500 to $19,999 | 24 (9.1%) | 0 (0.0%) |
| $20,000 to $22,499 | 0 (0.0%) | 0 (0.0%) |
| $22,500 to $24,999 | 0 (0.0%) | 0 (0.0%) |
| $25,000 to $29,999 | 9 (3.4%) | 29 (7.7%) |
| $30,000 to $34,999 | 20 (7.6%) | 0 (0.0%) |
| $35,000 to $39,999 | 12 (4.5%) | 40 (10.6%) |
| $40,000 to $44,999 | 0 (0.0%) | 115 (30.5%) |
| $45,000 to $49,999 | 0 (0.0%) | 10 (2.6%) |
| $50,000 to $54,999 | 32 (12.1%) | 9 (2.4%) |
| $55,000 to $64,999 | 41 (15.5%) | 9 (2.4%) |
| $65,000 to $74,999 | 9 (3.4%) | 9 (2.4%) |
| $75,000 to $99,999 | 37 (14.0%) | 63 (16.7%) |
| $100,000+ | 13 (4.9%) | 0 (0.0%) |
| Total | 264 (100.0%) | 377 (100.0%) |
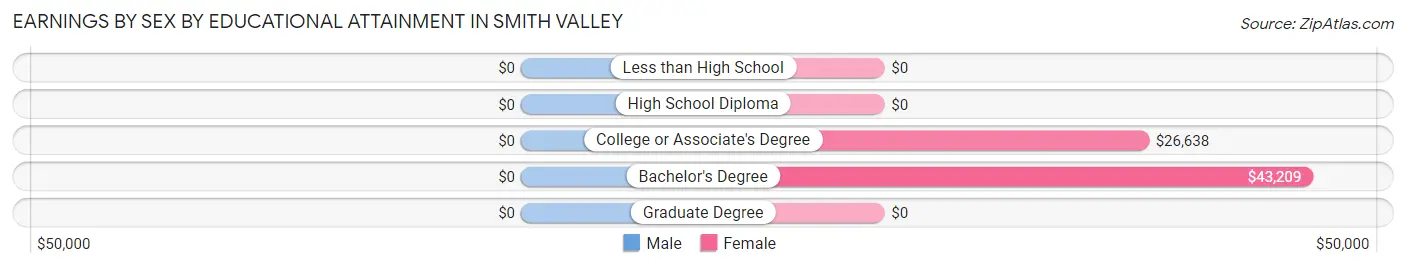
Earnings by Sex by Educational Attainment in Smith Valley
| Educational Attainment | Male Income | Female Income |
| Less than High School | - | - |
| High School Diploma | - | - |
| College or Associate's Degree | - | - |
| Bachelor's Degree | - | - |
| Graduate Degree | - | - |
| Total | $46,250 | $41,801 |
Family Income in Smith Valley
Family Income Brackets in Smith Valley
According to the Smith Valley family income data, there are 155 families falling into the $100,000 to $149,999 income range, which is the most common income bracket and makes up 30.5% of all families.
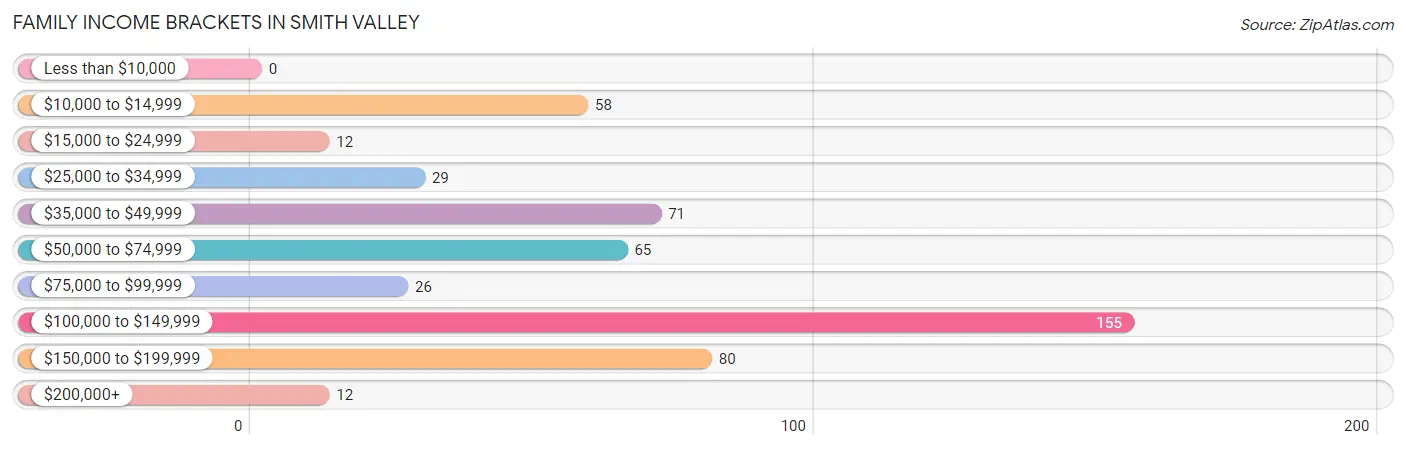
| Income Bracket | # Families | % Families |
| Less than $10,000 | 0 | 0.0% |
| $10,000 to $14,999 | 58 | 11.4% |
| $15,000 to $24,999 | 12 | 2.4% |
| $25,000 to $34,999 | 29 | 5.7% |
| $35,000 to $49,999 | 71 | 14.0% |
| $50,000 to $74,999 | 65 | 12.8% |
| $75,000 to $99,999 | 26 | 5.1% |
| $100,000 to $149,999 | 155 | 30.5% |
| $150,000 to $199,999 | 80 | 15.7% |
| $200,000+ | 12 | 2.4% |
Family Income by Famaliy Size in Smith Valley
3-person families (97 | 19.1%) account for the highest median family income in Smith Valley with $104,088 per family, while 2-person families (379 | 74.6%) have the highest median income of $36,068 per family member.
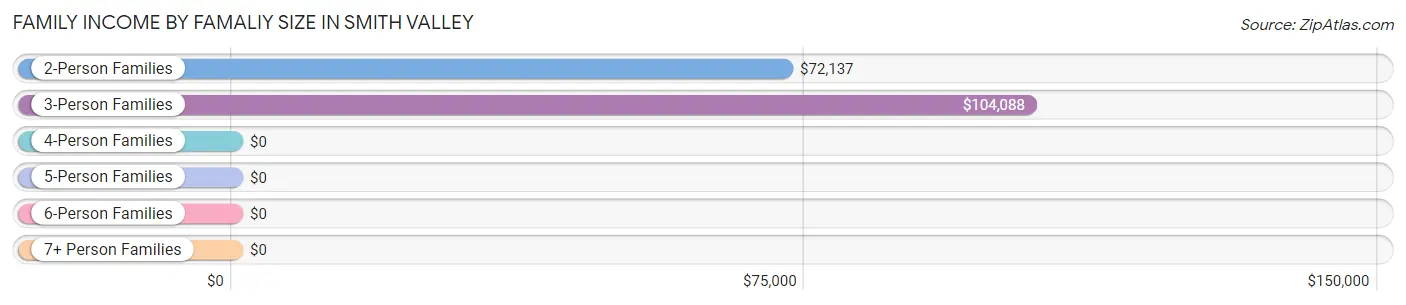
| Income Bracket | # Families | Median Income |
| 2-Person Families | 379 (74.6%) | $72,137 |
| 3-Person Families | 97 (19.1%) | $104,088 |
| 4-Person Families | 23 (4.5%) | $0 |
| 5-Person Families | 0 (0.0%) | $0 |
| 6-Person Families | 9 (1.8%) | $0 |
| 7+ Person Families | 0 (0.0%) | $0 |
| Total | 508 (100.0%) | $93,250 |
Family Income by Number of Earners in Smith Valley
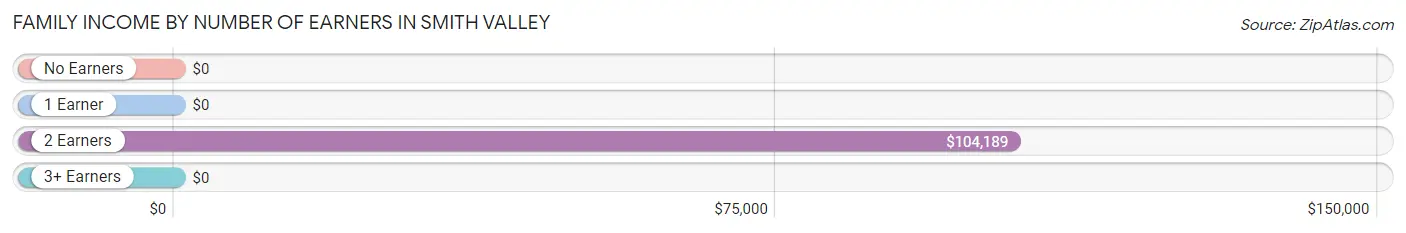
| Number of Earners | # Families | Median Income |
| No Earners | 192 (37.8%) | $0 |
| 1 Earner | 142 (28.0%) | $0 |
| 2 Earners | 152 (29.9%) | $104,189 |
| 3+ Earners | 22 (4.3%) | $0 |
| Total | 508 (100.0%) | $93,250 |
Household Income in Smith Valley
Household Income Brackets in Smith Valley
With 217 households falling in the category, the $25,000 to $34,999 income range is the most frequent in Smith Valley, accounting for 24.7% of all households. In contrast, only 12 households (1.4%) fall into the $200,000+ income bracket, making it the least populous group.
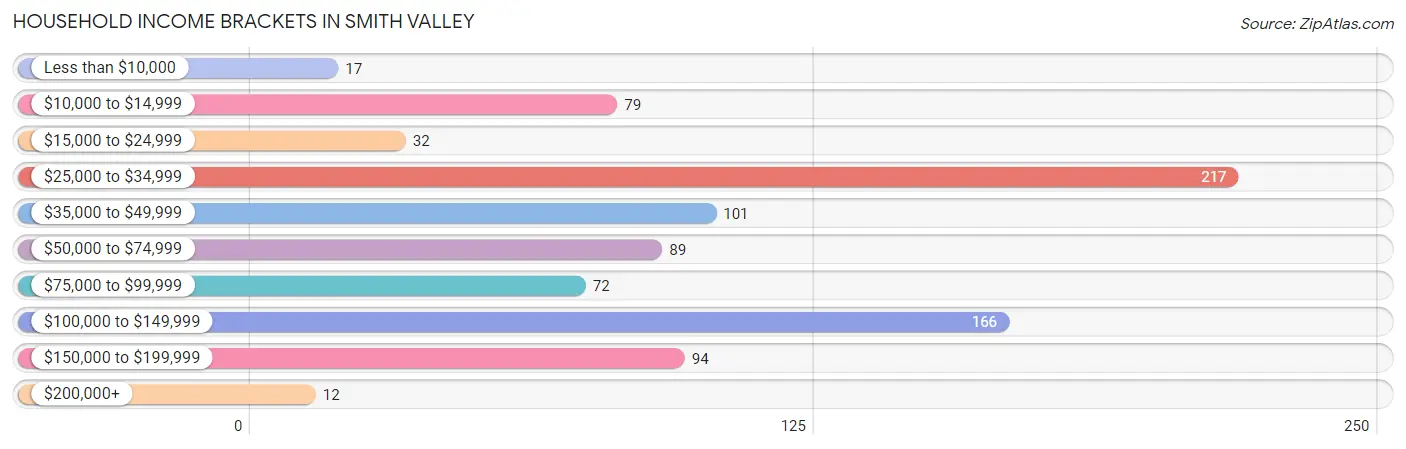
| Income Bracket | # Households | % Households |
| Less than $10,000 | 17 | 1.9% |
| $10,000 to $14,999 | 79 | 9.0% |
| $15,000 to $24,999 | 32 | 3.6% |
| $25,000 to $34,999 | 217 | 24.7% |
| $35,000 to $49,999 | 101 | 11.5% |
| $50,000 to $74,999 | 89 | 10.1% |
| $75,000 to $99,999 | 72 | 8.2% |
| $100,000 to $149,999 | 166 | 18.9% |
| $150,000 to $199,999 | 94 | 10.7% |
| $200,000+ | 12 | 1.4% |
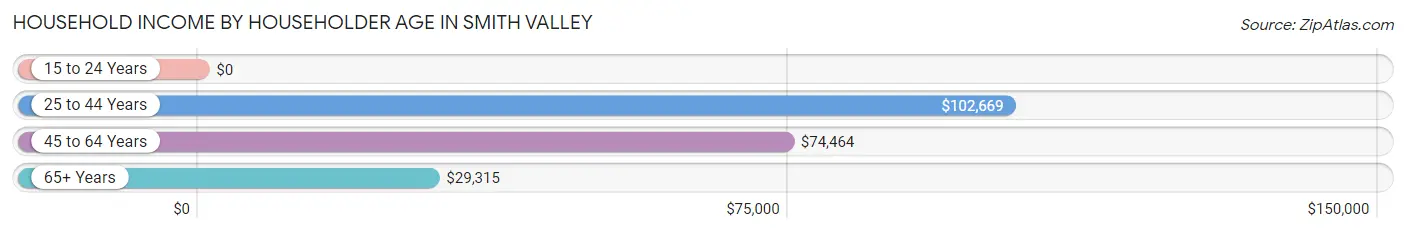
Household Income by Householder Age in Smith Valley
The median household income in Smith Valley is $49,226, with the highest median household income of $102,669 found in the 25 to 44 years age bracket for the primary householder. A total of 69 households (7.9%) fall into this category.
| Income Bracket | # Households | Median Income |
| 15 to 24 Years | 0 (0.0%) | $0 |
| 25 to 44 Years | 69 (7.9%) | $102,669 |
| 45 to 64 Years | 307 (34.9%) | $74,464 |
| 65+ Years | 503 (57.2%) | $29,315 |
| Total | 879 (100.0%) | $49,226 |
Poverty in Smith Valley
Income Below Poverty by Sex and Age in Smith Valley
With 17.5% poverty level for males and 6.2% for females among the residents of Smith Valley, 6 to 11 year old males and 45 to 54 year old females are the most vulnerable to poverty, with 18 males (60.0%) and 12 females (20.7%) in their respective age groups living below the poverty level.
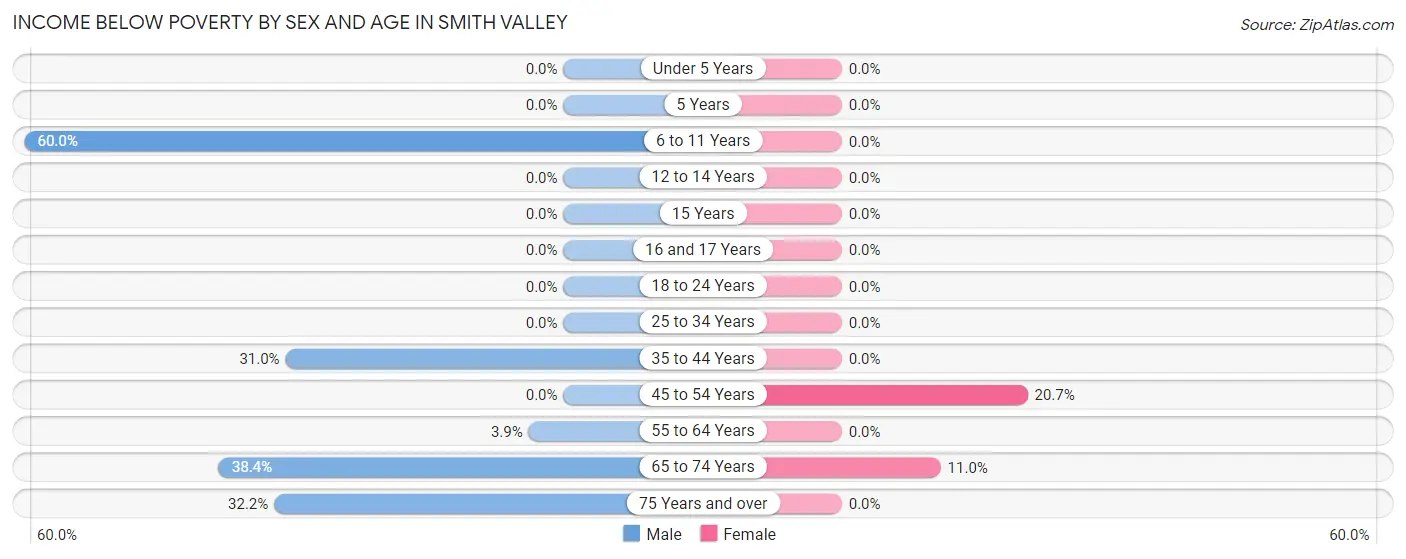
| Age Bracket | Male | Female |
| Under 5 Years | 0 (0.0%) | 0 (0.0%) |
| 5 Years | 0 (0.0%) | 0 (0.0%) |
| 6 to 11 Years | 18 (60.0%) | 0 (0.0%) |
| 12 to 14 Years | 0 (0.0%) | 0 (0.0%) |
| 15 Years | 0 (0.0%) | 0 (0.0%) |
| 16 and 17 Years | 0 (0.0%) | 0 (0.0%) |
| 18 to 24 Years | 0 (0.0%) | 0 (0.0%) |
| 25 to 34 Years | 0 (0.0%) | 0 (0.0%) |
| 35 to 44 Years | 13 (30.9%) | 0 (0.0%) |
| 45 to 54 Years | 0 (0.0%) | 12 (20.7%) |
| 55 to 64 Years | 12 (3.9%) | 0 (0.0%) |
| 65 to 74 Years | 56 (38.4%) | 38 (11.0%) |
| 75 Years and over | 48 (32.2%) | 0 (0.0%) |
| Total | 147 (17.5%) | 50 (6.2%) |
Income Above Poverty by Sex and Age in Smith Valley
According to the poverty statistics in Smith Valley, males aged under 5 years and females aged 6 to 11 years are the age groups that are most secure financially, with 100.0% of males and 100.0% of females in these age groups living above the poverty line.
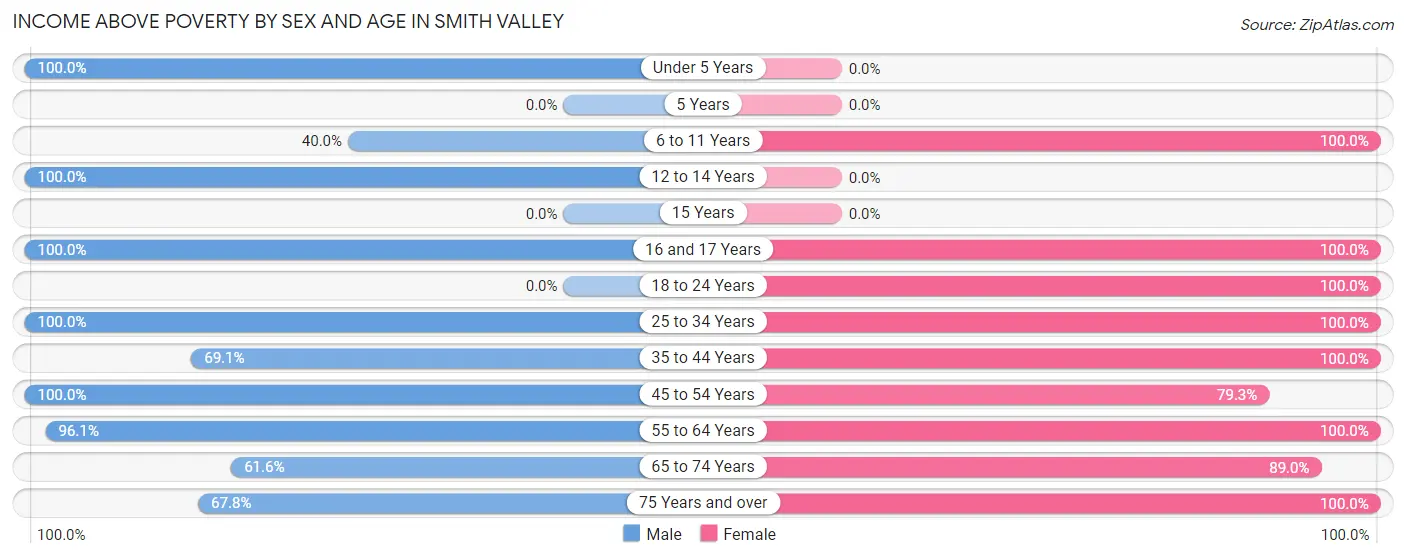
| Age Bracket | Male | Female |
| Under 5 Years | 45 (100.0%) | 0 (0.0%) |
| 5 Years | 0 (0.0%) | 0 (0.0%) |
| 6 to 11 Years | 12 (40.0%) | 9 (100.0%) |
| 12 to 14 Years | 19 (100.0%) | 0 (0.0%) |
| 15 Years | 0 (0.0%) | 0 (0.0%) |
| 16 and 17 Years | 7 (100.0%) | 13 (100.0%) |
| 18 to 24 Years | 0 (0.0%) | 19 (100.0%) |
| 25 to 34 Years | 61 (100.0%) | 68 (100.0%) |
| 35 to 44 Years | 29 (69.1%) | 38 (100.0%) |
| 45 to 54 Years | 33 (100.0%) | 46 (79.3%) |
| 55 to 64 Years | 297 (96.1%) | 157 (100.0%) |
| 65 to 74 Years | 90 (61.6%) | 307 (89.0%) |
| 75 Years and over | 101 (67.8%) | 98 (100.0%) |
| Total | 694 (82.5%) | 755 (93.8%) |
Income Below Poverty Among Married-Couple Families in Smith Valley
The poverty statistics for married-couple families in Smith Valley show that 14.3% or 70 of the total 489 families live below the poverty line. Families with no children have the highest poverty rate of 14.5%, comprising of 58 families. On the other hand, families with 1 or 2 children have the lowest poverty rate of 13.3%, which includes 12 families.
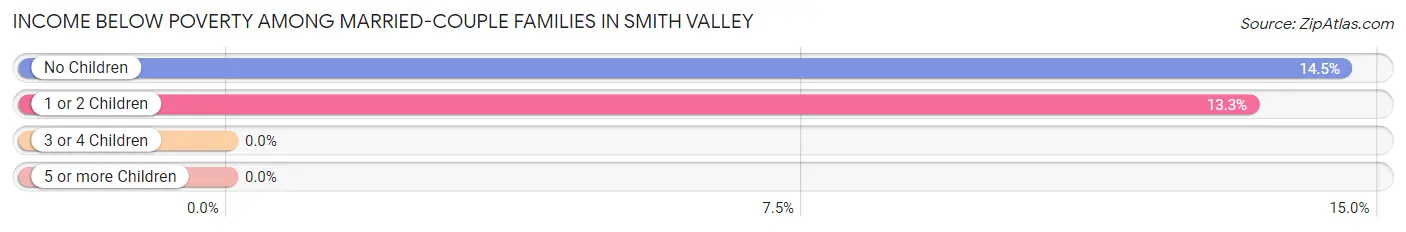
| Children | Above Poverty | Below Poverty |
| No Children | 341 (85.5%) | 58 (14.5%) |
| 1 or 2 Children | 78 (86.7%) | 12 (13.3%) |
| 3 or 4 Children | 0 (0.0%) | 0 (0.0%) |
| 5 or more Children | 0 (0.0%) | 0 (0.0%) |
| Total | 419 (85.7%) | 70 (14.3%) |
Income Below Poverty Among Single-Parent Households in Smith Valley
| Children | Single Father | Single Mother |
| No Children | 0 (0.0%) | 0 (0.0%) |
| 1 or 2 Children | 0 (0.0%) | 0 (0.0%) |
| 3 or 4 Children | 0 (0.0%) | 0 (0.0%) |
| 5 or more Children | 0 (0.0%) | 0 (0.0%) |
| Total | 0 (0.0%) | 0 (0.0%) |
Income Below Poverty Among Married-Couple vs Single-Parent Households in Smith Valley
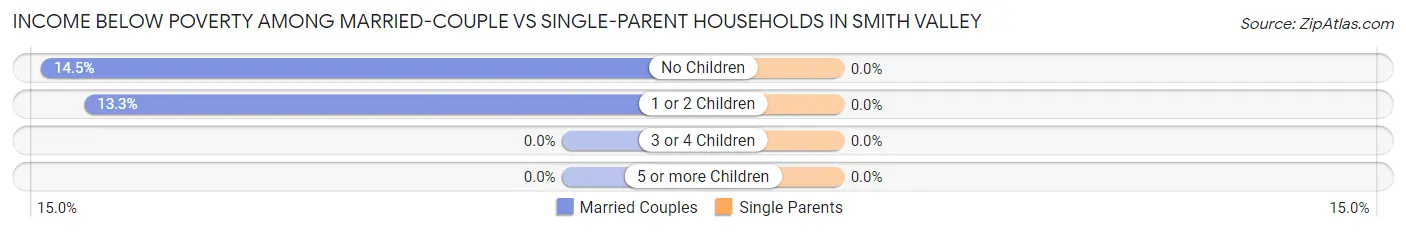
| Children | Married-Couple Families | Single-Parent Households |
| No Children | 58 (14.5%) | 0 (0.0%) |
| 1 or 2 Children | 12 (13.3%) | 0 (0.0%) |
| 3 or 4 Children | 0 (0.0%) | 0 (0.0%) |
| 5 or more Children | 0 (0.0%) | 0 (0.0%) |
| Total | 70 (14.3%) | 0 (0.0%) |
Race in Smith Valley
The most populous races in Smith Valley are White / Caucasian (1,393 | 84.6%), Two or more Races (216 | 13.1%), and Hispanic or Latino (186 | 11.3%).
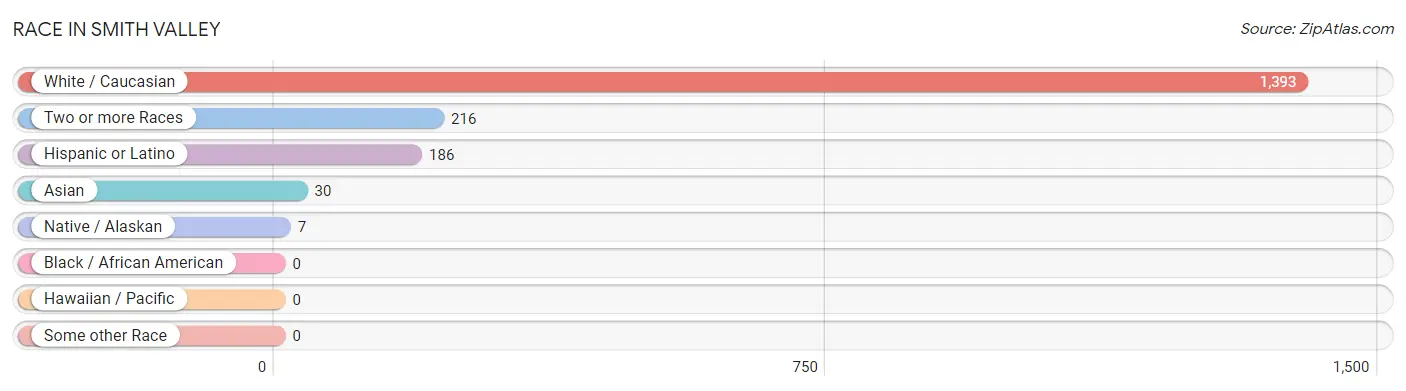
| Race | # Population | % Population |
| Asian | 30 | 1.8% |
| Black / African American | 0 | 0.0% |
| Hawaiian / Pacific | 0 | 0.0% |
| Hispanic or Latino | 186 | 11.3% |
| Native / Alaskan | 7 | 0.4% |
| White / Caucasian | 1,393 | 84.6% |
| Two or more Races | 216 | 13.1% |
| Some other Race | 0 | 0.0% |
| Total | 1,646 | 100.0% |
Ancestry in Smith Valley
The most populous ancestries reported in Smith Valley are German (560 | 34.0%), American (216 | 13.1%), Mexican (186 | 11.3%), English (125 | 7.6%), and Italian (125 | 7.6%), together accounting for 73.6% of all Smith Valley residents.
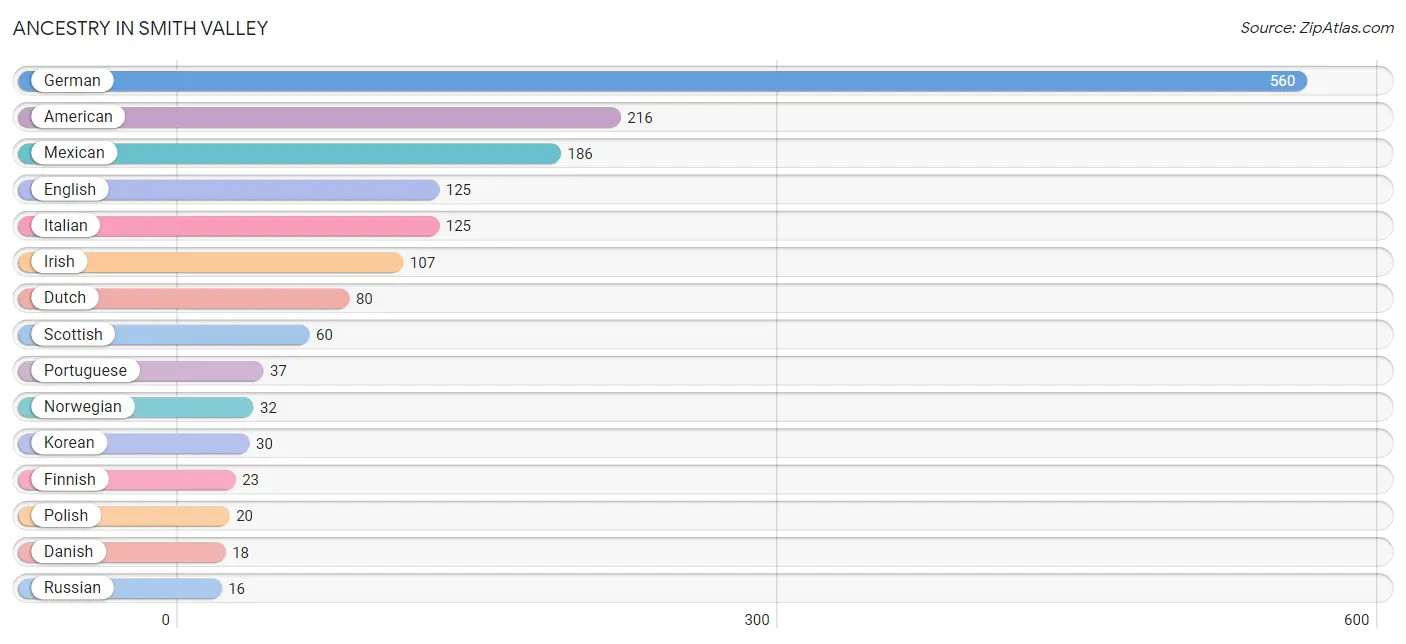
| Ancestry | # Population | % Population |
| American | 216 | 13.1% |
| British | 14 | 0.9% |
| Danish | 18 | 1.1% |
| Dutch | 80 | 4.9% |
| English | 125 | 7.6% |
| European | 10 | 0.6% |
| Finnish | 23 | 1.4% |
| French | 15 | 0.9% |
| German | 560 | 34.0% |
| Irish | 107 | 6.5% |
| Italian | 125 | 7.6% |
| Korean | 30 | 1.8% |
| Mexican | 186 | 11.3% |
| Norwegian | 32 | 1.9% |
| Polish | 20 | 1.2% |
| Portuguese | 37 | 2.2% |
| Russian | 16 | 1.0% |
| Scandinavian | 11 | 0.7% |
| Scotch-Irish | 9 | 0.5% |
| Scottish | 60 | 3.6% |
| Slavic | 7 | 0.4% |
| Swedish | 12 | 0.7% | View All 22 Rows |
Immigrants in Smith Valley
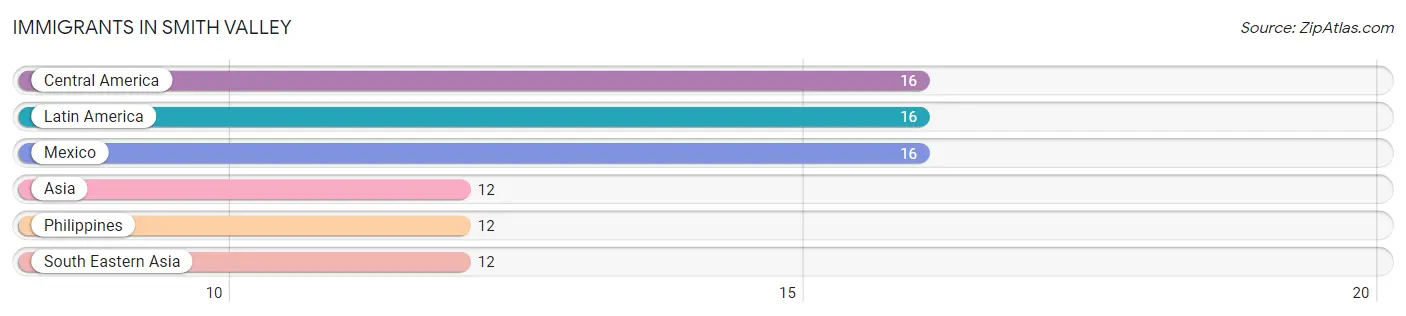
The most numerous immigrant groups reported in Smith Valley came from Central America (16 | 1.0%), Latin America (16 | 1.0%), Mexico (16 | 1.0%), Asia (12 | 0.7%), and Philippines (12 | 0.7%), together accounting for 4.4% of all Smith Valley residents.
| Immigration Origin | # Population | % Population |
| Asia | 12 | 0.7% |
| Central America | 16 | 1.0% |
| Latin America | 16 | 1.0% |
| Mexico | 16 | 1.0% |
| Philippines | 12 | 0.7% |
| South Eastern Asia | 12 | 0.7% | View All 6 Rows |
Sex and Age in Smith Valley
Sex and Age in Smith Valley
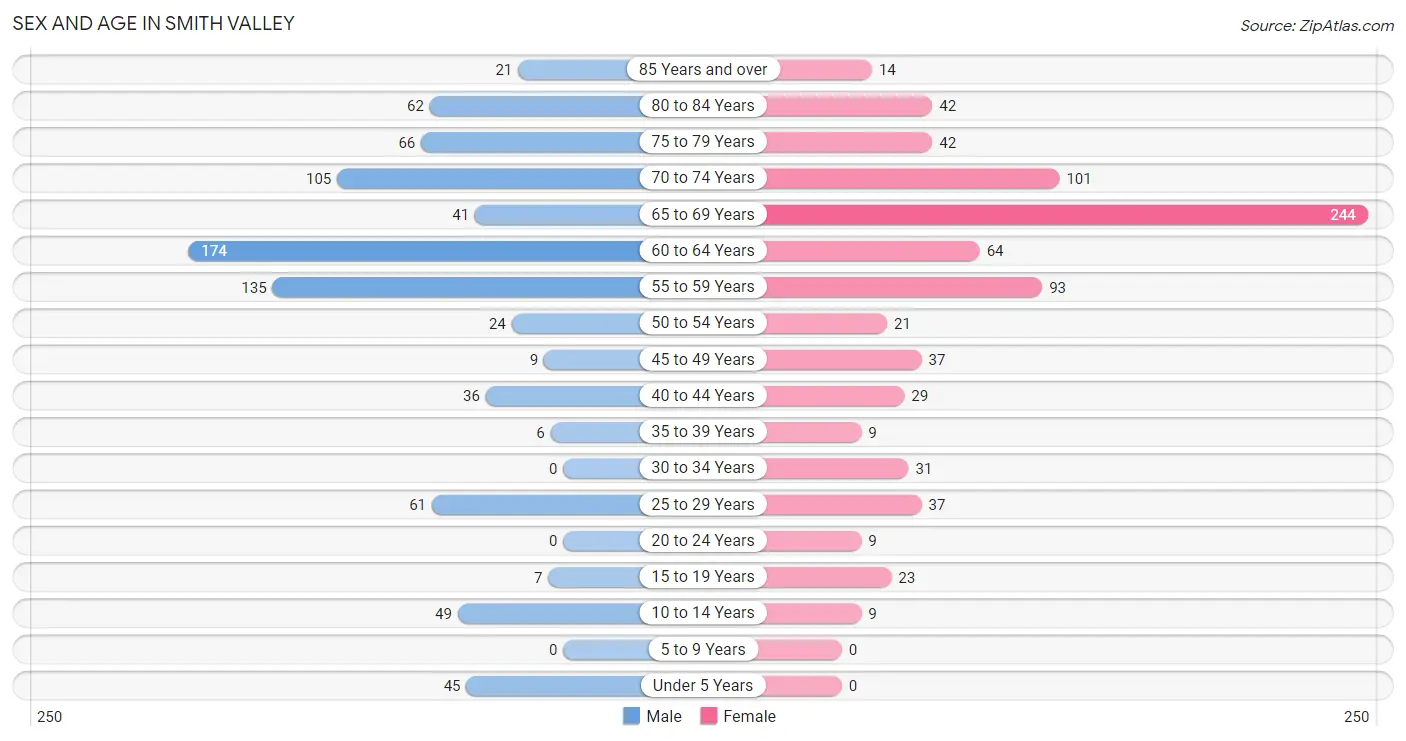
The most populous age groups in Smith Valley are 60 to 64 Years (174 | 20.7%) for men and 65 to 69 Years (244 | 30.3%) for women.
| Age Bracket | Male | Female |
| Under 5 Years | 45 (5.3%) | 0 (0.0%) |
| 5 to 9 Years | 0 (0.0%) | 0 (0.0%) |
| 10 to 14 Years | 49 (5.8%) | 9 (1.1%) |
| 15 to 19 Years | 7 (0.8%) | 23 (2.9%) |
| 20 to 24 Years | 0 (0.0%) | 9 (1.1%) |
| 25 to 29 Years | 61 (7.2%) | 37 (4.6%) |
| 30 to 34 Years | 0 (0.0%) | 31 (3.8%) |
| 35 to 39 Years | 6 (0.7%) | 9 (1.1%) |
| 40 to 44 Years | 36 (4.3%) | 29 (3.6%) |
| 45 to 49 Years | 9 (1.1%) | 37 (4.6%) |
| 50 to 54 Years | 24 (2.9%) | 21 (2.6%) |
| 55 to 59 Years | 135 (16.1%) | 93 (11.6%) |
| 60 to 64 Years | 174 (20.7%) | 64 (8.0%) |
| 65 to 69 Years | 41 (4.9%) | 244 (30.3%) |
| 70 to 74 Years | 105 (12.5%) | 101 (12.6%) |
| 75 to 79 Years | 66 (7.9%) | 42 (5.2%) |
| 80 to 84 Years | 62 (7.4%) | 42 (5.2%) |
| 85 Years and over | 21 (2.5%) | 14 (1.7%) |
| Total | 841 (100.0%) | 805 (100.0%) |
Families and Households in Smith Valley
Median Family Size in Smith Valley
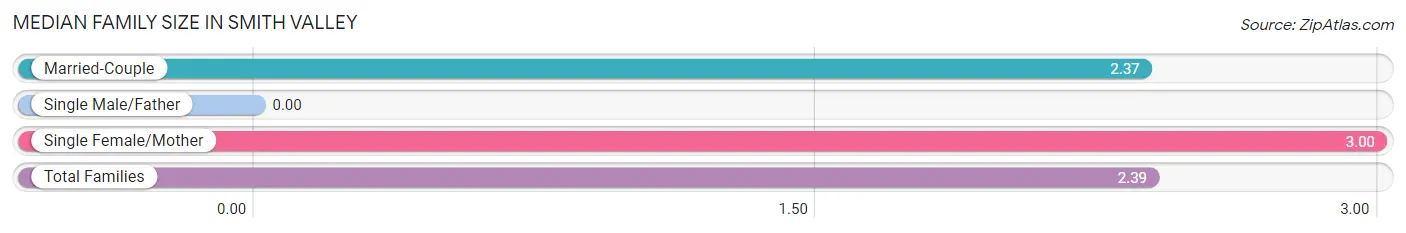
| Family Type | # Families | Family Size |
| Married-Couple | 489 (96.3%) | 2.37 |
| Single Male/Father | 0 (0.0%) | - |
| Single Female/Mother | 19 (3.7%) | 3.00 |
| Total Families | 508 (100.0%) | 2.39 |
Median Household Size in Smith Valley
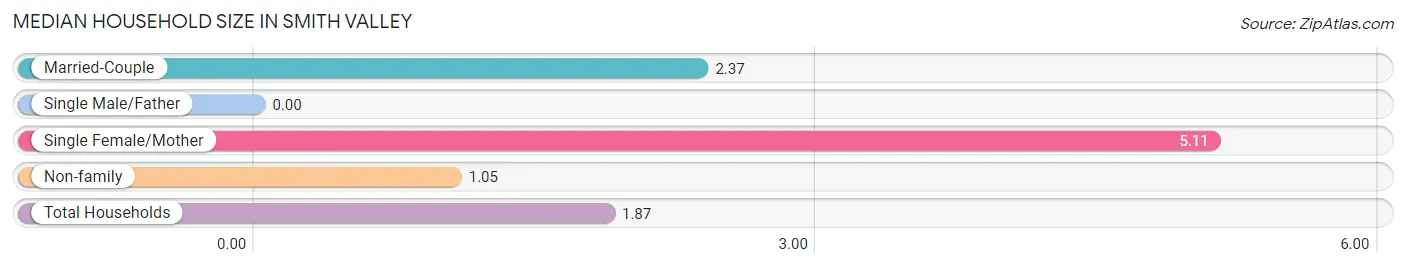
| Household Type | # Households | Household Size |
| Married-Couple | 489 (55.6%) | 2.37 |
| Single Male/Father | 0 (0.0%) | - |
| Single Female/Mother | 19 (2.2%) | 5.11 |
| Non-family | 371 (42.2%) | 1.05 |
| Total Households | 879 (100.0%) | 1.87 |
Household Size by Marriage Status in Smith Valley
Out of a total of 879 households in Smith Valley, 508 (57.8%) are family households, while 371 (42.2%) are nonfamily households. The most numerous type of family households are 2-person households, comprising 360, and the most common type of nonfamily households are 1-person households, comprising 358.
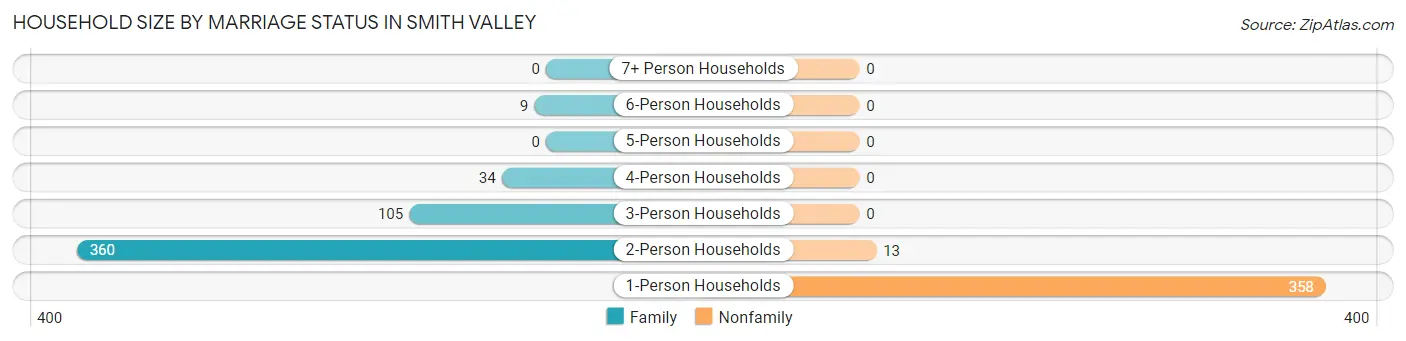
| Household Size | Family Households | Nonfamily Households |
| 1-Person Households | - | 358 (40.7%) |
| 2-Person Households | 360 (41.0%) | 13 (1.5%) |
| 3-Person Households | 105 (11.9%) | 0 (0.0%) |
| 4-Person Households | 34 (3.9%) | 0 (0.0%) |
| 5-Person Households | 0 (0.0%) | 0 (0.0%) |
| 6-Person Households | 9 (1.0%) | 0 (0.0%) |
| 7+ Person Households | 0 (0.0%) | 0 (0.0%) |
| Total | 508 (57.8%) | 371 (42.2%) |
Female Fertility in Smith Valley
Fertility by Age in Smith Valley
Average fertility rate in Smith Valley is 263.0 births per 1,000 women. Women in the age bracket of 20 to 34 years have the highest fertility rate with 597.0 births per 1,000 women. Women in the age bracket of 20 to 34 years acount for 100.0% of all women with births.
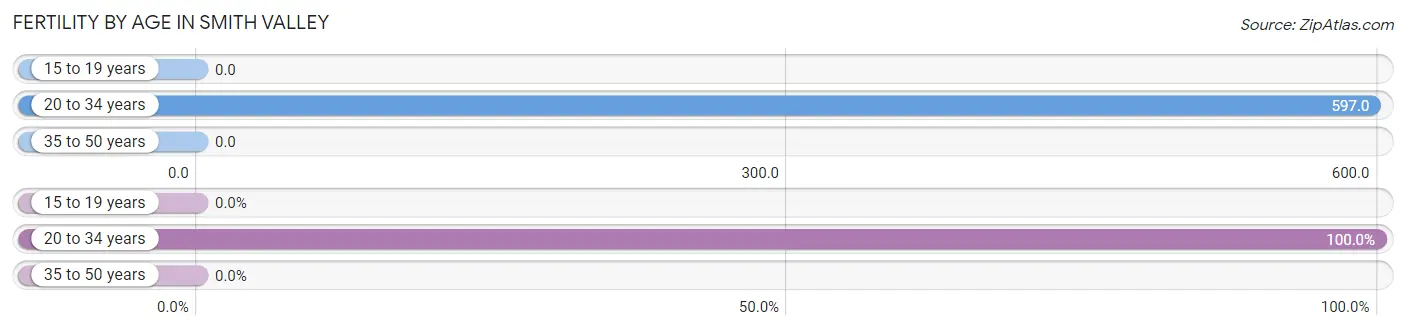
| Age Bracket | Women with Births | Births / 1,000 Women |
| 15 to 19 years | 0 (0.0%) | 0.0 |
| 20 to 34 years | 46 (100.0%) | 597.0 |
| 35 to 50 years | 0 (0.0%) | 0.0 |
| Total | 46 (100.0%) | 263.0 |
Fertility by Age by Marriage Status in Smith Valley
80.4% of women with births (46) in Smith Valley are married. The highest percentage of unmarried women with births falls into 20 to 34 years age bracket with 19.6% of them unmarried at the time of birth, while the lowest percentage of unmarried women with births belong to 20 to 34 years age bracket with 19.6% of them unmarried.
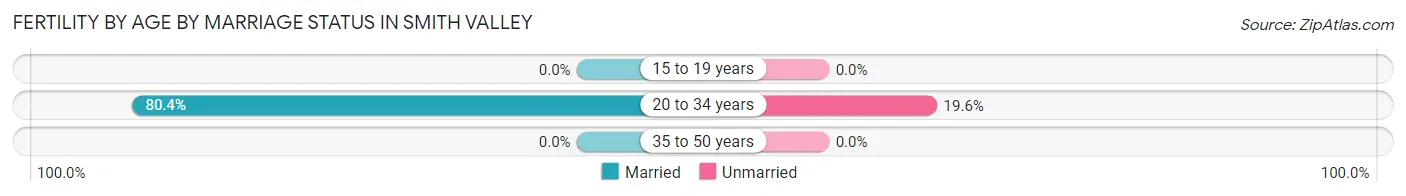
| Age Bracket | Married | Unmarried |
| 15 to 19 years | 0 (0.0%) | 0 (0.0%) |
| 20 to 34 years | 37 (80.4%) | 9 (19.6%) |
| 35 to 50 years | 0 (0.0%) | 0 (0.0%) |
| Total | 37 (80.4%) | 9 (19.6%) |
Fertility by Education in Smith Valley
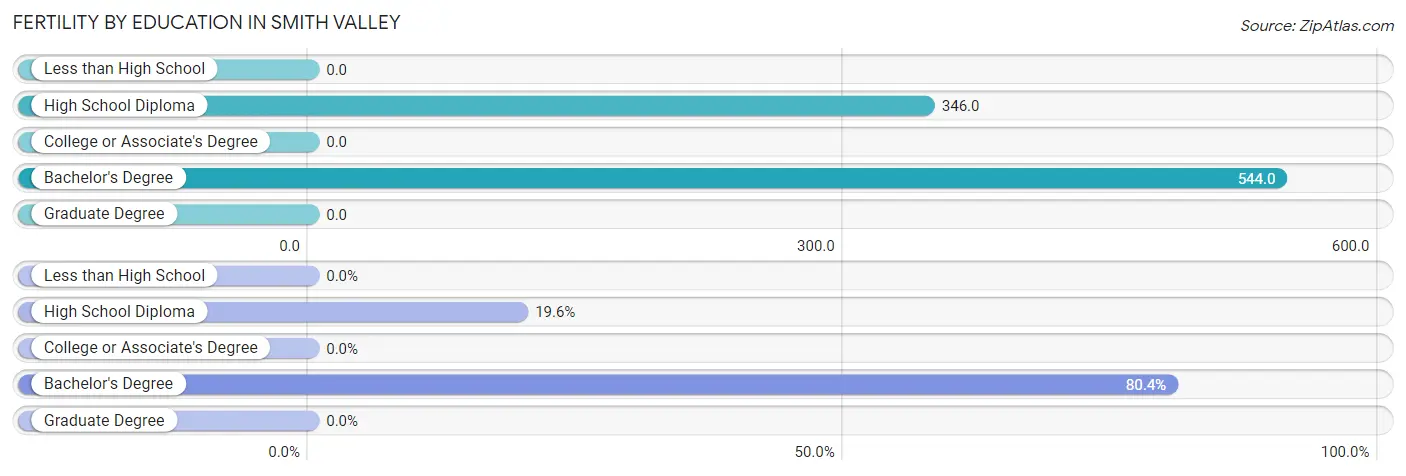
| Educational Attainment | Women with Births | Births / 1,000 Women |
| Less than High School | 0 (0.0%) | 0.0 |
| High School Diploma | 9 (19.6%) | 346.0 |
| College or Associate's Degree | 0 (0.0%) | 0.0 |
| Bachelor's Degree | 37 (80.4%) | 544.0 |
| Graduate Degree | 0 (0.0%) | 0.0 |
| Total | 46 (100.0%) | 263.0 |
Fertility by Education by Marriage Status in Smith Valley
19.6% of women with births in Smith Valley are unmarried. Women with the educational attainment of bachelor's degree are most likely to be married with 100.0% of them married at childbirth, while women with the educational attainment of high school diploma are least likely to be married with 100.0% of them unmarried at childbirth.
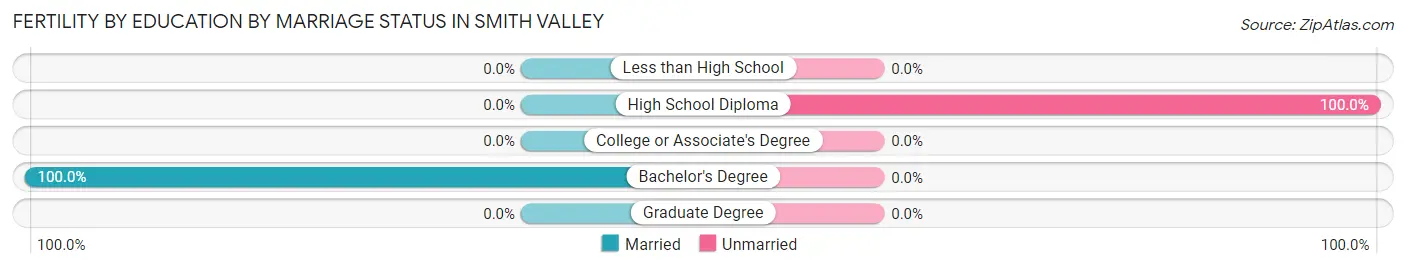
| Educational Attainment | Married | Unmarried |
| Less than High School | 0 (0.0%) | 0 (0.0%) |
| High School Diploma | 0 (0.0%) | 9 (100.0%) |
| College or Associate's Degree | 0 (0.0%) | 0 (0.0%) |
| Bachelor's Degree | 37 (100.0%) | 0 (0.0%) |
| Graduate Degree | 0 (0.0%) | 0 (0.0%) |
| Total | 37 (80.4%) | 9 (19.6%) |
Employment Characteristics in Smith Valley
Employment by Class of Employer in Smith Valley
Among the 560 employed individuals in Smith Valley, private company employees (299 | 53.4%), self-employed (incorporated) (102 | 18.2%), and self-employed (not incorporated) (60 | 10.7%) make up the most common classes of employment.
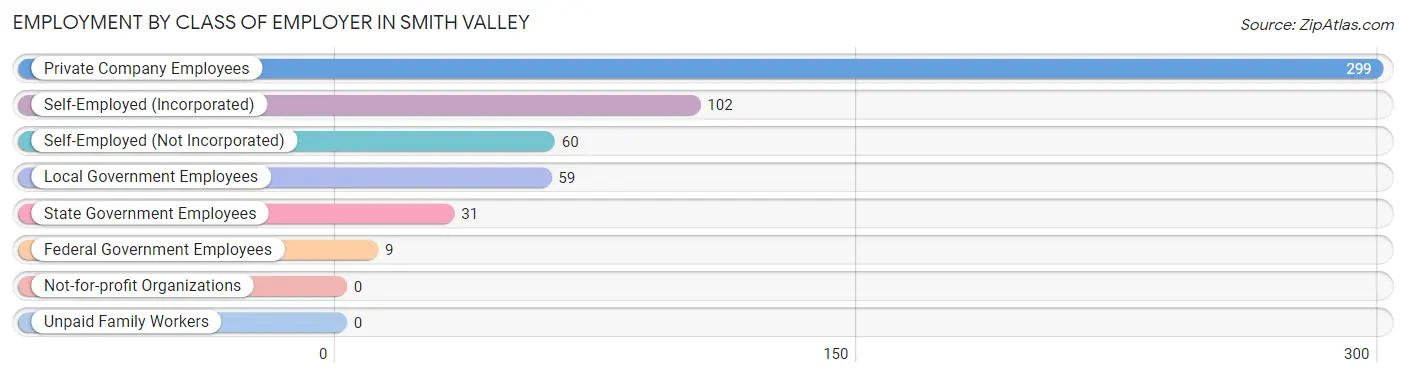
| Employer Class | # Employees | % Employees |
| Private Company Employees | 299 | 53.4% |
| Self-Employed (Incorporated) | 102 | 18.2% |
| Self-Employed (Not Incorporated) | 60 | 10.7% |
| Not-for-profit Organizations | 0 | 0.0% |
| Local Government Employees | 59 | 10.5% |
| State Government Employees | 31 | 5.5% |
| Federal Government Employees | 9 | 1.6% |
| Unpaid Family Workers | 0 | 0.0% |
| Total | 560 | 100.0% |
Employment Status by Age in Smith Valley
According to the labor force statistics for Smith Valley, out of the total population over 16 years of age (1,543), 37.3% or 576 individuals are in the labor force, with 1.0% or 6 of them unemployed. The age group with the highest labor force participation rate is 20 to 24 years, with 100.0% or 9 individuals in the labor force. Within the labor force, the 35 to 44 years age range has the highest percentage of unemployed individuals, with 12.5% or 6 of them being unemployed.
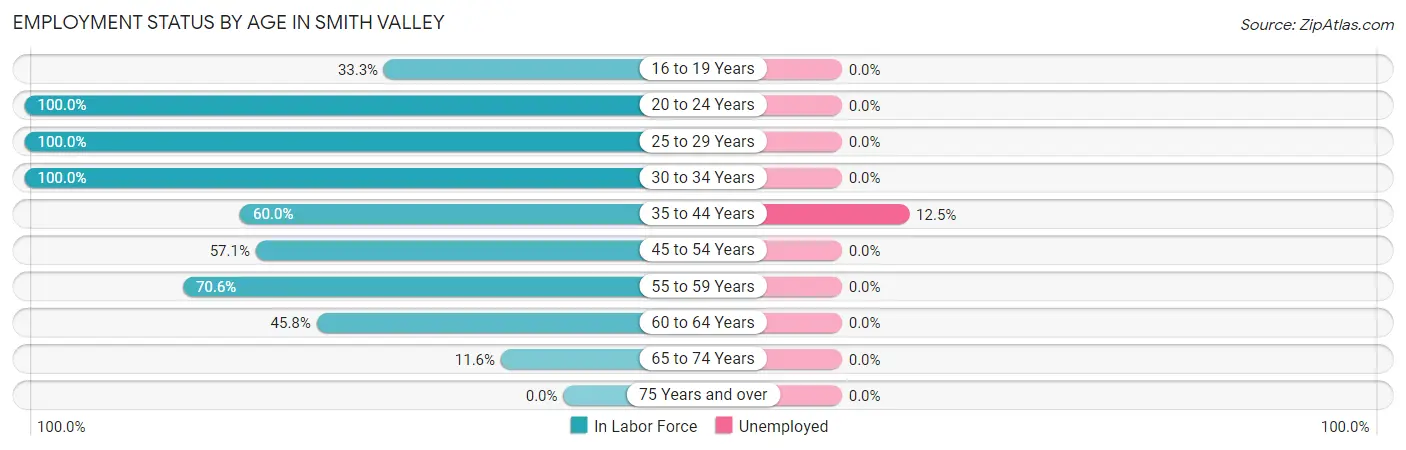
| Age Bracket | In Labor Force | Unemployed |
| 16 to 19 Years | 10 (33.3%) | 0 (0.0%) |
| 20 to 24 Years | 9 (100.0%) | 0 (0.0%) |
| 25 to 29 Years | 98 (100.0%) | 0 (0.0%) |
| 30 to 34 Years | 31 (100.0%) | 0 (0.0%) |
| 35 to 44 Years | 48 (60.0%) | 6 (12.5%) |
| 45 to 54 Years | 52 (57.1%) | 0 (0.0%) |
| 55 to 59 Years | 161 (70.6%) | 0 (0.0%) |
| 60 to 64 Years | 109 (45.8%) | 0 (0.0%) |
| 65 to 74 Years | 57 (11.6%) | 0 (0.0%) |
| 75 Years and over | 0 (0.0%) | 0 (0.0%) |
| Total | 576 (37.3%) | 6 (1.0%) |
Employment Status by Educational Attainment in Smith Valley
According to labor force statistics for Smith Valley, 65.1% of individuals (499) out of the total population between 25 and 64 years of age (766) are in the labor force, with 1.2% or 6 of them being unemployed. The group with the highest labor force participation rate are those with the educational attainment of bachelor's degree or higher, with 78.1% or 143 individuals in the labor force. Within the labor force, individuals with college / associate degree education have the highest percentage of unemployment, with 3.7% or 6 of them being unemployed.
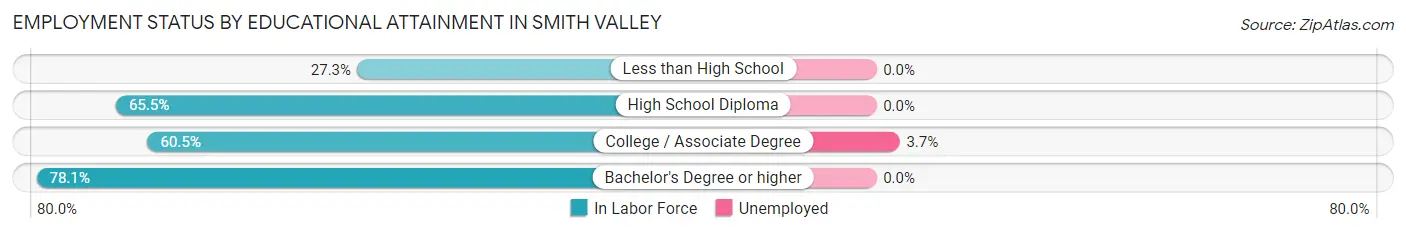
| Educational Attainment | In Labor Force | Unemployed |
| Less than High School | 9 (27.3%) | 0 (0.0%) |
| High School Diploma | 186 (65.5%) | 0 (0.0%) |
| College / Associate Degree | 161 (60.5%) | 10 (3.7%) |
| Bachelor's Degree or higher | 143 (78.1%) | 0 (0.0%) |
| Total | 499 (65.1%) | 9 (1.2%) |
Employment Occupations by Sex in Smith Valley
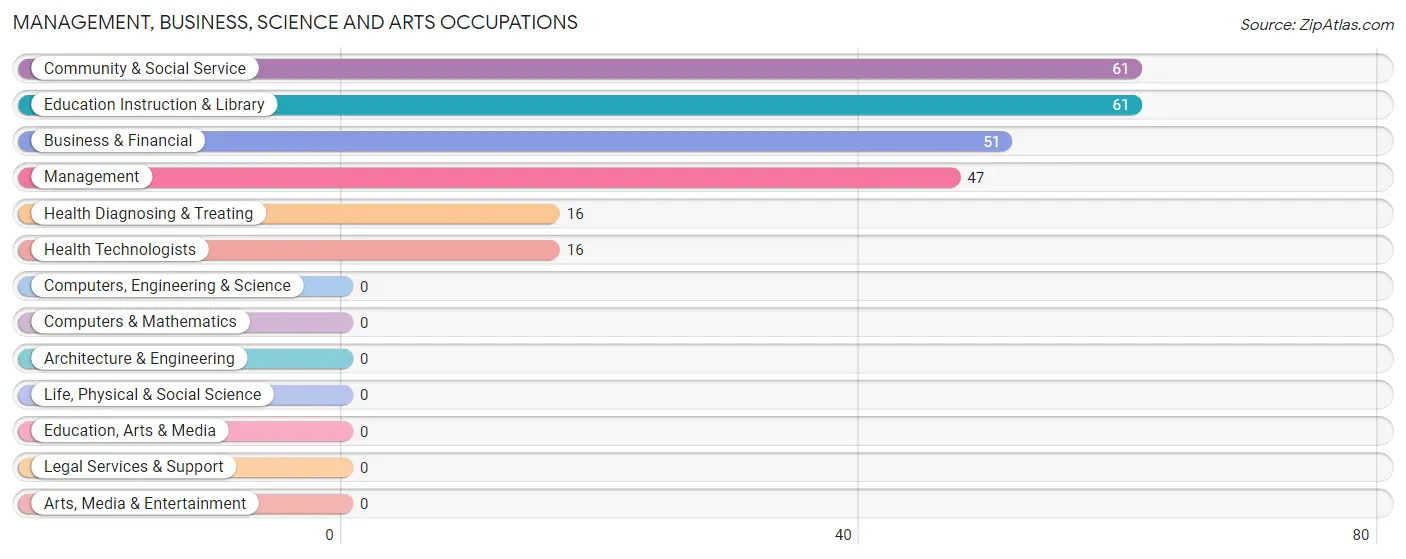
Management, Business, Science and Arts Occupations
The most common Management, Business, Science and Arts occupations in Smith Valley are Community & Social Service (61 | 10.7%), Education Instruction & Library (61 | 10.7%), Business & Financial (51 | 9.0%), Management (47 | 8.3%), and Health Diagnosing & Treating (16 | 2.8%).
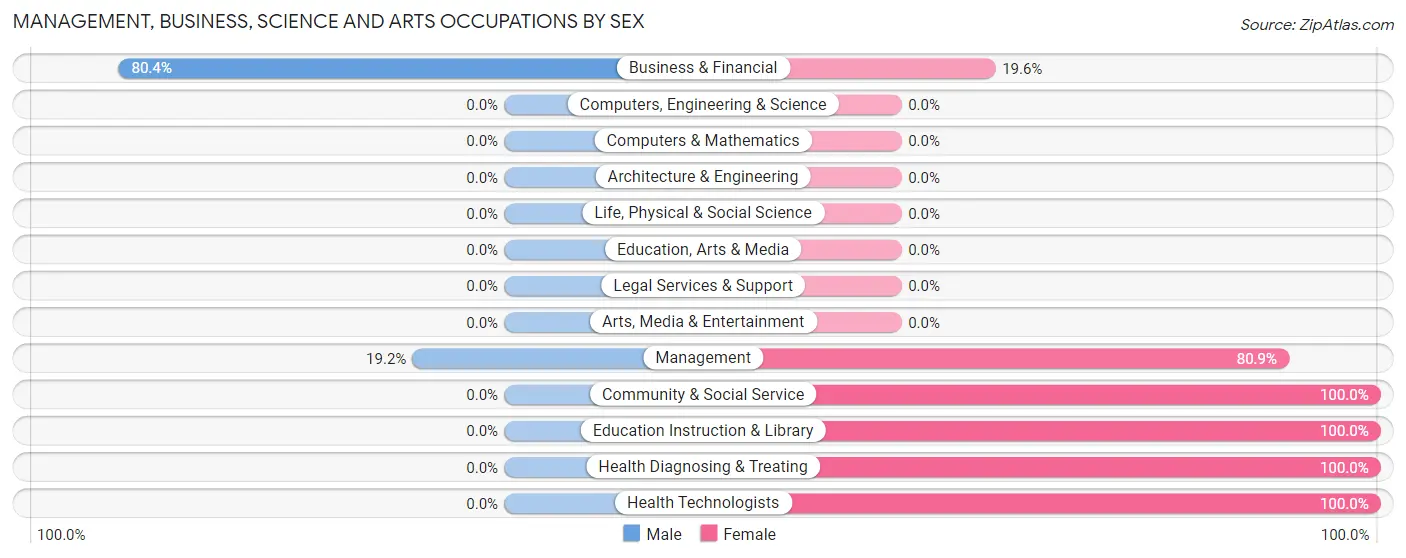
Management, Business, Science and Arts Occupations by Sex
Within the Management, Business, Science and Arts occupations in Smith Valley, the most male-oriented occupations are Business & Financial (80.4%), and Management (19.2%), while the most female-oriented occupations are Community & Social Service (100.0%), Education Instruction & Library (100.0%), and Health Diagnosing & Treating (100.0%).
| Occupation | Male | Female |
| Management | 9 (19.2%) | 38 (80.8%) |
| Business & Financial | 41 (80.4%) | 10 (19.6%) |
| Computers, Engineering & Science | 0 (0.0%) | 0 (0.0%) |
| Computers & Mathematics | 0 (0.0%) | 0 (0.0%) |
| Architecture & Engineering | 0 (0.0%) | 0 (0.0%) |
| Life, Physical & Social Science | 0 (0.0%) | 0 (0.0%) |
| Community & Social Service | 0 (0.0%) | 61 (100.0%) |
| Education, Arts & Media | 0 (0.0%) | 0 (0.0%) |
| Legal Services & Support | 0 (0.0%) | 0 (0.0%) |
| Education Instruction & Library | 0 (0.0%) | 61 (100.0%) |
| Arts, Media & Entertainment | 0 (0.0%) | 0 (0.0%) |
| Health Diagnosing & Treating | 0 (0.0%) | 16 (100.0%) |
| Health Technologists | 0 (0.0%) | 16 (100.0%) |
| Total (Category) | 50 (28.6%) | 125 (71.4%) |
| Total (Overall) | 252 (44.3%) | 317 (55.7%) |
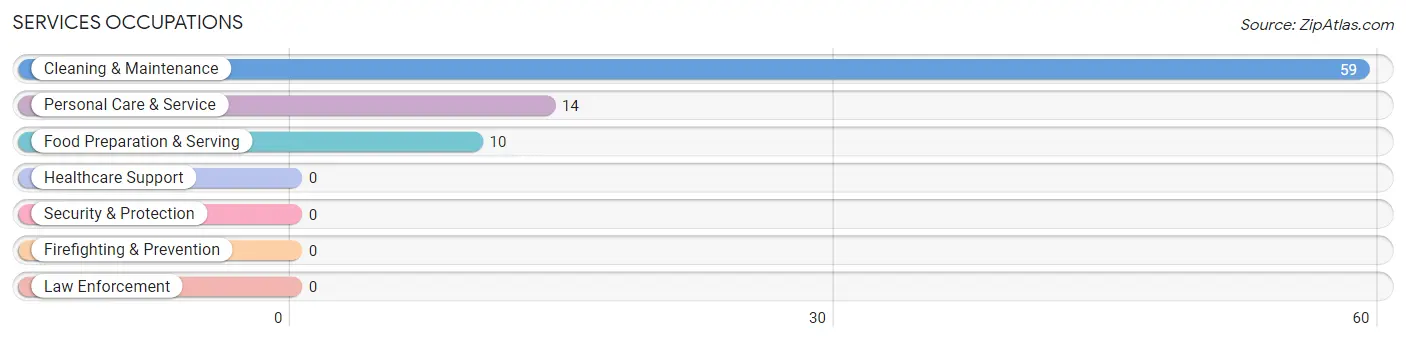
Services Occupations
The most common Services occupations in Smith Valley are Cleaning & Maintenance (59 | 10.4%), Personal Care & Service (14 | 2.5%), and Food Preparation & Serving (10 | 1.8%).
Services Occupations by Sex
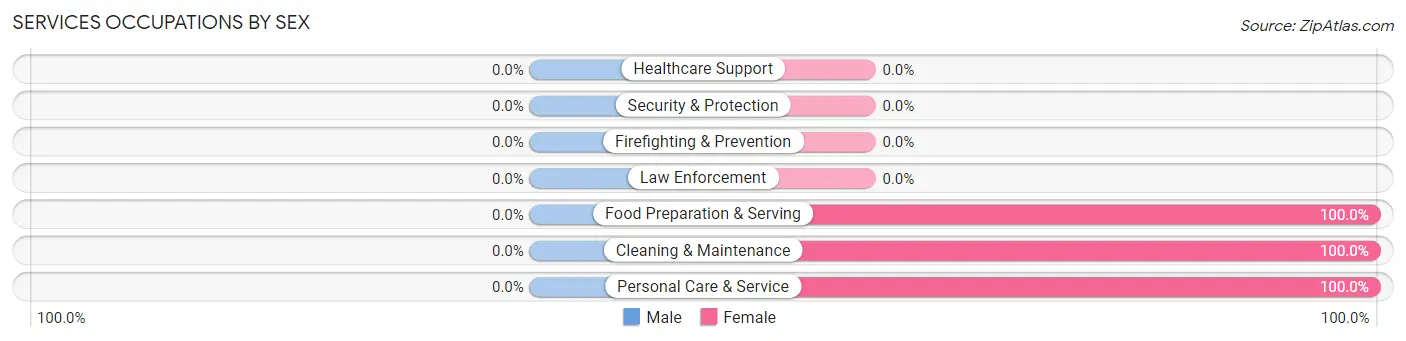
| Occupation | Male | Female |
| Healthcare Support | 0 (0.0%) | 0 (0.0%) |
| Security & Protection | 0 (0.0%) | 0 (0.0%) |
| Firefighting & Prevention | 0 (0.0%) | 0 (0.0%) |
| Law Enforcement | 0 (0.0%) | 0 (0.0%) |
| Food Preparation & Serving | 0 (0.0%) | 10 (100.0%) |
| Cleaning & Maintenance | 0 (0.0%) | 59 (100.0%) |
| Personal Care & Service | 0 (0.0%) | 14 (100.0%) |
| Total (Category) | 0 (0.0%) | 83 (100.0%) |
| Total (Overall) | 252 (44.3%) | 317 (55.7%) |
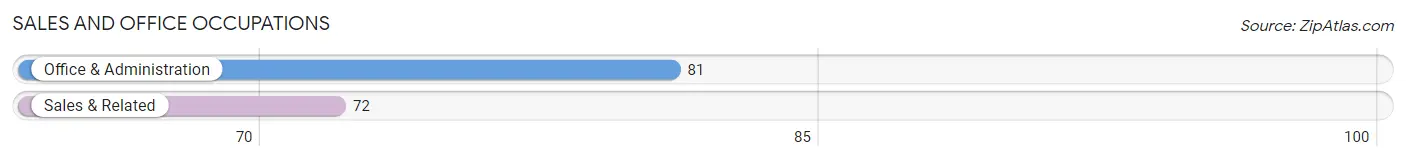
Sales and Office Occupations
The most common Sales and Office occupations in Smith Valley are Office & Administration (81 | 14.2%), and Sales & Related (72 | 12.7%).
Sales and Office Occupations by Sex
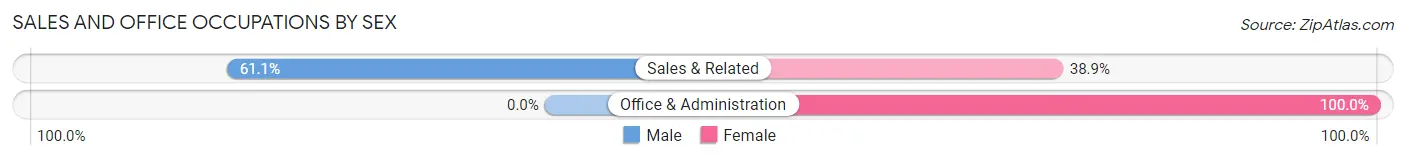
| Occupation | Male | Female |
| Sales & Related | 44 (61.1%) | 28 (38.9%) |
| Office & Administration | 0 (0.0%) | 81 (100.0%) |
| Total (Category) | 44 (28.8%) | 109 (71.2%) |
| Total (Overall) | 252 (44.3%) | 317 (55.7%) |
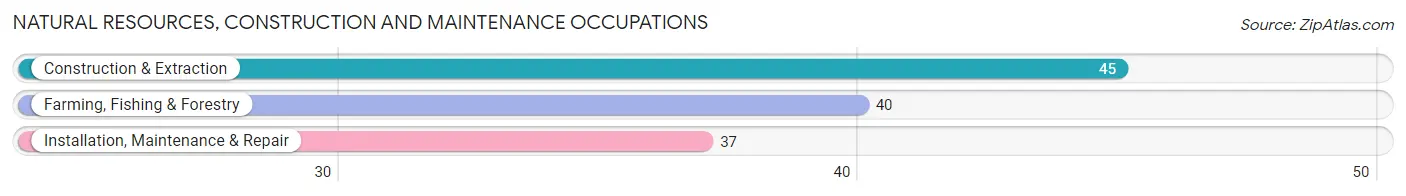
Natural Resources, Construction and Maintenance Occupations
The most common Natural Resources, Construction and Maintenance occupations in Smith Valley are Construction & Extraction (45 | 7.9%), Farming, Fishing & Forestry (40 | 7.0%), and Installation, Maintenance & Repair (37 | 6.5%).
Natural Resources, Construction and Maintenance Occupations by Sex
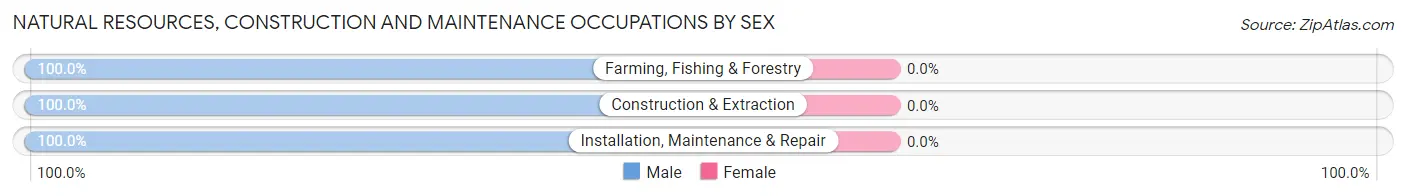
| Occupation | Male | Female |
| Farming, Fishing & Forestry | 40 (100.0%) | 0 (0.0%) |
| Construction & Extraction | 45 (100.0%) | 0 (0.0%) |
| Installation, Maintenance & Repair | 37 (100.0%) | 0 (0.0%) |
| Total (Category) | 122 (100.0%) | 0 (0.0%) |
| Total (Overall) | 252 (44.3%) | 317 (55.7%) |
Production, Transportation and Moving Occupations
The most common Production, Transportation and Moving occupations in Smith Valley are , and Transportation (36 | 6.3%).
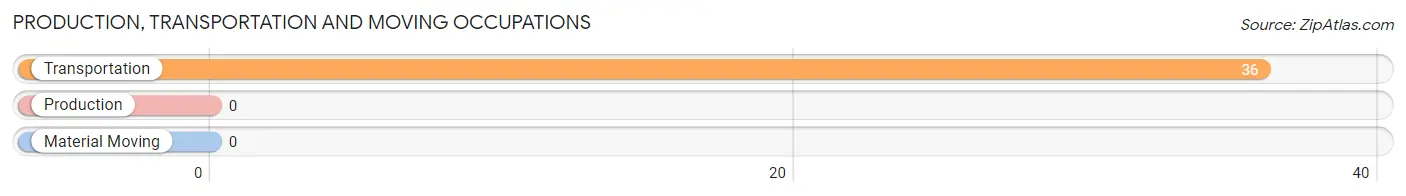
Production, Transportation and Moving Occupations by Sex
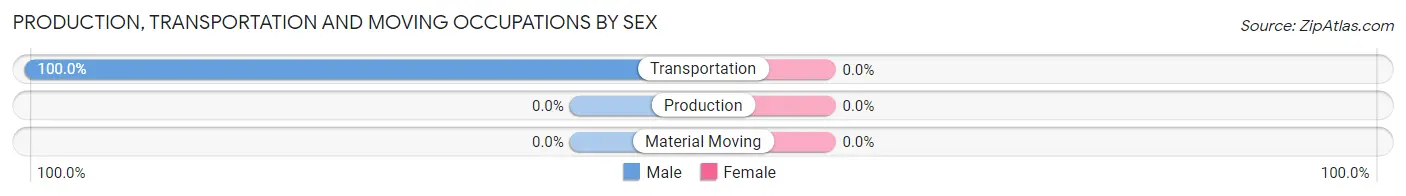
| Occupation | Male | Female |
| Production | 0 (0.0%) | 0 (0.0%) |
| Transportation | 36 (100.0%) | 0 (0.0%) |
| Material Moving | 0 (0.0%) | 0 (0.0%) |
| Total (Category) | 36 (100.0%) | 0 (0.0%) |
| Total (Overall) | 252 (44.3%) | 317 (55.7%) |
Employment Industries by Sex in Smith Valley
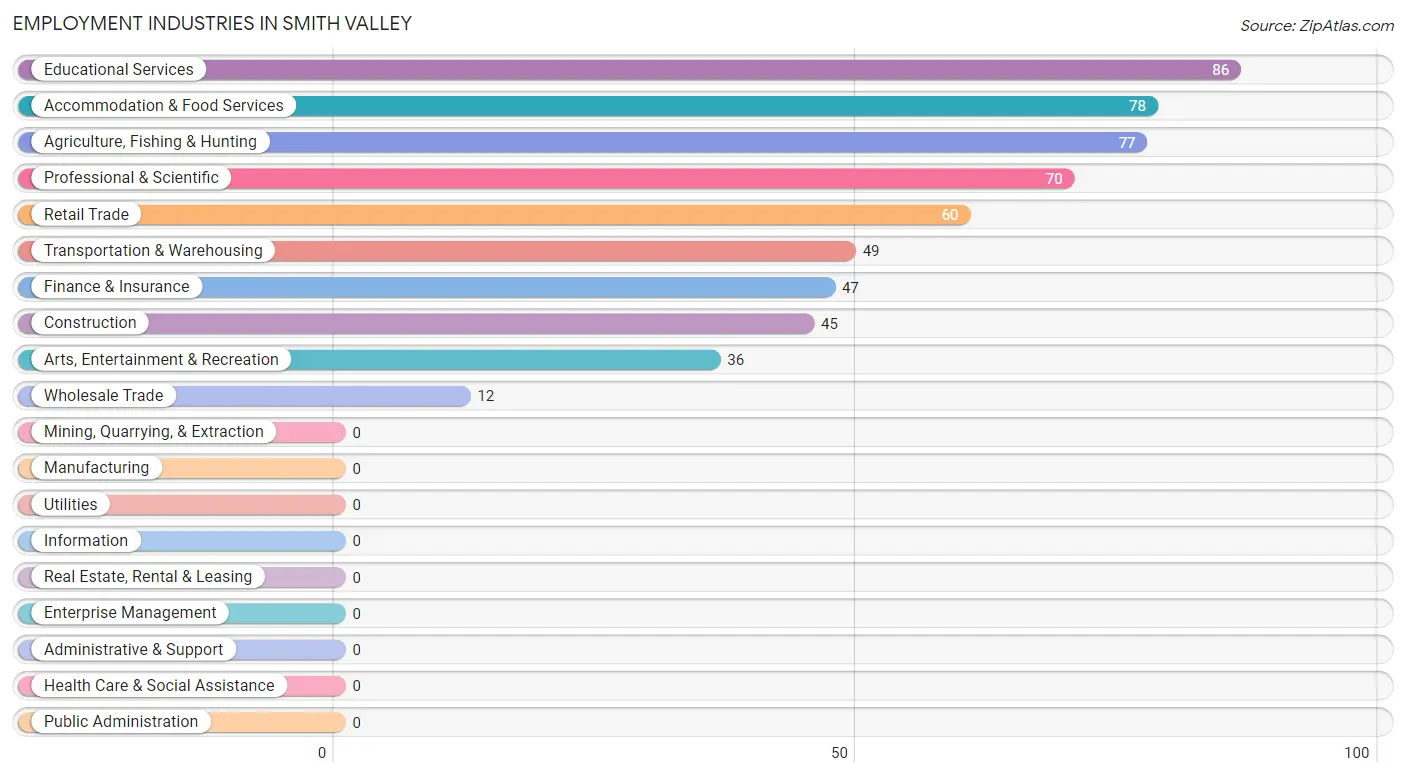
Employment Industries in Smith Valley
The major employment industries in Smith Valley include Educational Services (86 | 15.1%), Accommodation & Food Services (78 | 13.7%), Agriculture, Fishing & Hunting (77 | 13.5%), Professional & Scientific (70 | 12.3%), and Retail Trade (60 | 10.5%).
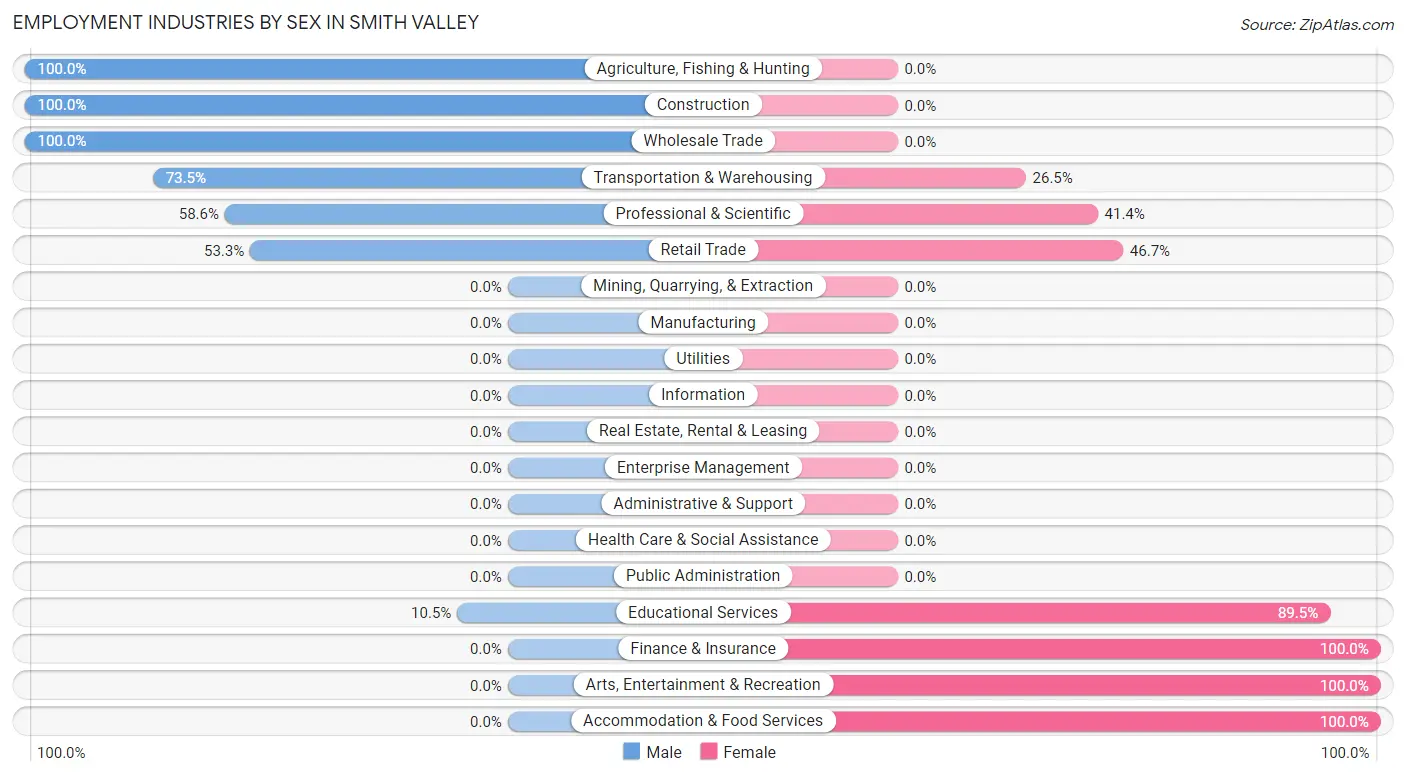
Employment Industries by Sex in Smith Valley
The Smith Valley industries that see more men than women are Agriculture, Fishing & Hunting (100.0%), Construction (100.0%), and Wholesale Trade (100.0%), whereas the industries that tend to have a higher number of women are Finance & Insurance (100.0%), Arts, Entertainment & Recreation (100.0%), and Accommodation & Food Services (100.0%).
| Industry | Male | Female |
| Agriculture, Fishing & Hunting | 77 (100.0%) | 0 (0.0%) |
| Mining, Quarrying, & Extraction | 0 (0.0%) | 0 (0.0%) |
| Construction | 45 (100.0%) | 0 (0.0%) |
| Manufacturing | 0 (0.0%) | 0 (0.0%) |
| Wholesale Trade | 12 (100.0%) | 0 (0.0%) |
| Retail Trade | 32 (53.3%) | 28 (46.7%) |
| Transportation & Warehousing | 36 (73.5%) | 13 (26.5%) |
| Utilities | 0 (0.0%) | 0 (0.0%) |
| Information | 0 (0.0%) | 0 (0.0%) |
| Finance & Insurance | 0 (0.0%) | 47 (100.0%) |
| Real Estate, Rental & Leasing | 0 (0.0%) | 0 (0.0%) |
| Professional & Scientific | 41 (58.6%) | 29 (41.4%) |
| Enterprise Management | 0 (0.0%) | 0 (0.0%) |
| Administrative & Support | 0 (0.0%) | 0 (0.0%) |
| Educational Services | 9 (10.5%) | 77 (89.5%) |
| Health Care & Social Assistance | 0 (0.0%) | 0 (0.0%) |
| Arts, Entertainment & Recreation | 0 (0.0%) | 36 (100.0%) |
| Accommodation & Food Services | 0 (0.0%) | 78 (100.0%) |
| Public Administration | 0 (0.0%) | 0 (0.0%) |
| Total | 252 (44.3%) | 317 (55.7%) |
Education in Smith Valley
School Enrollment in Smith Valley
The most common levels of schooling among the 106 students in Smith Valley are middle school (47 | 44.3%), high school (31 | 29.2%), and college / undergraduate (28 | 26.4%).
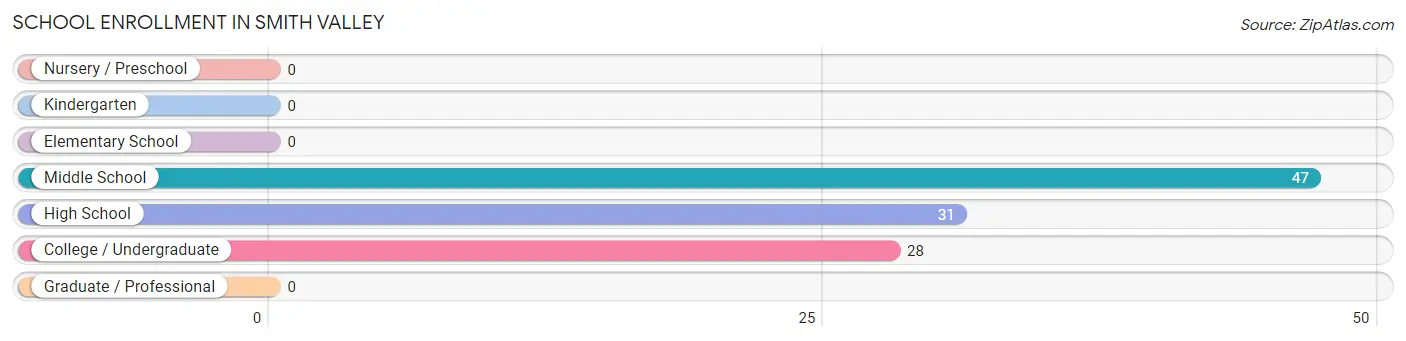
| School Level | # Students | % Students |
| Nursery / Preschool | 0 | 0.0% |
| Kindergarten | 0 | 0.0% |
| Elementary School | 0 | 0.0% |
| Middle School | 47 | 44.3% |
| High School | 31 | 29.2% |
| College / Undergraduate | 28 | 26.4% |
| Graduate / Professional | 0 | 0.0% |
| Total | 106 | 100.0% |
School Enrollment by Age by Funding Source in Smith Valley
Out of a total of 106 students who are enrolled in schools in Smith Valley, 9 (8.5%) attend a private institution, while the remaining 97 (91.5%) are enrolled in public schools. The age group of 35 years and over has the highest likelihood of being enrolled in private schools, with 9 (100.0% in the age bracket) enrolled. Conversely, the age group of 10 to 14 year olds has the lowest likelihood of being enrolled in a private school, with 58 (100.0% in the age bracket) attending a public institution.
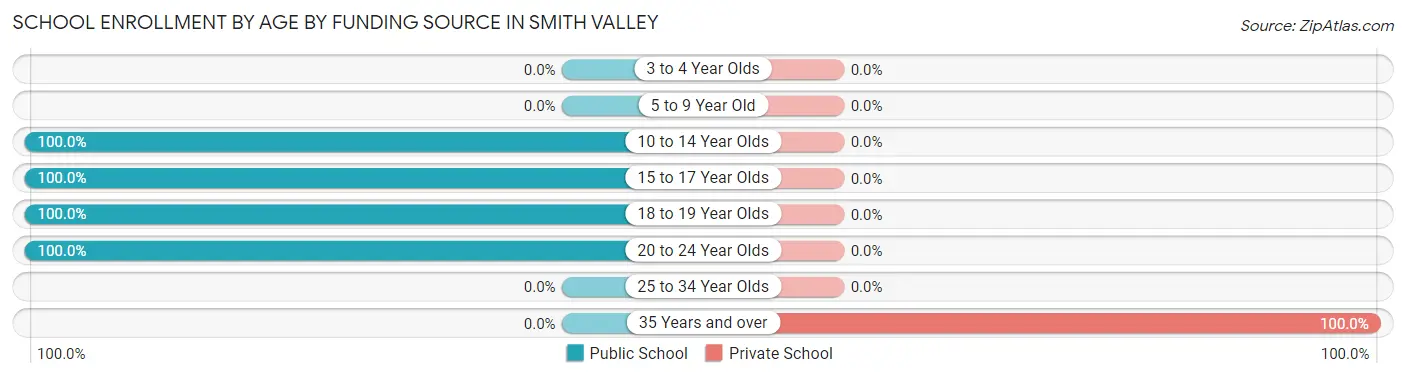
| Age Bracket | Public School | Private School |
| 3 to 4 Year Olds | 0 (0.0%) | 0 (0.0%) |
| 5 to 9 Year Old | 0 (0.0%) | 0 (0.0%) |
| 10 to 14 Year Olds | 58 (100.0%) | 0 (0.0%) |
| 15 to 17 Year Olds | 20 (100.0%) | 0 (0.0%) |
| 18 to 19 Year Olds | 10 (100.0%) | 0 (0.0%) |
| 20 to 24 Year Olds | 9 (100.0%) | 0 (0.0%) |
| 25 to 34 Year Olds | 0 (0.0%) | 0 (0.0%) |
| 35 Years and over | 0 (0.0%) | 9 (100.0%) |
| Total | 97 (91.5%) | 9 (8.5%) |
Educational Attainment by Field of Study in Smith Valley
Visual & performing arts (188 | 29.1%), education (136 | 21.1%), business (93 | 14.4%), physical & health sciences (48 | 7.4%), and literature & languages (47 | 7.3%) are the most common fields of study among 645 individuals in Smith Valley who have obtained a bachelor's degree or higher.
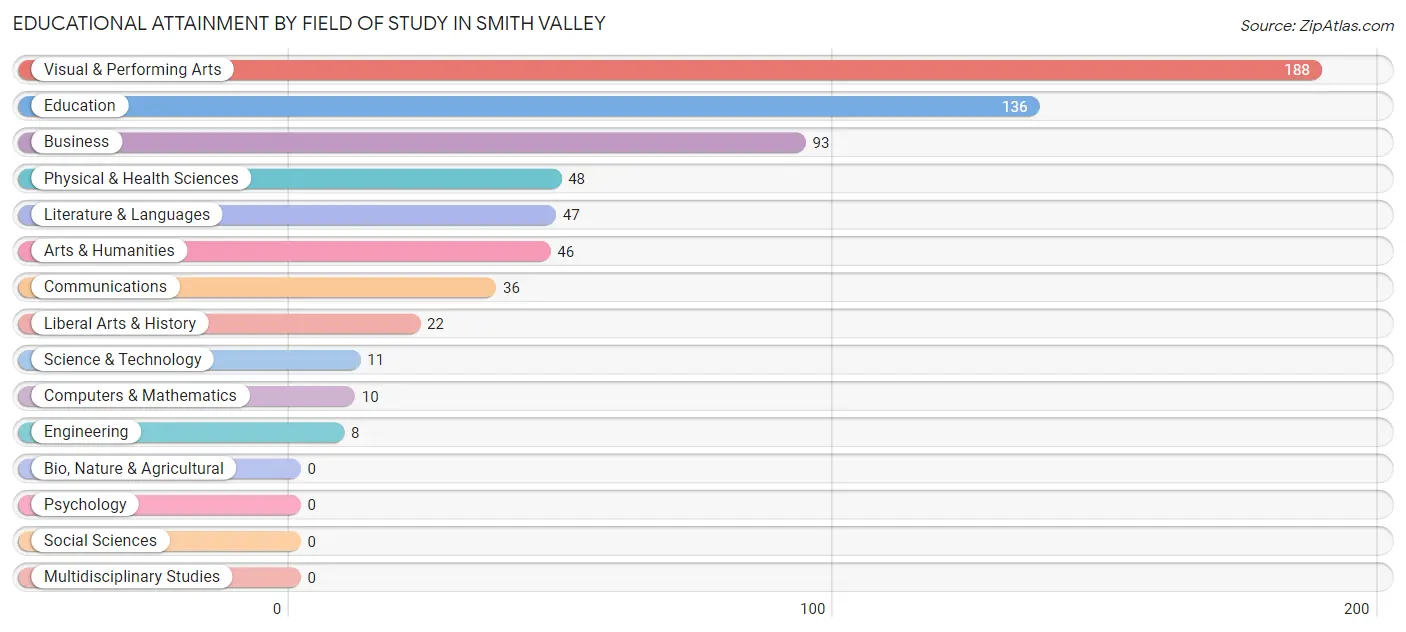
| Field of Study | # Graduates | % Graduates |
| Computers & Mathematics | 10 | 1.5% |
| Bio, Nature & Agricultural | 0 | 0.0% |
| Physical & Health Sciences | 48 | 7.4% |
| Psychology | 0 | 0.0% |
| Social Sciences | 0 | 0.0% |
| Engineering | 8 | 1.2% |
| Multidisciplinary Studies | 0 | 0.0% |
| Science & Technology | 11 | 1.7% |
| Business | 93 | 14.4% |
| Education | 136 | 21.1% |
| Literature & Languages | 47 | 7.3% |
| Liberal Arts & History | 22 | 3.4% |
| Visual & Performing Arts | 188 | 29.1% |
| Communications | 36 | 5.6% |
| Arts & Humanities | 46 | 7.1% |
| Total | 645 | 100.0% |
Transportation & Commute in Smith Valley
Vehicle Availability by Sex in Smith Valley
The most prevalent vehicle ownership categories in Smith Valley are males with 2 vehicles (108, accounting for 42.9%) and females with 2 vehicles (124, making up 35.1%).
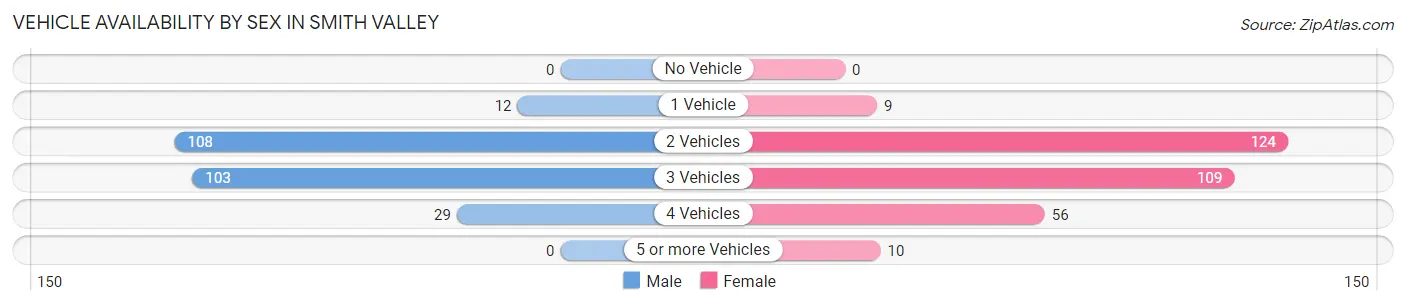
| Vehicles Available | Male | Female |
| No Vehicle | 0 (0.0%) | 0 (0.0%) |
| 1 Vehicle | 12 (4.8%) | 9 (2.9%) |
| 2 Vehicles | 108 (42.9%) | 124 (40.3%) |
| 3 Vehicles | 103 (40.9%) | 109 (35.4%) |
| 4 Vehicles | 29 (11.5%) | 56 (18.2%) |
| 5 or more Vehicles | 0 (0.0%) | 10 (3.3%) |
| Total | 252 (100.0%) | 308 (100.0%) |
Commute Time in Smith Valley
The most frequently occuring commute durations in Smith Valley are 40 to 44 minutes (136 commuters, 32.6%), 5 to 9 minutes (68 commuters, 16.3%), and 10 to 14 minutes (68 commuters, 16.3%).
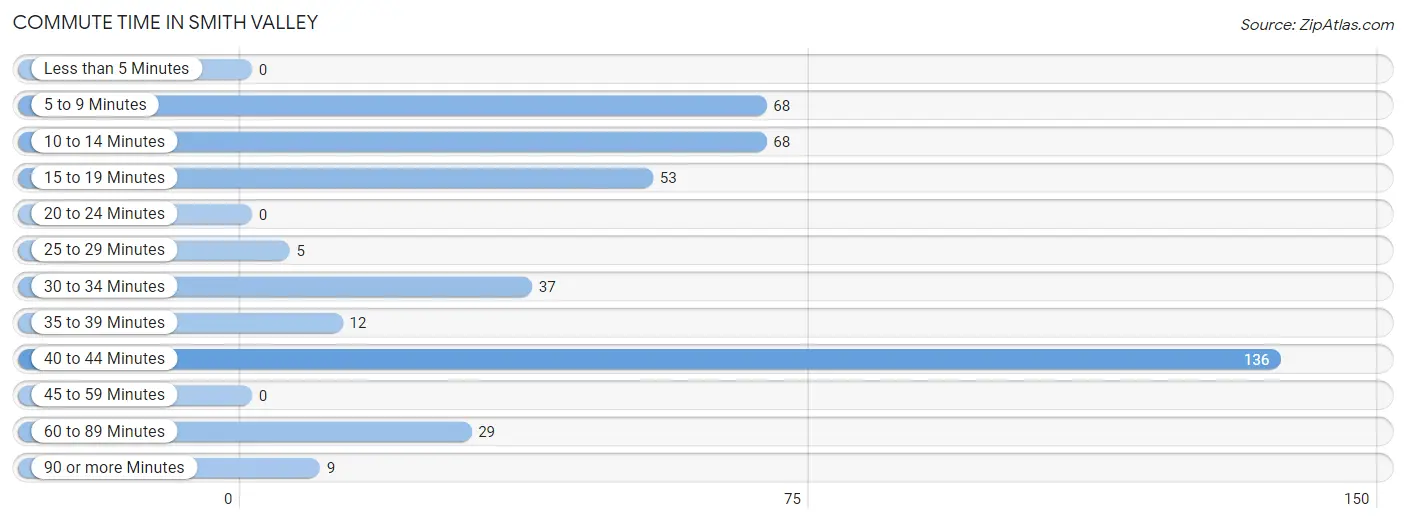
| Commute Time | # Commuters | % Commuters |
| Less than 5 Minutes | 0 | 0.0% |
| 5 to 9 Minutes | 68 | 16.3% |
| 10 to 14 Minutes | 68 | 16.3% |
| 15 to 19 Minutes | 53 | 12.7% |
| 20 to 24 Minutes | 0 | 0.0% |
| 25 to 29 Minutes | 5 | 1.2% |
| 30 to 34 Minutes | 37 | 8.9% |
| 35 to 39 Minutes | 12 | 2.9% |
| 40 to 44 Minutes | 136 | 32.6% |
| 45 to 59 Minutes | 0 | 0.0% |
| 60 to 89 Minutes | 29 | 7.0% |
| 90 or more Minutes | 9 | 2.2% |
Commute Time by Sex in Smith Valley
The most common commute times in Smith Valley are 5 to 9 minutes (68 commuters, 29.4%) for males and 40 to 44 minutes (75 commuters, 40.3%) for females.
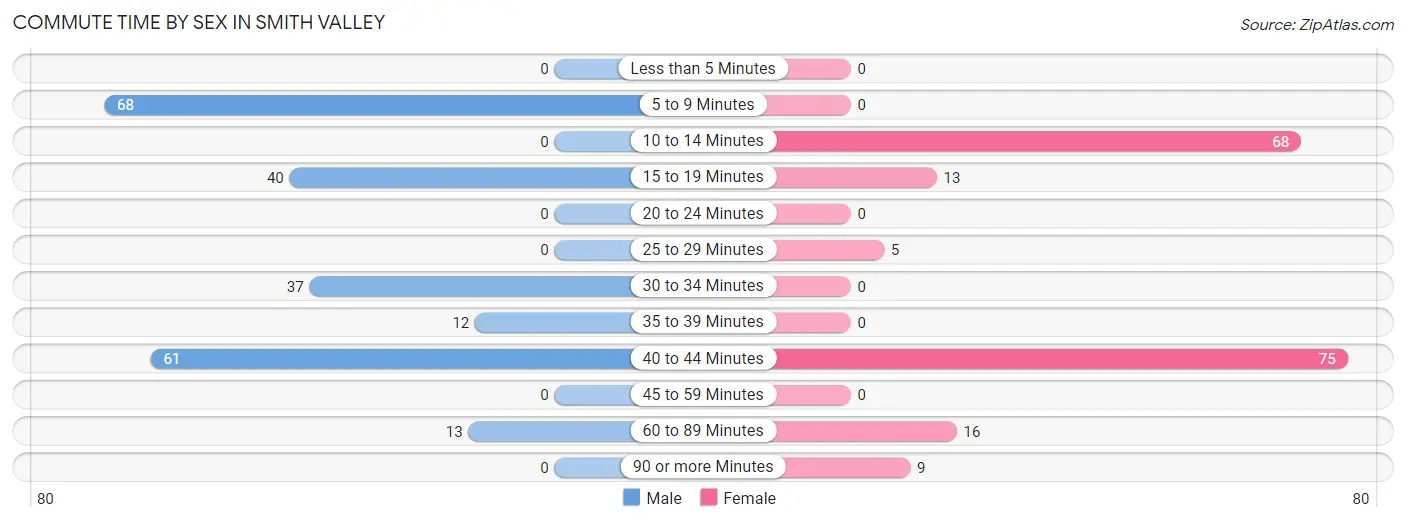
| Commute Time | Male | Female |
| Less than 5 Minutes | 0 (0.0%) | 0 (0.0%) |
| 5 to 9 Minutes | 68 (29.4%) | 0 (0.0%) |
| 10 to 14 Minutes | 0 (0.0%) | 68 (36.6%) |
| 15 to 19 Minutes | 40 (17.3%) | 13 (7.0%) |
| 20 to 24 Minutes | 0 (0.0%) | 0 (0.0%) |
| 25 to 29 Minutes | 0 (0.0%) | 5 (2.7%) |
| 30 to 34 Minutes | 37 (16.0%) | 0 (0.0%) |
| 35 to 39 Minutes | 12 (5.2%) | 0 (0.0%) |
| 40 to 44 Minutes | 61 (26.4%) | 75 (40.3%) |
| 45 to 59 Minutes | 0 (0.0%) | 0 (0.0%) |
| 60 to 89 Minutes | 13 (5.6%) | 16 (8.6%) |
| 90 or more Minutes | 0 (0.0%) | 9 (4.8%) |
Time of Departure to Work by Sex in Smith Valley
The most frequent times of departure to work in Smith Valley are 7:30 AM to 7:59 AM (77, 33.3%) for males and 5:30 AM to 5:59 AM (74, 39.8%) for females.
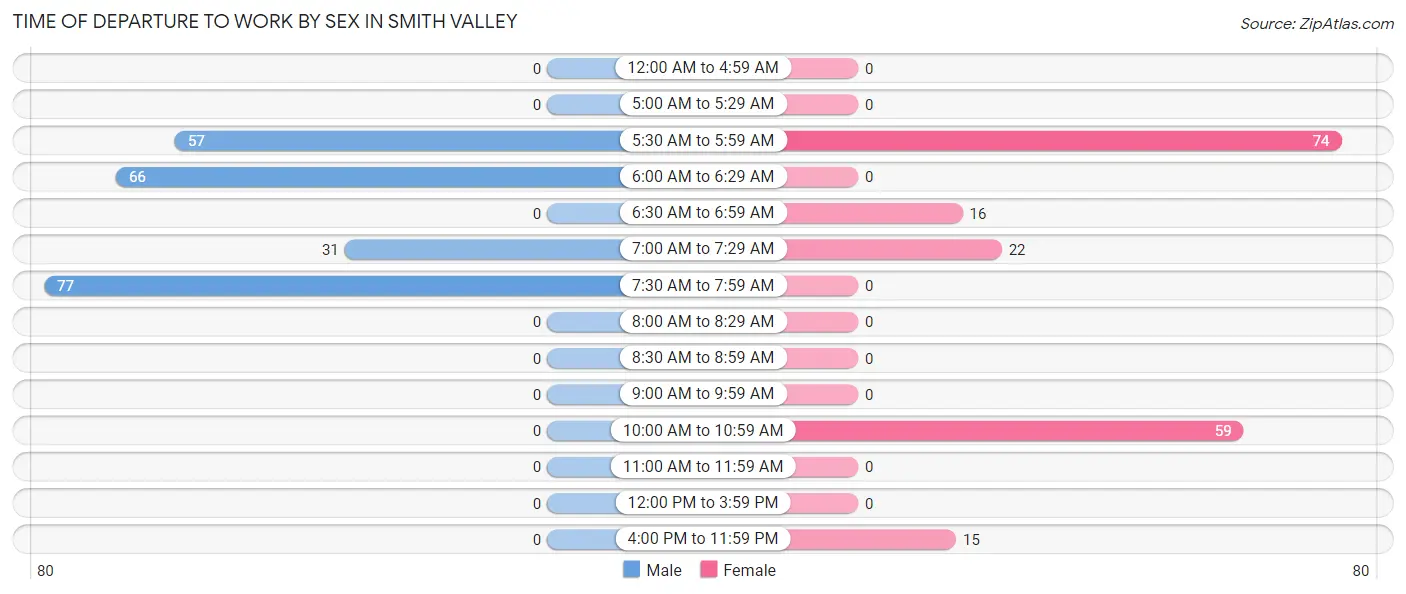
| Time of Departure | Male | Female |
| 12:00 AM to 4:59 AM | 0 (0.0%) | 0 (0.0%) |
| 5:00 AM to 5:29 AM | 0 (0.0%) | 0 (0.0%) |
| 5:30 AM to 5:59 AM | 57 (24.7%) | 74 (39.8%) |
| 6:00 AM to 6:29 AM | 66 (28.6%) | 0 (0.0%) |
| 6:30 AM to 6:59 AM | 0 (0.0%) | 16 (8.6%) |
| 7:00 AM to 7:29 AM | 31 (13.4%) | 22 (11.8%) |
| 7:30 AM to 7:59 AM | 77 (33.3%) | 0 (0.0%) |
| 8:00 AM to 8:29 AM | 0 (0.0%) | 0 (0.0%) |
| 8:30 AM to 8:59 AM | 0 (0.0%) | 0 (0.0%) |
| 9:00 AM to 9:59 AM | 0 (0.0%) | 0 (0.0%) |
| 10:00 AM to 10:59 AM | 0 (0.0%) | 59 (31.7%) |
| 11:00 AM to 11:59 AM | 0 (0.0%) | 0 (0.0%) |
| 12:00 PM to 3:59 PM | 0 (0.0%) | 0 (0.0%) |
| 4:00 PM to 11:59 PM | 0 (0.0%) | 15 (8.1%) |
| Total | 231 (100.0%) | 186 (100.0%) |
Housing Occupancy in Smith Valley
Occupancy by Ownership in Smith Valley
Of the total 879 dwellings in Smith Valley, owner-occupied units account for 790 (89.9%), while renter-occupied units make up 89 (10.1%).
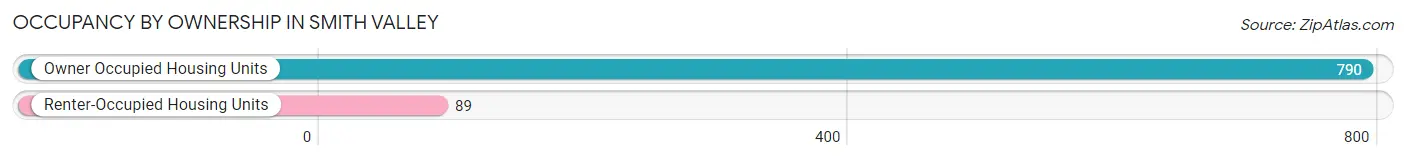
| Occupancy | # Housing Units | % Housing Units |
| Owner Occupied Housing Units | 790 | 89.9% |
| Renter-Occupied Housing Units | 89 | 10.1% |
| Total Occupied Housing Units | 879 | 100.0% |
Occupancy by Household Size in Smith Valley
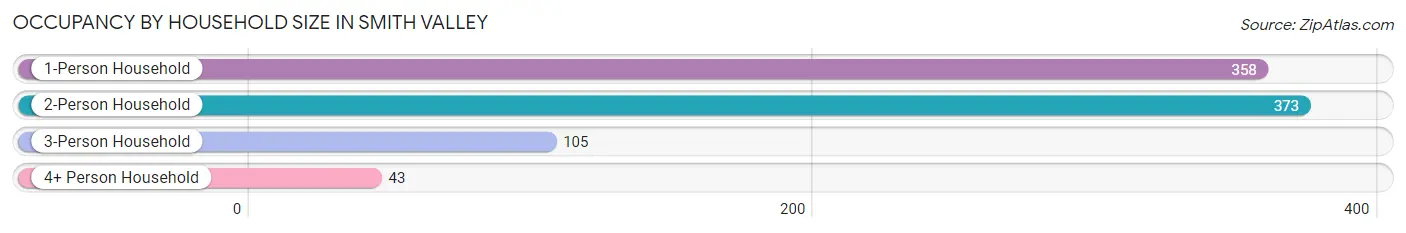
| Household Size | # Housing Units | % Housing Units |
| 1-Person Household | 358 | 40.7% |
| 2-Person Household | 373 | 42.4% |
| 3-Person Household | 105 | 11.9% |
| 4+ Person Household | 43 | 4.9% |
| Total Housing Units | 879 | 100.0% |
Occupancy by Ownership by Household Size in Smith Valley
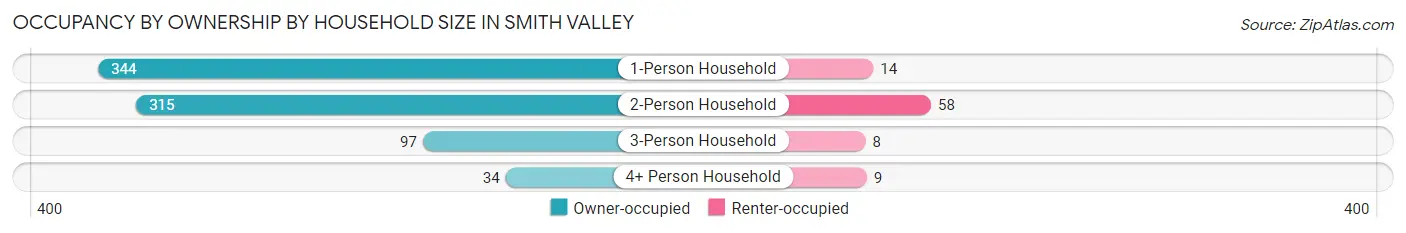
| Household Size | Owner-occupied | Renter-occupied |
| 1-Person Household | 344 (96.1%) | 14 (3.9%) |
| 2-Person Household | 315 (84.5%) | 58 (15.5%) |
| 3-Person Household | 97 (92.4%) | 8 (7.6%) |
| 4+ Person Household | 34 (79.1%) | 9 (20.9%) |
| Total Housing Units | 790 (89.9%) | 89 (10.1%) |
Occupancy by Educational Attainment in Smith Valley
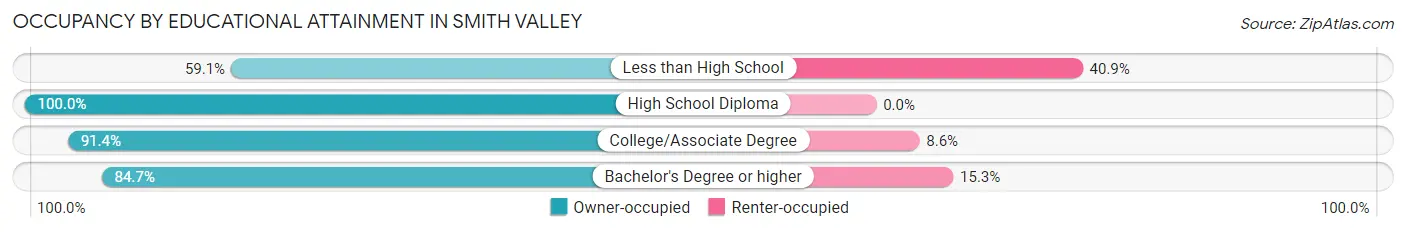
| Household Size | Owner-occupied | Renter-occupied |
| Less than High School | 13 (59.1%) | 9 (40.9%) |
| High School Diploma | 220 (100.0%) | 0 (0.0%) |
| College/Associate Degree | 235 (91.4%) | 22 (8.6%) |
| Bachelor's Degree or higher | 322 (84.7%) | 58 (15.3%) |
Occupancy by Age of Householder in Smith Valley
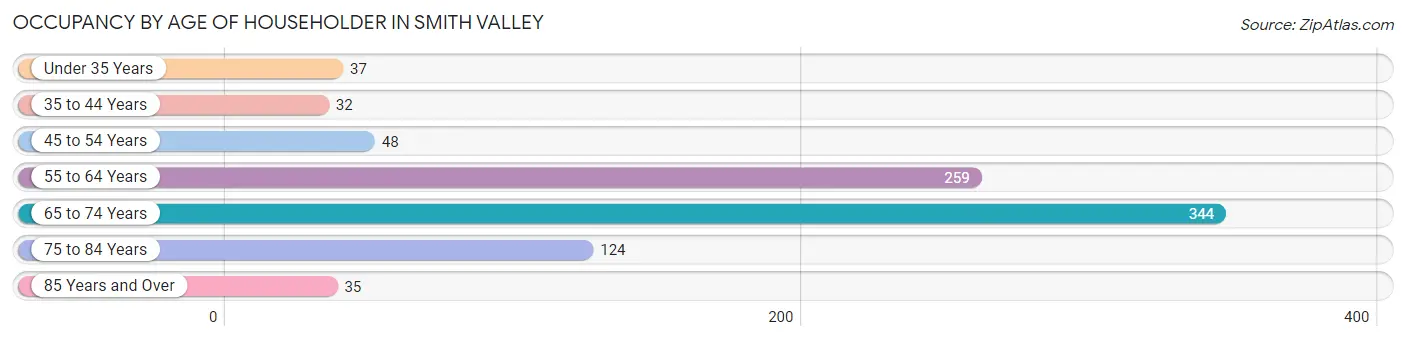
| Age Bracket | # Households | % Households |
| Under 35 Years | 37 | 4.2% |
| 35 to 44 Years | 32 | 3.6% |
| 45 to 54 Years | 48 | 5.5% |
| 55 to 64 Years | 259 | 29.5% |
| 65 to 74 Years | 344 | 39.1% |
| 75 to 84 Years | 124 | 14.1% |
| 85 Years and Over | 35 | 4.0% |
| Total | 879 | 100.0% |
Housing Finances in Smith Valley
Median Income by Occupancy in Smith Valley
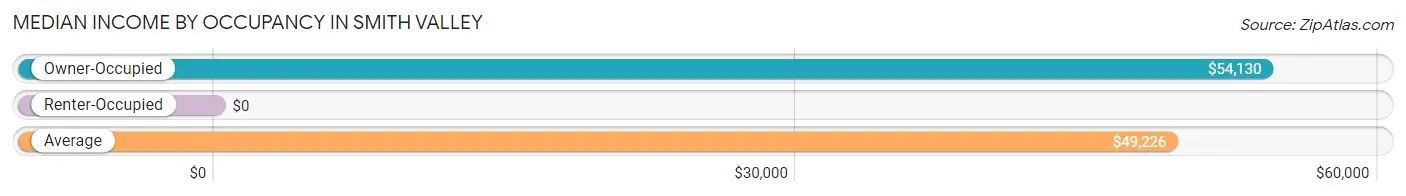
| Occupancy Type | # Households | Median Income |
| Owner-Occupied | 790 (89.9%) | $54,130 |
| Renter-Occupied | 89 (10.1%) | $0 |
| Average | 879 (100.0%) | $49,226 |
Occupancy by Householder Income Bracket in Smith Valley
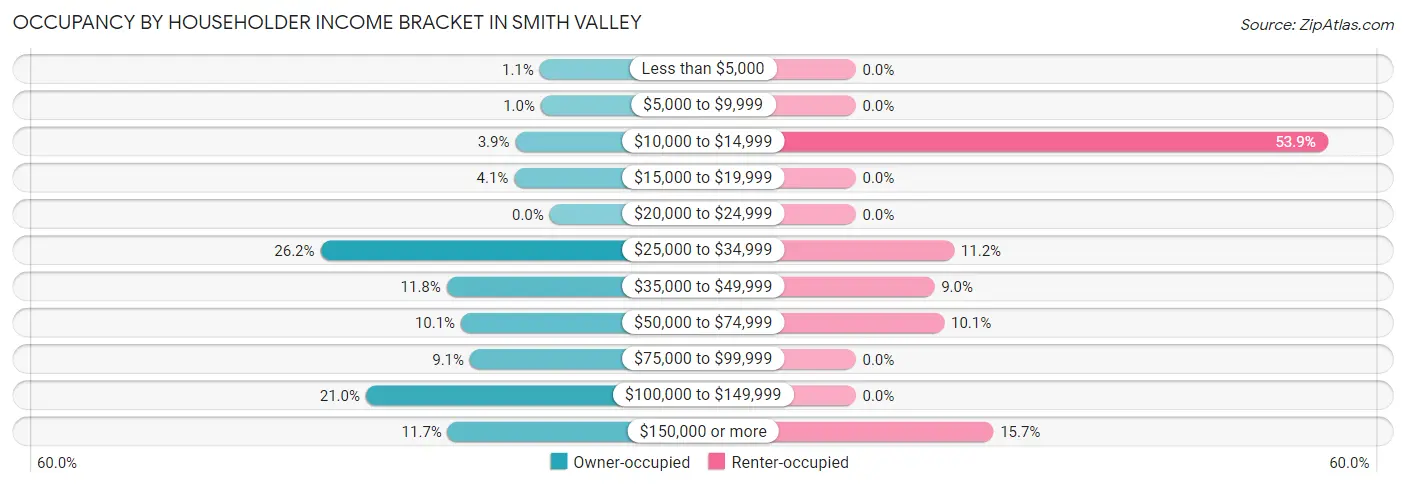
| Income Bracket | Owner-occupied | Renter-occupied |
| Less than $5,000 | 9 (1.1%) | 0 (0.0%) |
| $5,000 to $9,999 | 8 (1.0%) | 0 (0.0%) |
| $10,000 to $14,999 | 31 (3.9%) | 48 (53.9%) |
| $15,000 to $19,999 | 32 (4.1%) | 0 (0.0%) |
| $20,000 to $24,999 | 0 (0.0%) | 0 (0.0%) |
| $25,000 to $34,999 | 207 (26.2%) | 10 (11.2%) |
| $35,000 to $49,999 | 93 (11.8%) | 8 (9.0%) |
| $50,000 to $74,999 | 80 (10.1%) | 9 (10.1%) |
| $75,000 to $99,999 | 72 (9.1%) | 0 (0.0%) |
| $100,000 to $149,999 | 166 (21.0%) | 0 (0.0%) |
| $150,000 or more | 92 (11.7%) | 14 (15.7%) |
| Total | 790 (100.0%) | 89 (100.0%) |
Monthly Housing Cost Tiers in Smith Valley
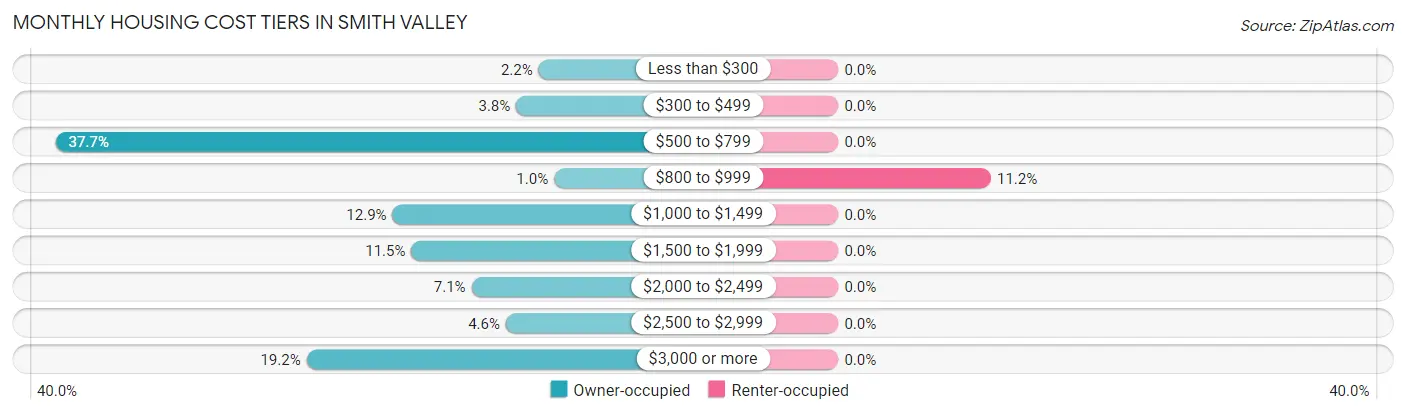
| Monthly Cost | Owner-occupied | Renter-occupied |
| Less than $300 | 17 (2.1%) | 0 (0.0%) |
| $300 to $499 | 30 (3.8%) | 0 (0.0%) |
| $500 to $799 | 298 (37.7%) | 0 (0.0%) |
| $800 to $999 | 8 (1.0%) | 10 (11.2%) |
| $1,000 to $1,499 | 102 (12.9%) | 0 (0.0%) |
| $1,500 to $1,999 | 91 (11.5%) | 0 (0.0%) |
| $2,000 to $2,499 | 56 (7.1%) | 0 (0.0%) |
| $2,500 to $2,999 | 36 (4.6%) | 0 (0.0%) |
| $3,000 or more | 152 (19.2%) | 0 (0.0%) |
| Total | 790 (100.0%) | 89 (100.0%) |
Physical Housing Characteristics in Smith Valley
Housing Structures in Smith Valley
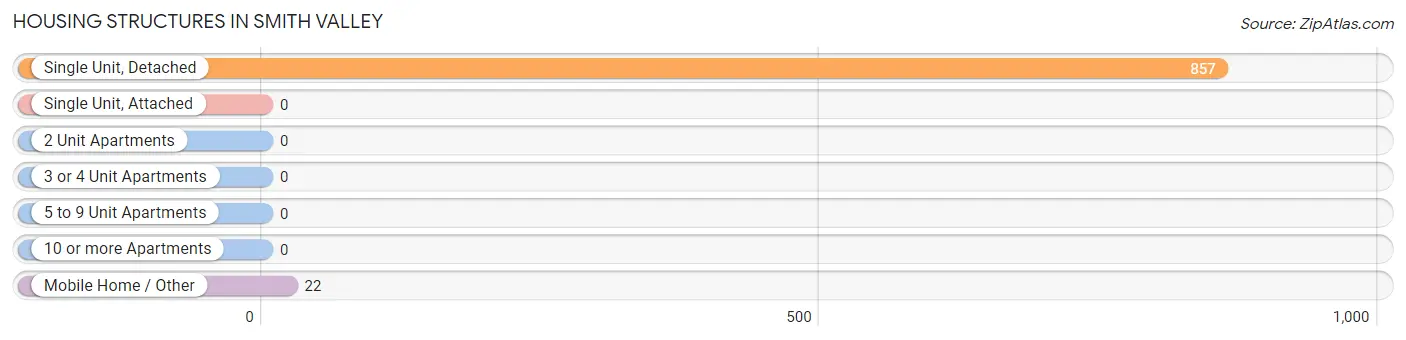
| Structure Type | # Housing Units | % Housing Units |
| Single Unit, Detached | 857 | 97.5% |
| Single Unit, Attached | 0 | 0.0% |
| 2 Unit Apartments | 0 | 0.0% |
| 3 or 4 Unit Apartments | 0 | 0.0% |
| 5 to 9 Unit Apartments | 0 | 0.0% |
| 10 or more Apartments | 0 | 0.0% |
| Mobile Home / Other | 22 | 2.5% |
| Total | 879 | 100.0% |
Housing Structures by Occupancy in Smith Valley
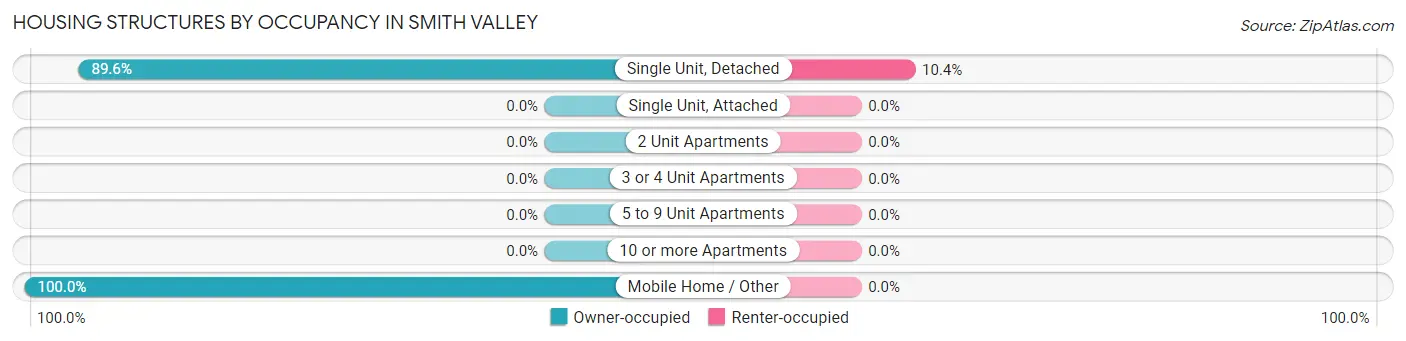
| Structure Type | Owner-occupied | Renter-occupied |
| Single Unit, Detached | 768 (89.6%) | 89 (10.4%) |
| Single Unit, Attached | 0 (0.0%) | 0 (0.0%) |
| 2 Unit Apartments | 0 (0.0%) | 0 (0.0%) |
| 3 or 4 Unit Apartments | 0 (0.0%) | 0 (0.0%) |
| 5 to 9 Unit Apartments | 0 (0.0%) | 0 (0.0%) |
| 10 or more Apartments | 0 (0.0%) | 0 (0.0%) |
| Mobile Home / Other | 22 (100.0%) | 0 (0.0%) |
| Total | 790 (89.9%) | 89 (10.1%) |
Housing Structures by Number of Rooms in Smith Valley
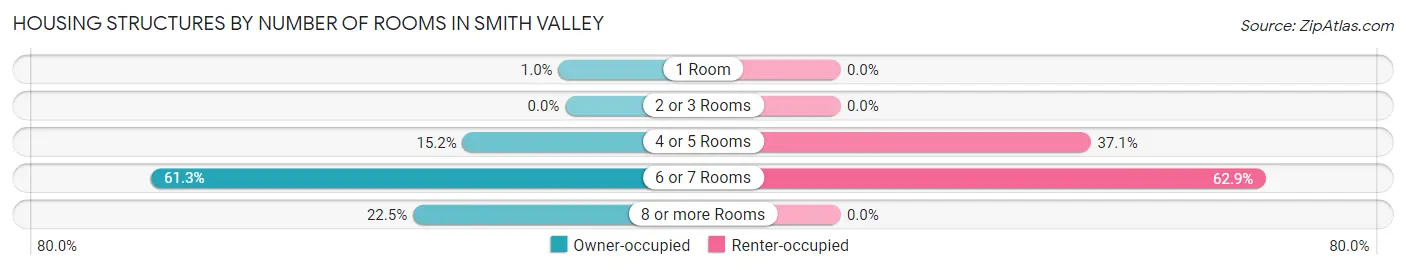
| Number of Rooms | Owner-occupied | Renter-occupied |
| 1 Room | 8 (1.0%) | 0 (0.0%) |
| 2 or 3 Rooms | 0 (0.0%) | 0 (0.0%) |
| 4 or 5 Rooms | 120 (15.2%) | 33 (37.1%) |
| 6 or 7 Rooms | 484 (61.3%) | 56 (62.9%) |
| 8 or more Rooms | 178 (22.5%) | 0 (0.0%) |
| Total | 790 (100.0%) | 89 (100.0%) |
Housing Structure by Heating Type in Smith Valley
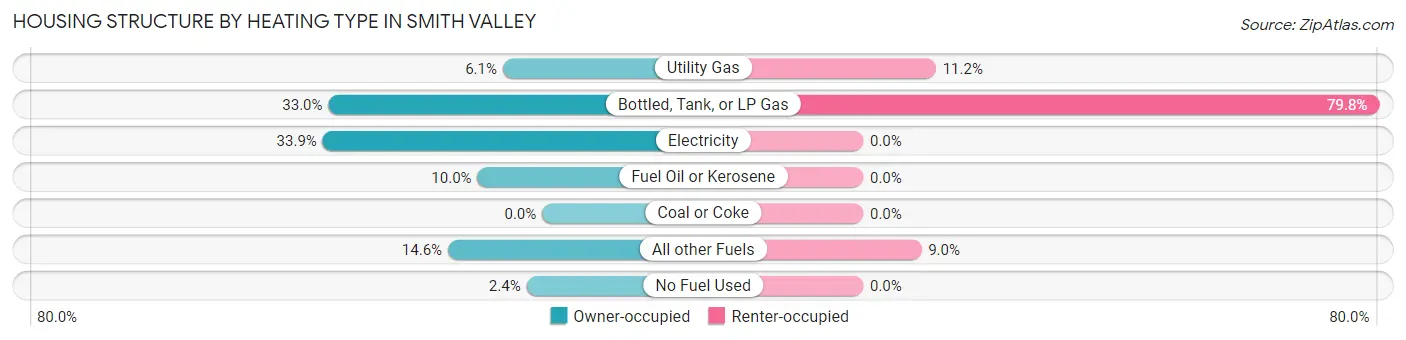
| Heating Type | Owner-occupied | Renter-occupied |
| Utility Gas | 48 (6.1%) | 10 (11.2%) |
| Bottled, Tank, or LP Gas | 261 (33.0%) | 71 (79.8%) |
| Electricity | 268 (33.9%) | 0 (0.0%) |
| Fuel Oil or Kerosene | 79 (10.0%) | 0 (0.0%) |
| Coal or Coke | 0 (0.0%) | 0 (0.0%) |
| All other Fuels | 115 (14.6%) | 8 (9.0%) |
| No Fuel Used | 19 (2.4%) | 0 (0.0%) |
| Total | 790 (100.0%) | 89 (100.0%) |
Household Vehicle Usage in Smith Valley
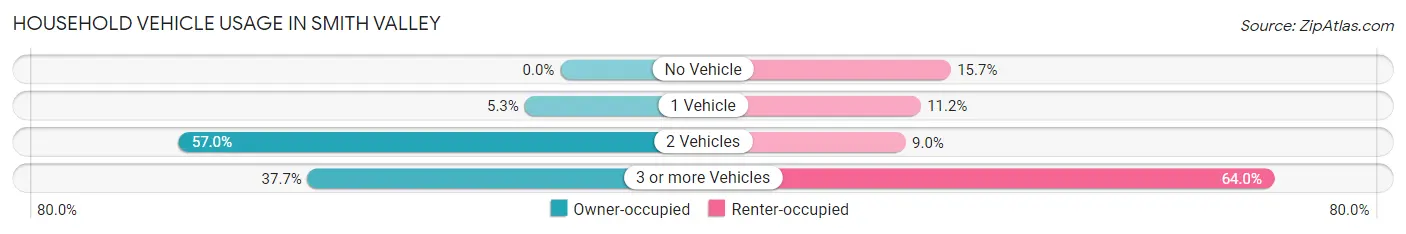
| Vehicles per Household | Owner-occupied | Renter-occupied |
| No Vehicle | 0 (0.0%) | 14 (15.7%) |
| 1 Vehicle | 42 (5.3%) | 10 (11.2%) |
| 2 Vehicles | 450 (57.0%) | 8 (9.0%) |
| 3 or more Vehicles | 298 (37.7%) | 57 (64.0%) |
| Total | 790 (100.0%) | 89 (100.0%) |
Real Estate & Mortgages in Smith Valley
Real Estate and Mortgage Overview in Smith Valley
| Characteristic | Without Mortgage | With Mortgage |
| Housing Units | 397 | 393 |
| Median Property Value | $805,800 | $584,600 |
| Median Household Income | - | - |
| Monthly Housing Costs | $561 | $152 |
| Real Estate Taxes | $3,526 | $0 |
Property Value by Mortgage Status in Smith Valley
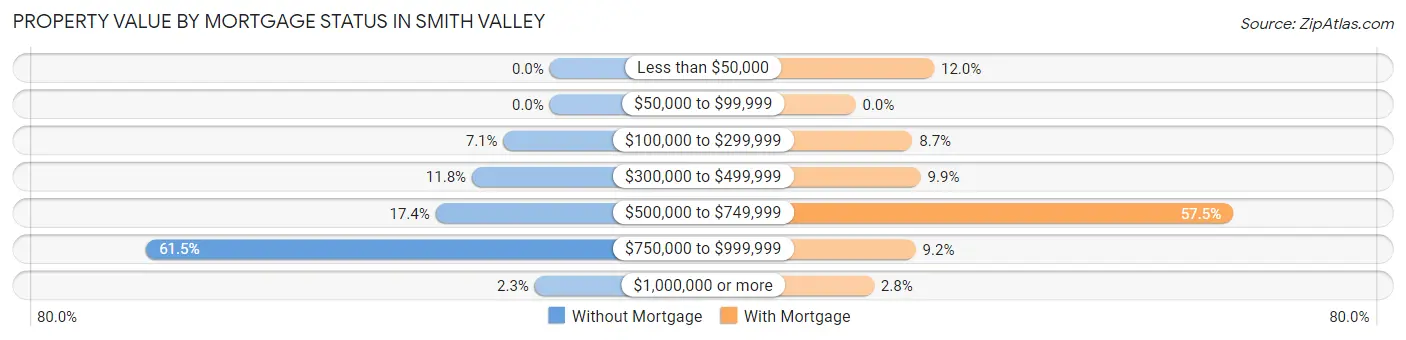
| Property Value | Without Mortgage | With Mortgage |
| Less than $50,000 | 0 (0.0%) | 47 (12.0%) |
| $50,000 to $99,999 | 0 (0.0%) | 0 (0.0%) |
| $100,000 to $299,999 | 28 (7.0%) | 34 (8.6%) |
| $300,000 to $499,999 | 47 (11.8%) | 39 (9.9%) |
| $500,000 to $749,999 | 69 (17.4%) | 226 (57.5%) |
| $750,000 to $999,999 | 244 (61.5%) | 36 (9.2%) |
| $1,000,000 or more | 9 (2.3%) | 11 (2.8%) |
| Total | 397 (100.0%) | 393 (100.0%) |
Household Income by Mortgage Status in Smith Valley
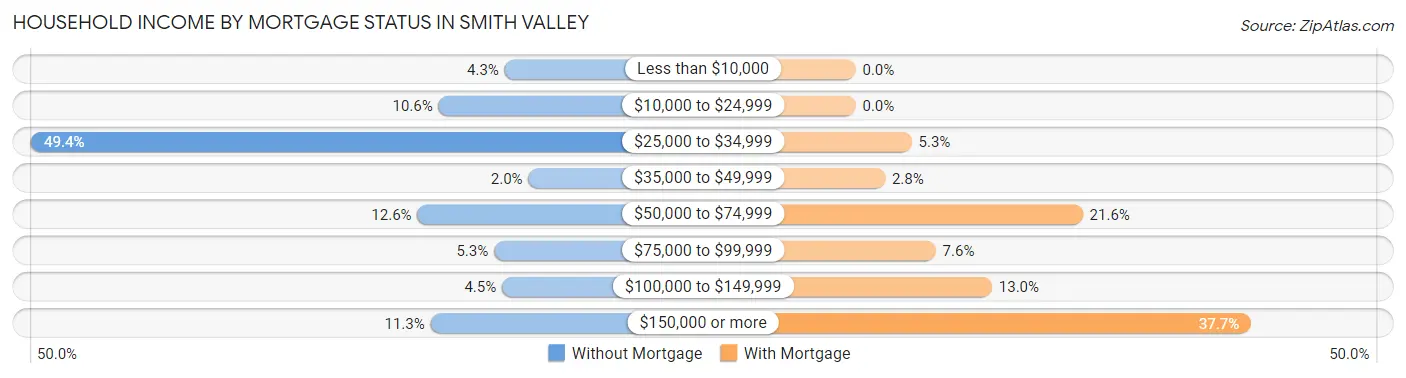
| Household Income | Without Mortgage | With Mortgage |
| Less than $10,000 | 17 (4.3%) | 0 (0.0%) |
| $10,000 to $24,999 | 42 (10.6%) | 0 (0.0%) |
| $25,000 to $34,999 | 196 (49.4%) | 21 (5.3%) |
| $35,000 to $49,999 | 8 (2.0%) | 11 (2.8%) |
| $50,000 to $74,999 | 50 (12.6%) | 85 (21.6%) |
| $75,000 to $99,999 | 21 (5.3%) | 30 (7.6%) |
| $100,000 to $149,999 | 18 (4.5%) | 51 (13.0%) |
| $150,000 or more | 45 (11.3%) | 148 (37.7%) |
| Total | 397 (100.0%) | 393 (100.0%) |
Property Value to Household Income Ratio in Smith Valley
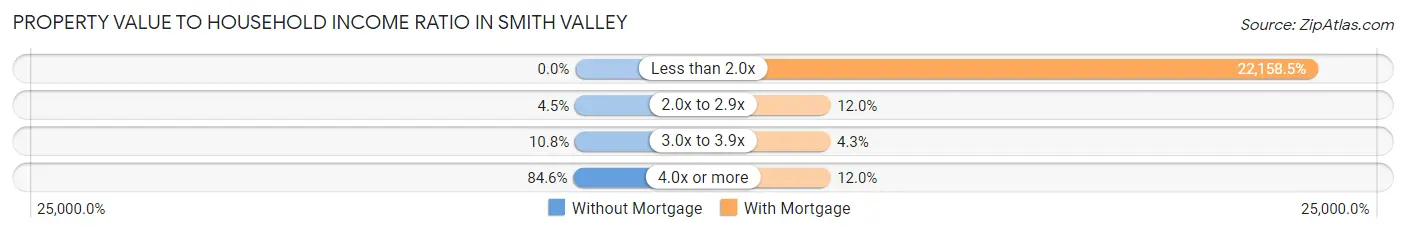
| Value-to-Income Ratio | Without Mortgage | With Mortgage |
| Less than 2.0x | 0 (0.0%) | 87,083 (22,158.5%) |
| 2.0x to 2.9x | 18 (4.5%) | 47 (12.0%) |
| 3.0x to 3.9x | 43 (10.8%) | 17 (4.3%) |
| 4.0x or more | 336 (84.6%) | 47 (12.0%) |
| Total | 397 (100.0%) | 393 (100.0%) |
Real Estate Taxes by Mortgage Status in Smith Valley
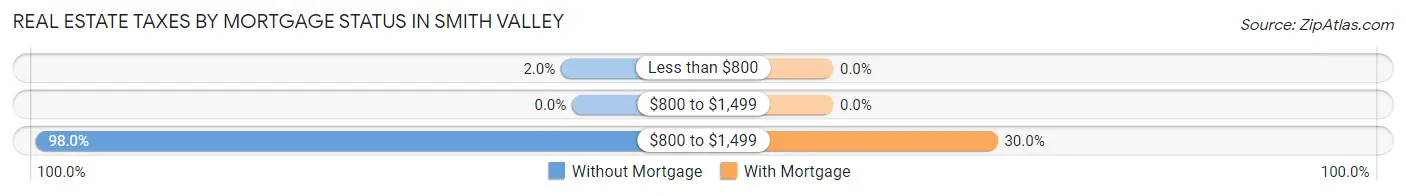
| Property Taxes | Without Mortgage | With Mortgage |
| Less than $800 | 8 (2.0%) | 0 (0.0%) |
| $800 to $1,499 | 0 (0.0%) | 0 (0.0%) |
| $800 to $1,499 | 389 (98.0%) | 118 (30.0%) |
| Total | 397 (100.0%) | 393 (100.0%) |
Health & Disability in Smith Valley
Health Insurance Coverage by Age in Smith Valley
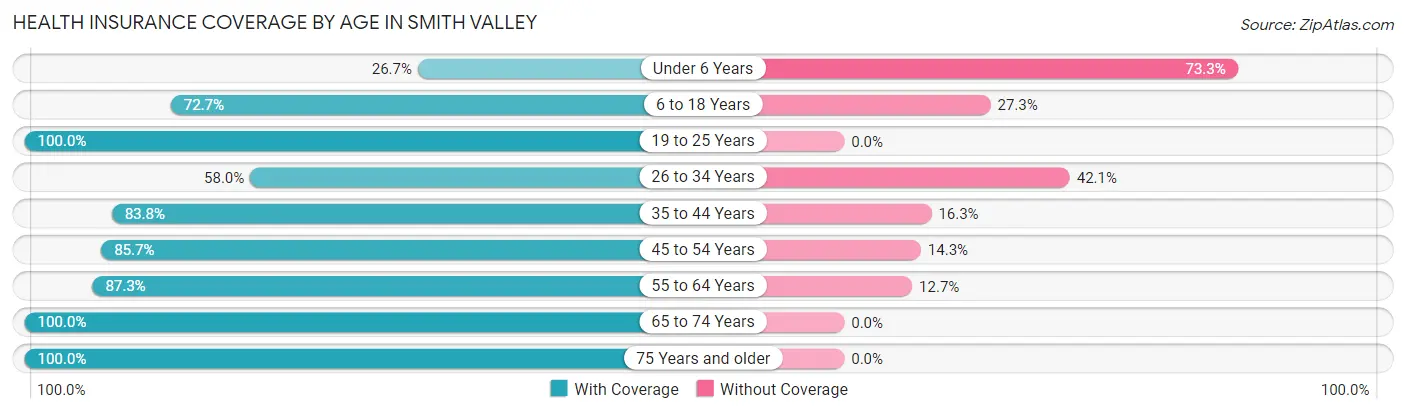
| Age Bracket | With Coverage | Without Coverage |
| Under 6 Years | 12 (26.7%) | 33 (73.3%) |
| 6 to 18 Years | 64 (72.7%) | 24 (27.3%) |
| 19 to 25 Years | 50 (100.0%) | 0 (0.0%) |
| 26 to 34 Years | 51 (58.0%) | 37 (42.0%) |
| 35 to 44 Years | 67 (83.8%) | 13 (16.3%) |
| 45 to 54 Years | 78 (85.7%) | 13 (14.3%) |
| 55 to 64 Years | 407 (87.3%) | 59 (12.7%) |
| 65 to 74 Years | 491 (100.0%) | 0 (0.0%) |
| 75 Years and older | 247 (100.0%) | 0 (0.0%) |
| Total | 1,467 (89.1%) | 179 (10.9%) |
Health Insurance Coverage by Citizenship Status in Smith Valley
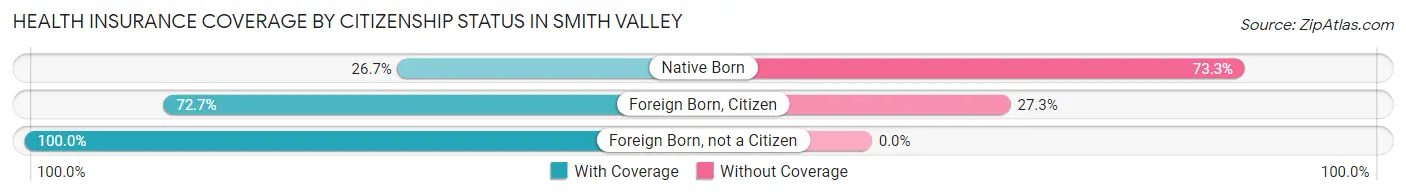
| Citizenship Status | With Coverage | Without Coverage |
| Native Born | 12 (26.7%) | 33 (73.3%) |
| Foreign Born, Citizen | 64 (72.7%) | 24 (27.3%) |
| Foreign Born, not a Citizen | 50 (100.0%) | 0 (0.0%) |
Health Insurance Coverage by Household Income in Smith Valley
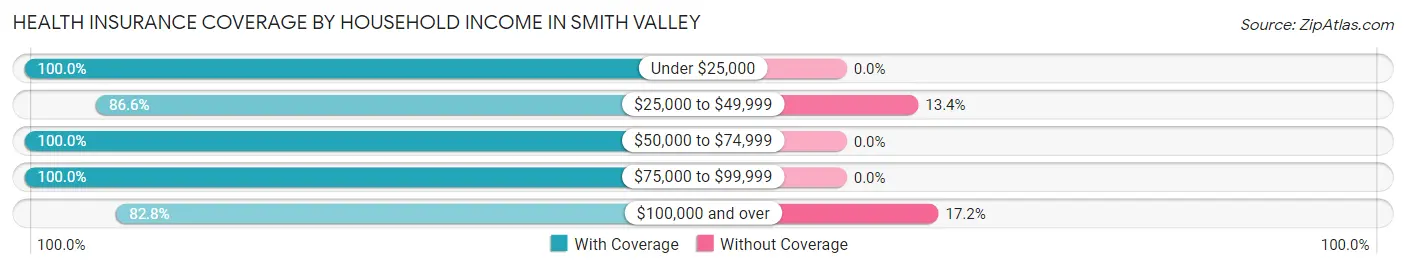
| Household Income | With Coverage | Without Coverage |
| Under $25,000 | 196 (100.0%) | 0 (0.0%) |
| $25,000 to $49,999 | 381 (86.6%) | 59 (13.4%) |
| $50,000 to $74,999 | 204 (100.0%) | 0 (0.0%) |
| $75,000 to $99,999 | 108 (100.0%) | 0 (0.0%) |
| $100,000 and over | 578 (82.8%) | 120 (17.2%) |
Public vs Private Health Insurance Coverage by Age in Smith Valley
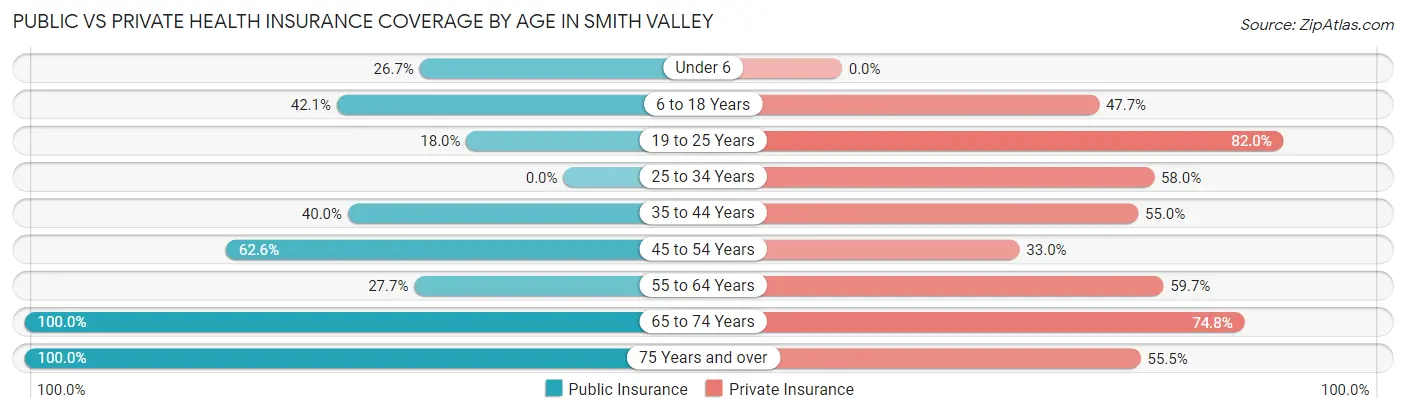
| Age Bracket | Public Insurance | Private Insurance |
| Under 6 | 12 (26.7%) | 0 (0.0%) |
| 6 to 18 Years | 37 (42.0%) | 42 (47.7%) |
| 19 to 25 Years | 9 (18.0%) | 41 (82.0%) |
| 25 to 34 Years | 0 (0.0%) | 51 (58.0%) |
| 35 to 44 Years | 32 (40.0%) | 44 (55.0%) |
| 45 to 54 Years | 57 (62.6%) | 30 (33.0%) |
| 55 to 64 Years | 129 (27.7%) | 278 (59.7%) |
| 65 to 74 Years | 491 (100.0%) | 367 (74.8%) |
| 75 Years and over | 247 (100.0%) | 137 (55.5%) |
| Total | 1,014 (61.6%) | 990 (60.2%) |
Disability Status by Sex by Age in Smith Valley
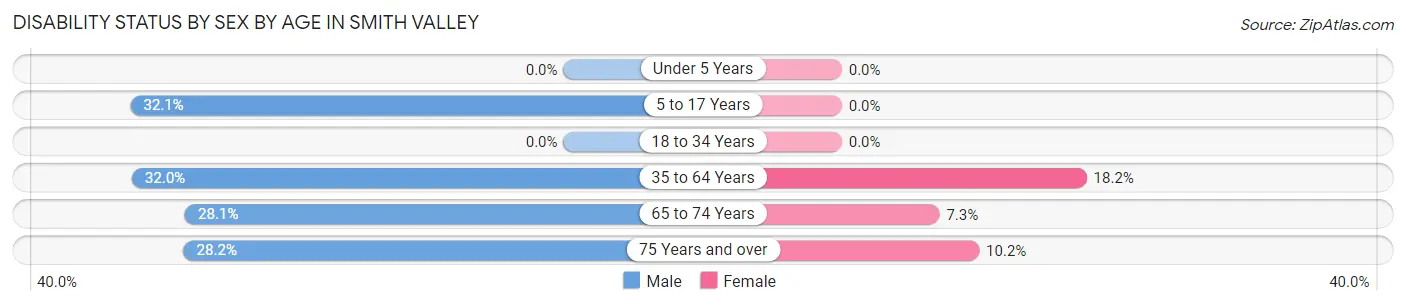
| Age Bracket | Male | Female |
| Under 5 Years | 0 (0.0%) | 0 (0.0%) |
| 5 to 17 Years | 18 (32.1%) | 0 (0.0%) |
| 18 to 34 Years | 0 (0.0%) | 0 (0.0%) |
| 35 to 64 Years | 123 (32.0%) | 46 (18.2%) |
| 65 to 74 Years | 41 (28.1%) | 25 (7.2%) |
| 75 Years and over | 42 (28.2%) | 10 (10.2%) |
Disability Class by Sex by Age in Smith Valley
Disability Class: Hearing Difficulty
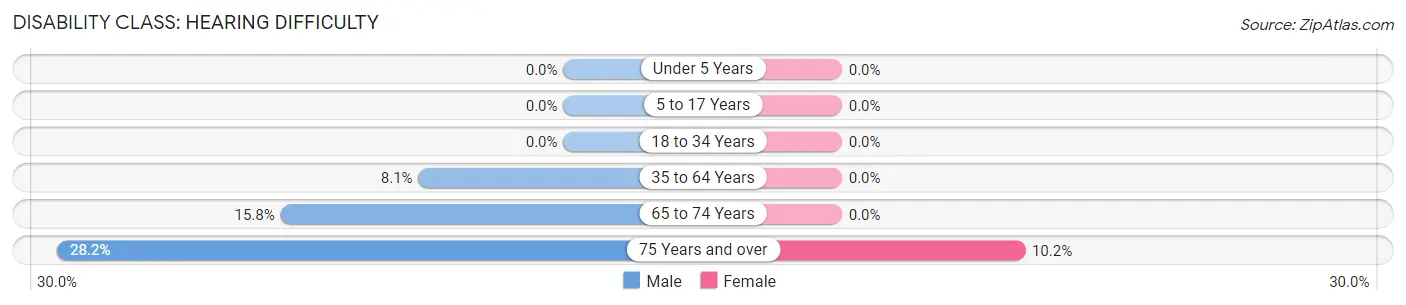
| Age Bracket | Male | Female |
| Under 5 Years | 0 (0.0%) | 0 (0.0%) |
| 5 to 17 Years | 0 (0.0%) | 0 (0.0%) |
| 18 to 34 Years | 0 (0.0%) | 0 (0.0%) |
| 35 to 64 Years | 31 (8.1%) | 0 (0.0%) |
| 65 to 74 Years | 23 (15.8%) | 0 (0.0%) |
| 75 Years and over | 42 (28.2%) | 10 (10.2%) |
Disability Class: Vision Difficulty

| Age Bracket | Male | Female |
| Under 5 Years | 0 (0.0%) | 0 (0.0%) |
| 5 to 17 Years | 0 (0.0%) | 0 (0.0%) |
| 18 to 34 Years | 0 (0.0%) | 0 (0.0%) |
| 35 to 64 Years | 42 (10.9%) | 38 (15.0%) |
| 65 to 74 Years | 0 (0.0%) | 0 (0.0%) |
| 75 Years and over | 0 (0.0%) | 0 (0.0%) |
Disability Class: Cognitive Difficulty
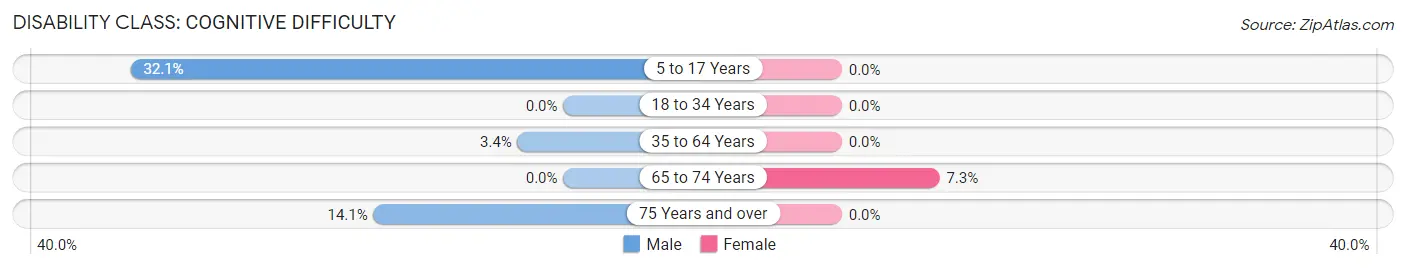
| Age Bracket | Male | Female |
| 5 to 17 Years | 18 (32.1%) | 0 (0.0%) |
| 18 to 34 Years | 0 (0.0%) | 0 (0.0%) |
| 35 to 64 Years | 13 (3.4%) | 0 (0.0%) |
| 65 to 74 Years | 0 (0.0%) | 25 (7.2%) |
| 75 Years and over | 21 (14.1%) | 0 (0.0%) |
Disability Class: Ambulatory Difficulty
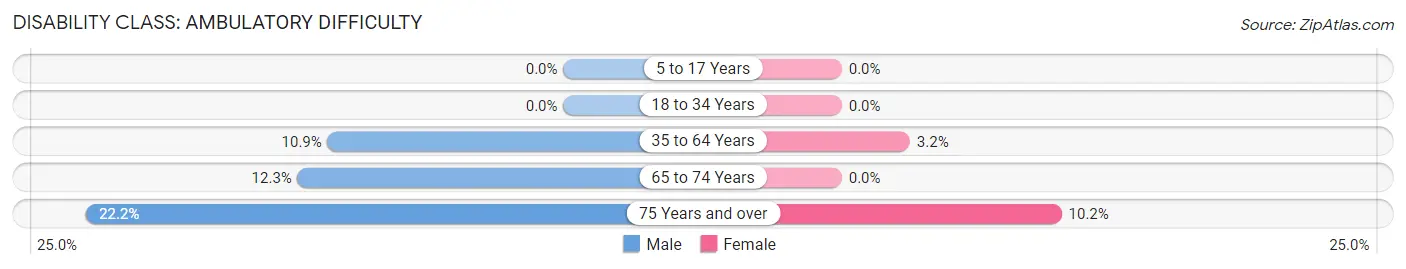
| Age Bracket | Male | Female |
| 5 to 17 Years | 0 (0.0%) | 0 (0.0%) |
| 18 to 34 Years | 0 (0.0%) | 0 (0.0%) |
| 35 to 64 Years | 42 (10.9%) | 8 (3.2%) |
| 65 to 74 Years | 18 (12.3%) | 0 (0.0%) |
| 75 Years and over | 33 (22.2%) | 10 (10.2%) |
Disability Class: Self-Care Difficulty
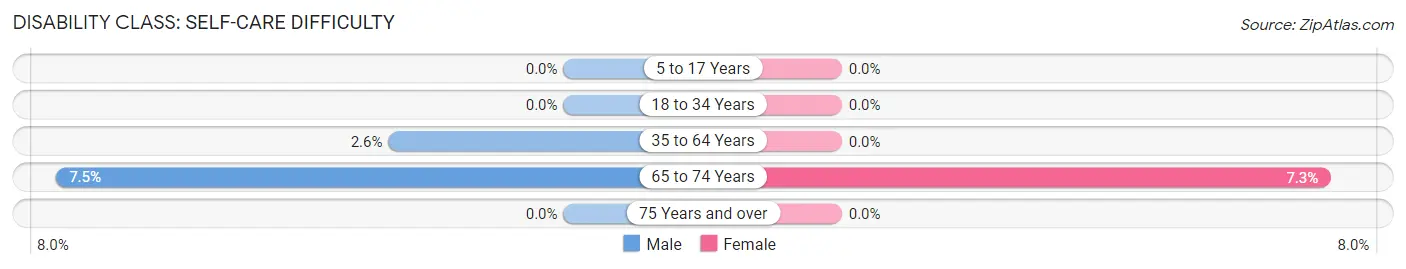
| Age Bracket | Male | Female |
| 5 to 17 Years | 0 (0.0%) | 0 (0.0%) |
| 18 to 34 Years | 0 (0.0%) | 0 (0.0%) |
| 35 to 64 Years | 10 (2.6%) | 0 (0.0%) |
| 65 to 74 Years | 11 (7.5%) | 25 (7.2%) |
| 75 Years and over | 0 (0.0%) | 0 (0.0%) |
Technology Access in Smith Valley
Computing Device Access in Smith Valley
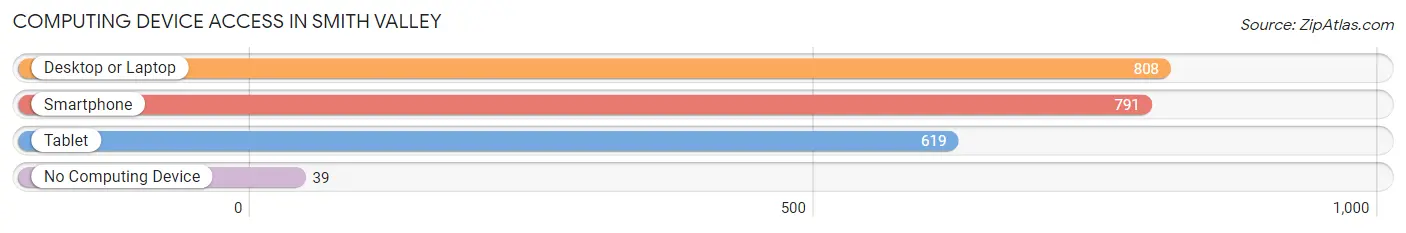
| Device Type | # Households | % Households |
| Desktop or Laptop | 808 | 91.9% |
| Smartphone | 791 | 90.0% |
| Tablet | 619 | 70.4% |
| No Computing Device | 39 | 4.4% |
| Total | 879 | 100.0% |
Internet Access in Smith Valley
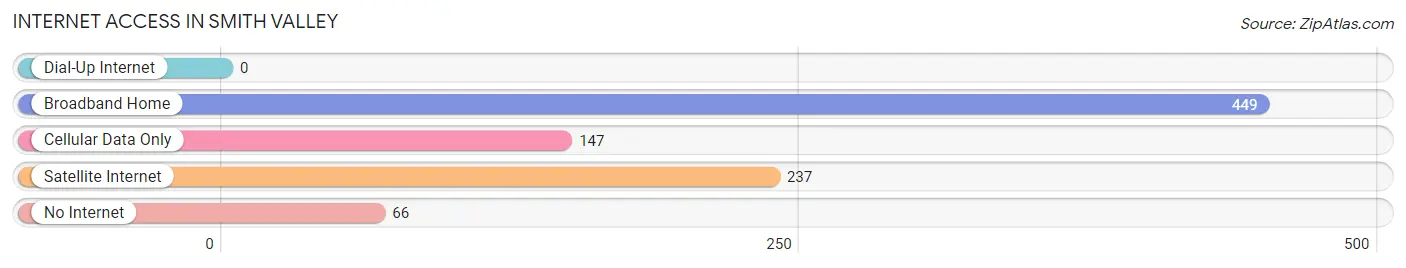
| Internet Type | # Households | % Households |
| Dial-Up Internet | 0 | 0.0% |
| Broadband Home | 449 | 51.1% |
| Cellular Data Only | 147 | 16.7% |
| Satellite Internet | 237 | 27.0% |
| No Internet | 66 | 7.5% |
| Total | 879 | 100.0% |
Smith Valley Summary
History
The small town of Smith Valley, Nevada is located in the western part of the state, about 30 miles south of Carson City. It is situated in the Smith Valley, a long, narrow valley that runs from the Sierra Nevada Mountains to the Carson Valley. The valley was named after the Smith family, who were among the first settlers in the area.
The first settlers in the area were Native Americans, who lived in the valley for thousands of years before the arrival of Europeans. The first Europeans to settle in the area were miners, who arrived in the late 1800s in search of gold and silver. The miners established several small towns in the valley, including Smith Valley.
The town of Smith Valley was founded in 1876 by William Smith, who had come to the area to prospect for gold. Smith built a small cabin and began to farm the land. He also opened a store and a post office, which helped to attract more settlers to the area.
By the early 1900s, Smith Valley had become a thriving community. The town had a school, a church, a hotel, and several stores. The town also had a newspaper, the Smith Valley News, which was published from 1906 to 1912.
The town continued to grow throughout the 20th century, and by the 2000 census, the population of Smith Valley was 1,093.
Geography
Smith Valley is located in western Nevada, in the Smith Valley, a long, narrow valley that runs from the Sierra Nevada Mountains to the Carson Valley. The valley is approximately 30 miles long and 5 miles wide, and is surrounded by mountains on all sides.
The town of Smith Valley is situated at the northern end of the valley, at an elevation of 4,400 feet. The town is located on the banks of the Walker River, which flows through the valley.
The climate in Smith Valley is semi-arid, with hot summers and cold winters. The average annual temperature is 54 degrees Fahrenheit, and the average annual precipitation is 8.5 inches.
Economy
The economy of Smith Valley is largely based on agriculture. The town is surrounded by irrigated farmland, and the main crops grown in the area are alfalfa, hay, and wheat.
The town also has several small businesses, including a grocery store, a hardware store, and a gas station. There is also a small casino in town, which attracts visitors from the surrounding area.
Demographics
As of the 2000 census, the population of Smith Valley was 1,093. The racial makeup of the town was 94.3% White, 0.7% African American, 0.7% Native American, 0.7% Asian, 0.1% Pacific Islander, 1.3% from other races, and 2.1% from two or more races. Hispanic or Latino of any race were 4.2% of the population.
The median income for a household in Smith Valley was $37,500, and the median income for a family was $41,250. The per capita income for the town was $17,845. About 11.2% of families and 13.2% of the population were below the poverty line, including 16.2% of those under age 18 and 8.3% of those age 65 or over.
Common Questions
What is Per Capita Income in Smith Valley?
Per Capita income in Smith Valley is $40,570.
What is the Median Family Income in Smith Valley?
Median Family Income in Smith Valley is $93,250.
What is the Median Household income in Smith Valley?
Median Household Income in Smith Valley is $49,226.
What is Income or Wage Gap in Smith Valley?
Income or Wage Gap in Smith Valley is 11.1%.
Women in Smith Valley earn 88.9 cents for every dollar earned by a man.
What is Family Income Deficit in Smith Valley?
Family Income Deficit in Smith Valley is $5,776.
Families that are below poverty line in Smith Valley earn $5,776 less on average than the poverty threshold level.
What is Inequality or Gini Index in Smith Valley?
Inequality or Gini Index in Smith Valley is 0.41.
What is the Total Population of Smith Valley?
Total Population of Smith Valley is 1,646.
What is the Total Male Population of Smith Valley?
Total Male Population of Smith Valley is 841.
What is the Total Female Population of Smith Valley?
Total Female Population of Smith Valley is 805.
What is the Ratio of Males per 100 Females in Smith Valley?
There are 104.47 Males per 100 Females in Smith Valley.
What is the Ratio of Females per 100 Males in Smith Valley?
There are 95.72 Females per 100 Males in Smith Valley.
What is the Median Population Age in Smith Valley?
Median Population Age in Smith Valley is 63.2 Years.
What is the Average Family Size in Smith Valley
Average Family Size in Smith Valley is 2.4 People.
What is the Average Household Size in Smith Valley
Average Household Size in Smith Valley is 1.9 People.
How Large is the Labor Force in Smith Valley?
There are 576 People in the Labor Forcein in Smith Valley.
What is the Percentage of People in the Labor Force in Smith Valley?
37.3% of People are in the Labor Force in Smith Valley.
What is the Unemployment Rate in Smith Valley?
Unemployment Rate in Smith Valley is 1.0%.