Lakeridge, NV Map & Demographics
Lakeridge Map
Lakeridge Overview
$87,363
PER CAPITA INCOME
$85,893
AVG FAMILY INCOME
$86,734
AVG HOUSEHOLD INCOME
0.50
INEQUALITY / GINI INDEX
278
TOTAL POPULATION
141
MALE POPULATION
137
FEMALE POPULATION
102.92
MALES / 100 FEMALES
97.16
FEMALES / 100 MALES
64.2
MEDIAN AGE
2.0
AVG FAMILY SIZE
1.8
AVG HOUSEHOLD SIZE
72
LABOR FORCE [ PEOPLE ]
27.2%
PERCENT IN LABOR FORCE
Income in Lakeridge
Income Overview in Lakeridge
Per Capita Income in Lakeridge is $87,363, while median incomes of families and households are $85,893 and $86,734 respectively.
| Characteristic | Number | Measure |
| Per Capita Income | 278 | $87,363 |
| Median Family Income | 106 | $85,893 |
| Mean Family Income | 106 | $126,168 |
| Median Household Income | 157 | $86,734 |
| Mean Household Income | 157 | $153,837 |
| Income Deficit | 106 | $0 |
| Wage / Income Gap (%) | 278 | 0.00% |
| Wage / Income Gap ($) | 278 | 100.00¢ per $1 |
| Gini / Inequality Index | 278 | 0.50 |
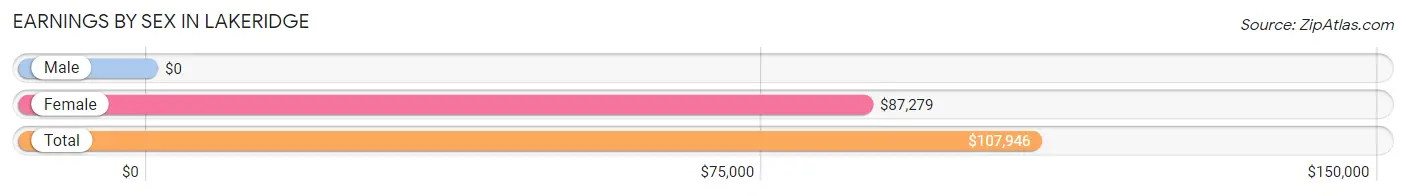
Earnings by Sex in Lakeridge
| Sex | Number | Average Earnings |
| Male | 13 (18.1%) | $0 |
| Female | 59 (81.9%) | $87,279 |
| Total | 72 (100.0%) | $107,946 |
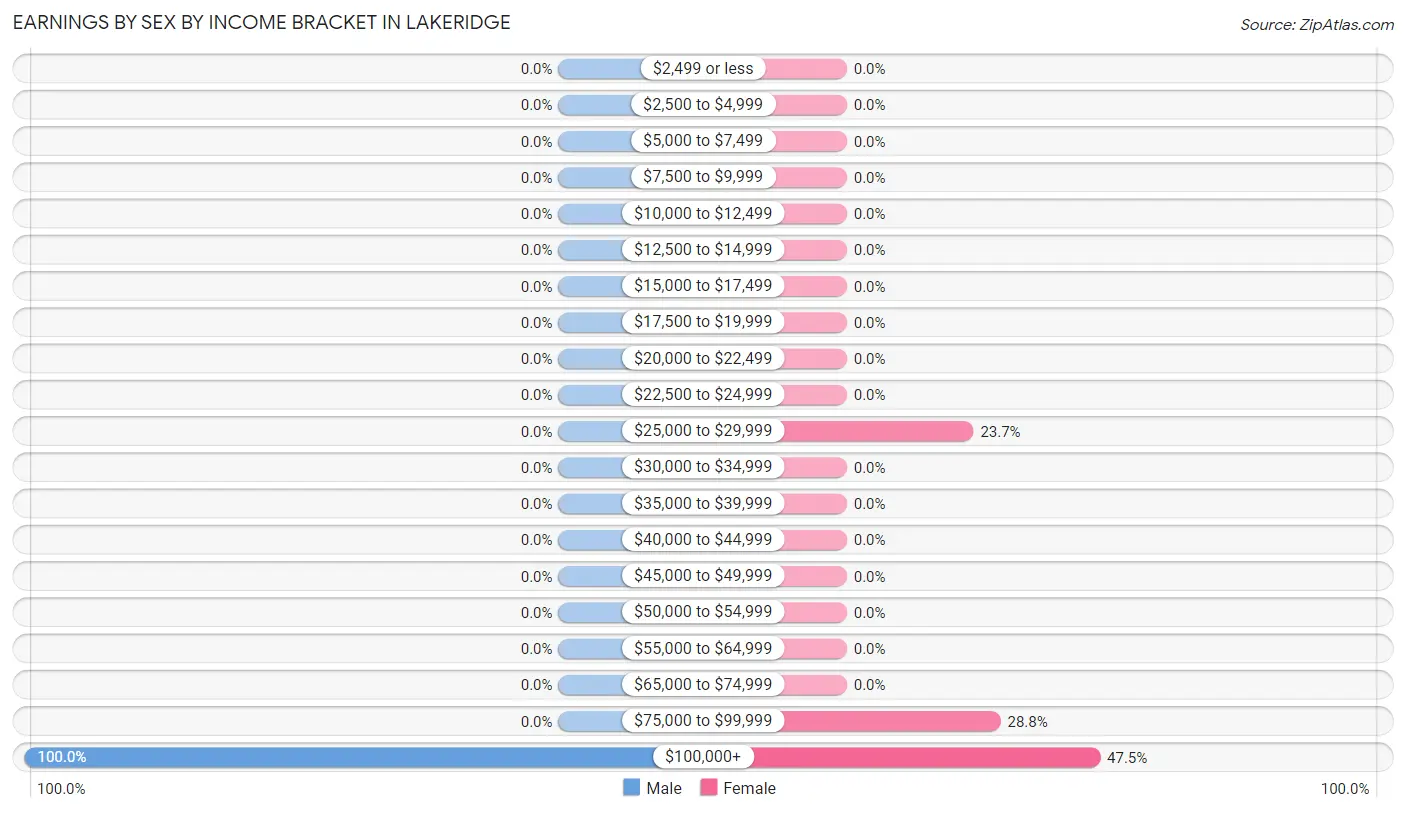
Earnings by Sex by Income Bracket in Lakeridge
The most common earnings brackets in Lakeridge are $100,000+ for men (13 | 100.0%) and $100,000+ for women (28 | 47.5%).
| Income | Male | Female |
| $2,499 or less | 0 (0.0%) | 0 (0.0%) |
| $2,500 to $4,999 | 0 (0.0%) | 0 (0.0%) |
| $5,000 to $7,499 | 0 (0.0%) | 0 (0.0%) |
| $7,500 to $9,999 | 0 (0.0%) | 0 (0.0%) |
| $10,000 to $12,499 | 0 (0.0%) | 0 (0.0%) |
| $12,500 to $14,999 | 0 (0.0%) | 0 (0.0%) |
| $15,000 to $17,499 | 0 (0.0%) | 0 (0.0%) |
| $17,500 to $19,999 | 0 (0.0%) | 0 (0.0%) |
| $20,000 to $22,499 | 0 (0.0%) | 0 (0.0%) |
| $22,500 to $24,999 | 0 (0.0%) | 0 (0.0%) |
| $25,000 to $29,999 | 0 (0.0%) | 14 (23.7%) |
| $30,000 to $34,999 | 0 (0.0%) | 0 (0.0%) |
| $35,000 to $39,999 | 0 (0.0%) | 0 (0.0%) |
| $40,000 to $44,999 | 0 (0.0%) | 0 (0.0%) |
| $45,000 to $49,999 | 0 (0.0%) | 0 (0.0%) |
| $50,000 to $54,999 | 0 (0.0%) | 0 (0.0%) |
| $55,000 to $64,999 | 0 (0.0%) | 0 (0.0%) |
| $65,000 to $74,999 | 0 (0.0%) | 0 (0.0%) |
| $75,000 to $99,999 | 0 (0.0%) | 17 (28.8%) |
| $100,000+ | 13 (100.0%) | 28 (47.5%) |
| Total | 13 (100.0%) | 59 (100.0%) |
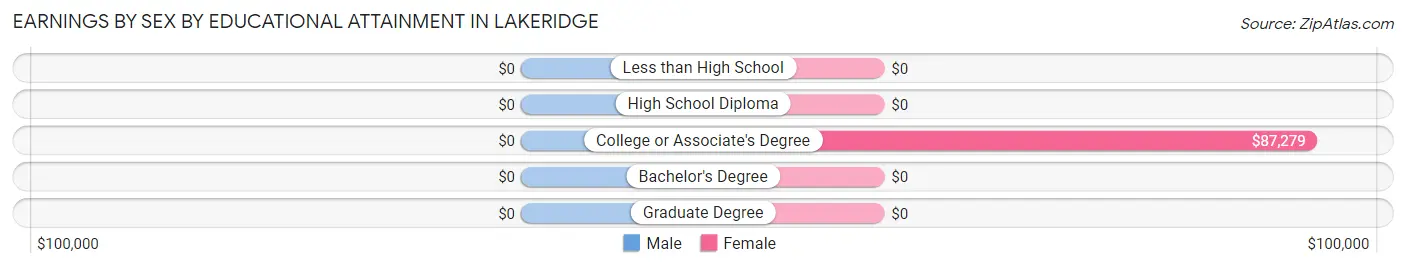
Earnings by Sex by Educational Attainment in Lakeridge
| Educational Attainment | Male Income | Female Income |
| Less than High School | - | - |
| High School Diploma | - | - |
| College or Associate's Degree | - | - |
| Bachelor's Degree | - | - |
| Graduate Degree | - | - |
| Total | - | - |
Family Income in Lakeridge
Family Income Brackets in Lakeridge
According to the Lakeridge family income data, there are 28 families falling into the $75,000 to $99,999 income range, which is the most common income bracket and makes up 26.4% of all families.
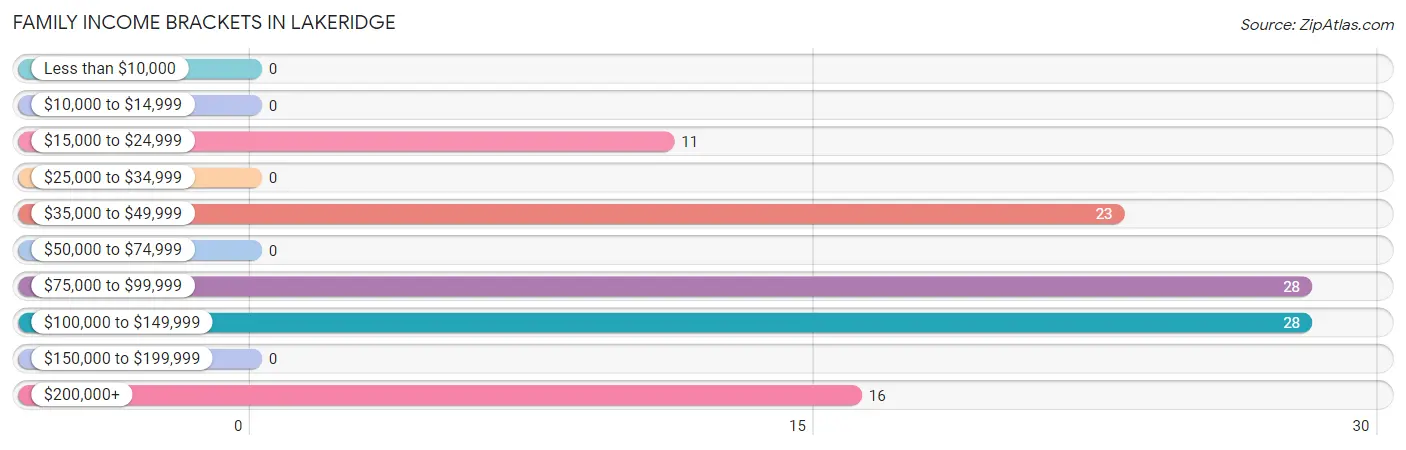
| Income Bracket | # Families | % Families |
| Less than $10,000 | 0 | 0.0% |
| $10,000 to $14,999 | 0 | 0.0% |
| $15,000 to $24,999 | 11 | 10.4% |
| $25,000 to $34,999 | 0 | 0.0% |
| $35,000 to $49,999 | 23 | 21.7% |
| $50,000 to $74,999 | 0 | 0.0% |
| $75,000 to $99,999 | 28 | 26.4% |
| $100,000 to $149,999 | 28 | 26.4% |
| $150,000 to $199,999 | 0 | 0.0% |
| $200,000+ | 16 | 15.1% |
Family Income by Famaliy Size in Lakeridge
2-person families (106 | 100.0%) account for the highest median family income in Lakeridge with $85,893 per family, while 2-person families (106 | 100.0%) have the highest median income of $42,946 per family member.
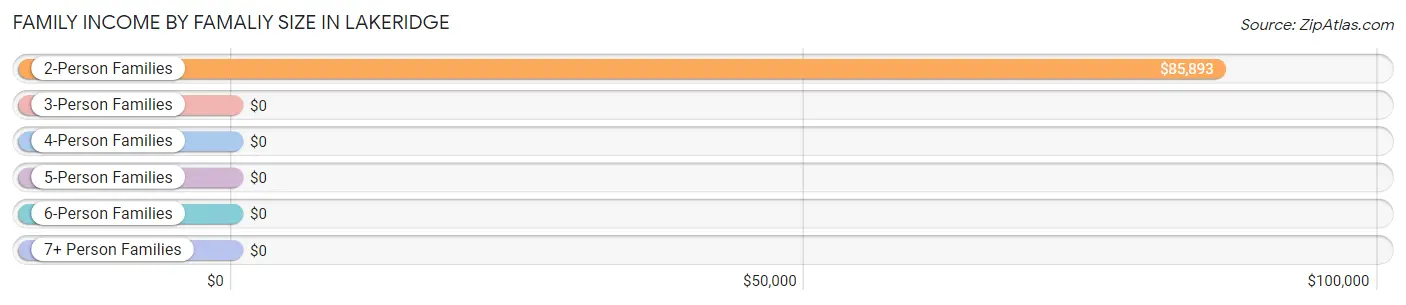
| Income Bracket | # Families | Median Income |
| 2-Person Families | 106 (100.0%) | $85,893 |
| 3-Person Families | 0 (0.0%) | $0 |
| 4-Person Families | 0 (0.0%) | $0 |
| 5-Person Families | 0 (0.0%) | $0 |
| 6-Person Families | 0 (0.0%) | $0 |
| 7+ Person Families | 0 (0.0%) | $0 |
| Total | 106 (100.0%) | $85,893 |
Family Income by Number of Earners in Lakeridge
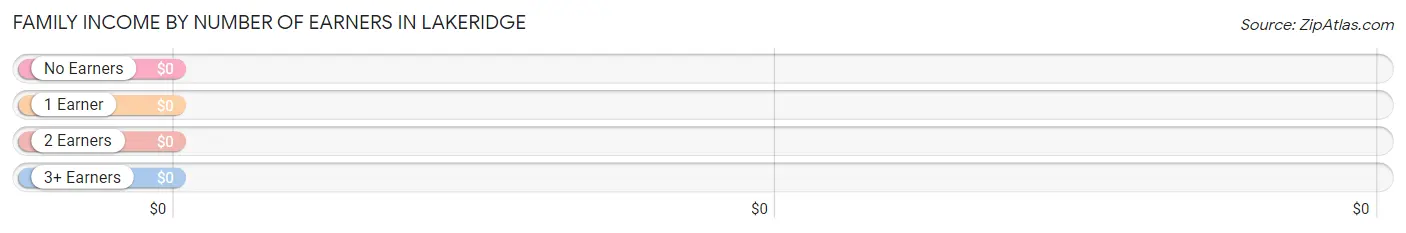
| Number of Earners | # Families | Median Income |
| No Earners | 64 (60.4%) | $0 |
| 1 Earner | 42 (39.6%) | $0 |
| 2 Earners | 0 (0.0%) | $0 |
| 3+ Earners | 0 (0.0%) | $0 |
| Total | 106 (100.0%) | $85,893 |
Household Income in Lakeridge
Household Income Brackets in Lakeridge
With 45 households falling in the category, the $75,000 to $99,999 income range is the most frequent in Lakeridge, accounting for 28.7% of all households.
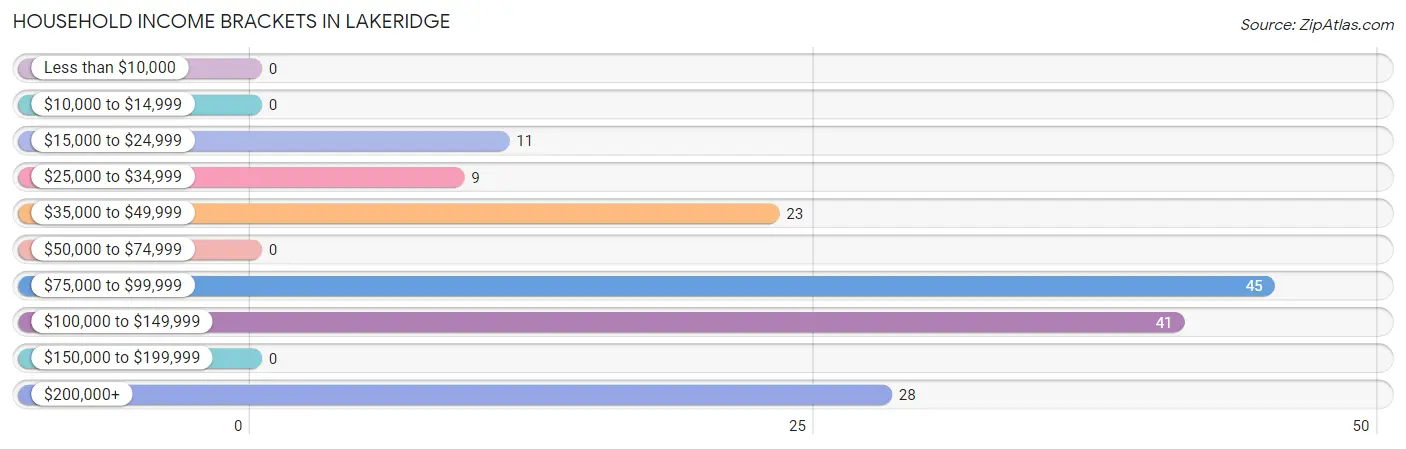
| Income Bracket | # Households | % Households |
| Less than $10,000 | 0 | 0.0% |
| $10,000 to $14,999 | 0 | 0.0% |
| $15,000 to $24,999 | 11 | 7.0% |
| $25,000 to $34,999 | 9 | 5.7% |
| $35,000 to $49,999 | 23 | 14.6% |
| $50,000 to $74,999 | 0 | 0.0% |
| $75,000 to $99,999 | 45 | 28.7% |
| $100,000 to $149,999 | 41 | 26.1% |
| $150,000 to $199,999 | 0 | 0.0% |
| $200,000+ | 28 | 17.8% |
Household Income by Householder Age in Lakeridge
The median household income in Lakeridge is $86,734, with the highest median household income of $250,001 found in the 65+ years age bracket for the primary householder. A total of 51 households (32.5%) fall into this category.
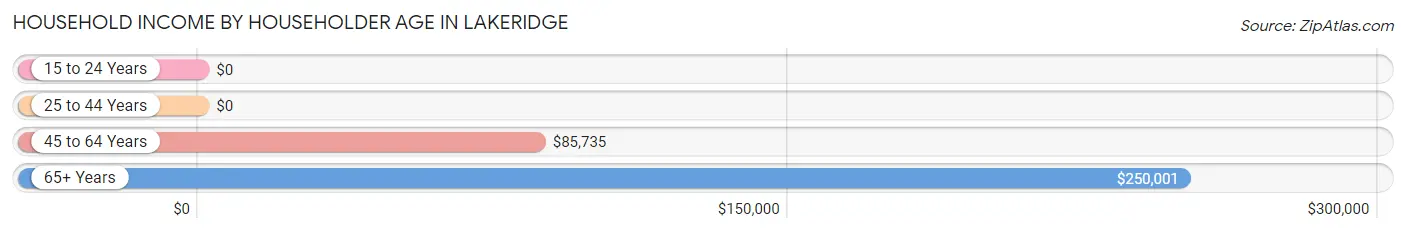
| Income Bracket | # Households | Median Income |
| 15 to 24 Years | 0 (0.0%) | $0 |
| 25 to 44 Years | 0 (0.0%) | $0 |
| 45 to 64 Years | 106 (67.5%) | $85,735 |
| 65+ Years | 51 (32.5%) | $250,001 |
| Total | 157 (100.0%) | $86,734 |
Poverty in Lakeridge
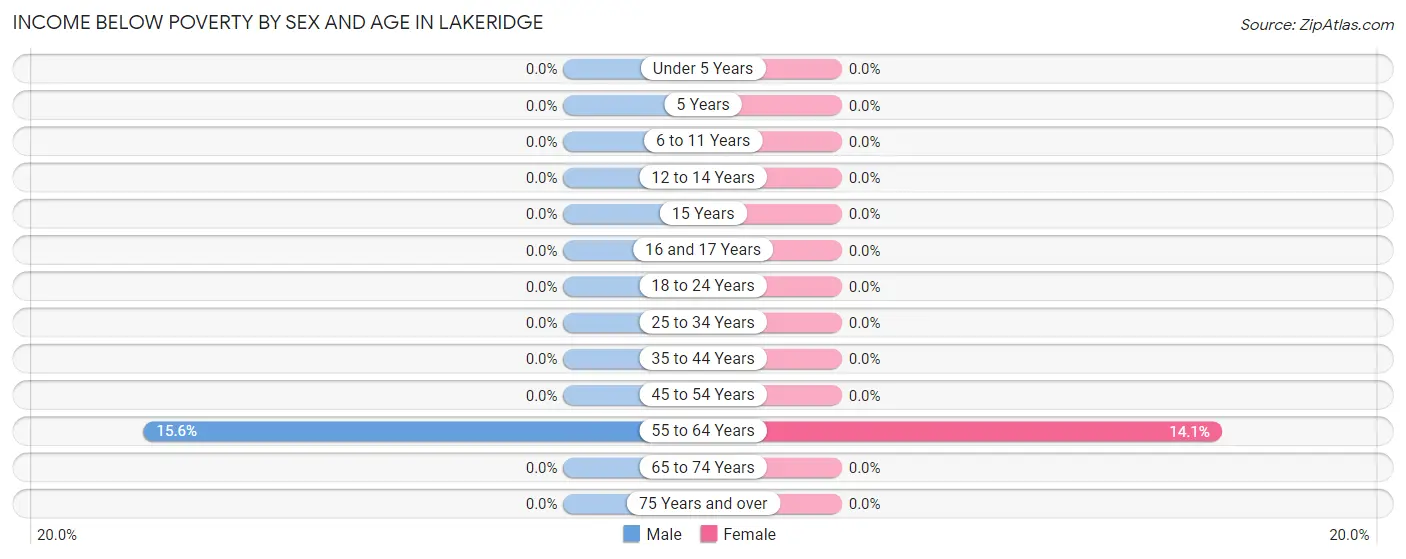
Income Below Poverty by Sex and Age in Lakeridge
With 8.5% poverty level for males and 8.0% for females among the residents of Lakeridge, 55 to 64 year old males and 55 to 64 year old females are the most vulnerable to poverty, with 12 males (15.6%) and 11 females (14.1%) in their respective age groups living below the poverty level.
| Age Bracket | Male | Female |
| Under 5 Years | 0 (0.0%) | 0 (0.0%) |
| 5 Years | 0 (0.0%) | 0 (0.0%) |
| 6 to 11 Years | 0 (0.0%) | 0 (0.0%) |
| 12 to 14 Years | 0 (0.0%) | 0 (0.0%) |
| 15 Years | 0 (0.0%) | 0 (0.0%) |
| 16 and 17 Years | 0 (0.0%) | 0 (0.0%) |
| 18 to 24 Years | 0 (0.0%) | 0 (0.0%) |
| 25 to 34 Years | 0 (0.0%) | 0 (0.0%) |
| 35 to 44 Years | 0 (0.0%) | 0 (0.0%) |
| 45 to 54 Years | 0 (0.0%) | 0 (0.0%) |
| 55 to 64 Years | 12 (15.6%) | 11 (14.1%) |
| 65 to 74 Years | 0 (0.0%) | 0 (0.0%) |
| 75 Years and over | 0 (0.0%) | 0 (0.0%) |
| Total | 12 (8.5%) | 11 (8.0%) |
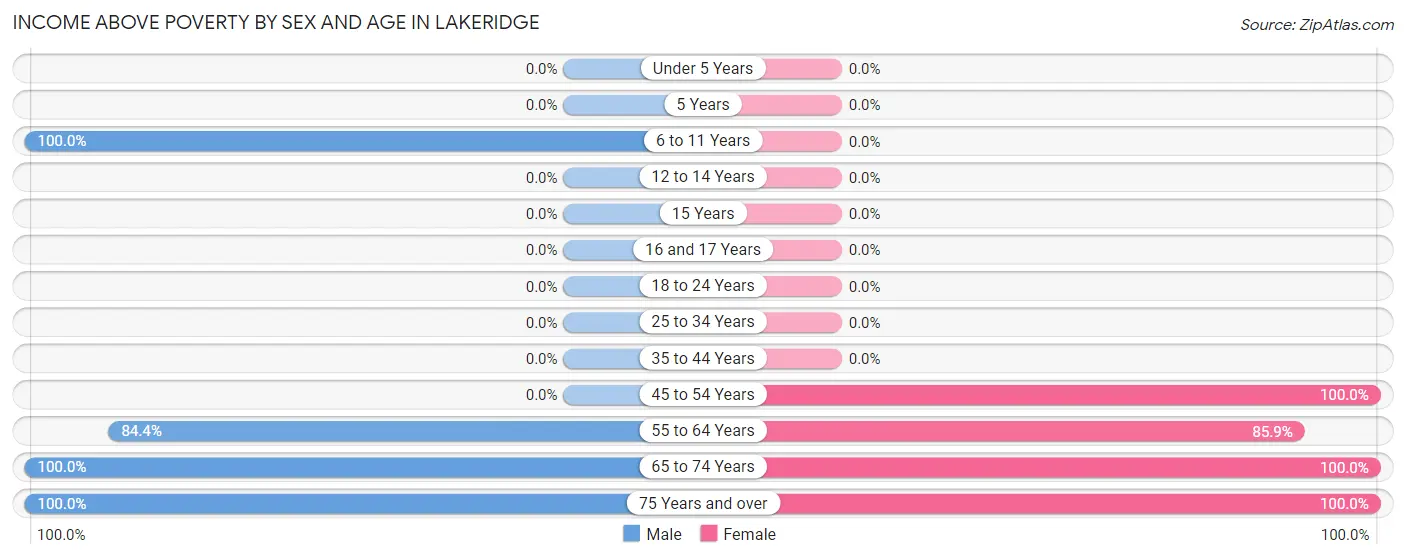
Income Above Poverty by Sex and Age in Lakeridge
According to the poverty statistics in Lakeridge, males aged 6 to 11 years and females aged 45 to 54 years are the age groups that are most secure financially, with 100.0% of males and 100.0% of females in these age groups living above the poverty line.
| Age Bracket | Male | Female |
| Under 5 Years | 0 (0.0%) | 0 (0.0%) |
| 5 Years | 0 (0.0%) | 0 (0.0%) |
| 6 to 11 Years | 13 (100.0%) | 0 (0.0%) |
| 12 to 14 Years | 0 (0.0%) | 0 (0.0%) |
| 15 Years | 0 (0.0%) | 0 (0.0%) |
| 16 and 17 Years | 0 (0.0%) | 0 (0.0%) |
| 18 to 24 Years | 0 (0.0%) | 0 (0.0%) |
| 25 to 34 Years | 0 (0.0%) | 0 (0.0%) |
| 35 to 44 Years | 0 (0.0%) | 0 (0.0%) |
| 45 to 54 Years | 0 (0.0%) | 14 (100.0%) |
| 55 to 64 Years | 65 (84.4%) | 67 (85.9%) |
| 65 to 74 Years | 21 (100.0%) | 32 (100.0%) |
| 75 Years and over | 30 (100.0%) | 13 (100.0%) |
| Total | 129 (91.5%) | 126 (92.0%) |
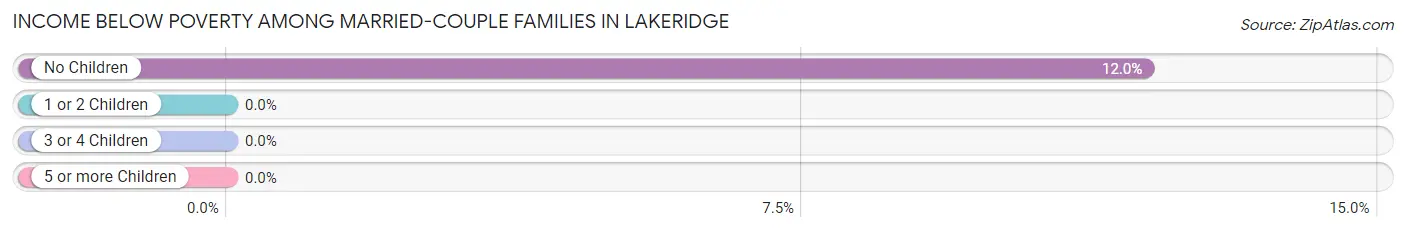
Income Below Poverty Among Married-Couple Families in Lakeridge
The poverty statistics for married-couple families in Lakeridge show that 12.0% or 11 of the total 92 families live below the poverty line. Families with no children have the highest poverty rate of 12.0%, comprising of 11 families. On the other hand, families with no children have the lowest poverty rate of 12.0%, which includes 11 families.
| Children | Above Poverty | Below Poverty |
| No Children | 81 (88.0%) | 11 (12.0%) |
| 1 or 2 Children | 0 (0.0%) | 0 (0.0%) |
| 3 or 4 Children | 0 (0.0%) | 0 (0.0%) |
| 5 or more Children | 0 (0.0%) | 0 (0.0%) |
| Total | 81 (88.0%) | 11 (12.0%) |
Income Below Poverty Among Single-Parent Households in Lakeridge
| Children | Single Father | Single Mother |
| No Children | 0 (0.0%) | 0 (0.0%) |
| 1 or 2 Children | 0 (0.0%) | 0 (0.0%) |
| 3 or 4 Children | 0 (0.0%) | 0 (0.0%) |
| 5 or more Children | 0 (0.0%) | 0 (0.0%) |
| Total | 0 (0.0%) | 0 (0.0%) |
Income Below Poverty Among Married-Couple vs Single-Parent Households in Lakeridge
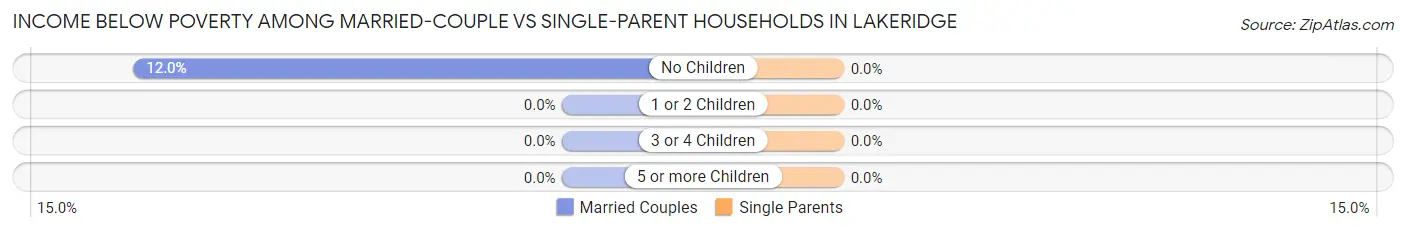
| Children | Married-Couple Families | Single-Parent Households |
| No Children | 11 (12.0%) | 0 (0.0%) |
| 1 or 2 Children | 0 (0.0%) | 0 (0.0%) |
| 3 or 4 Children | 0 (0.0%) | 0 (0.0%) |
| 5 or more Children | 0 (0.0%) | 0 (0.0%) |
| Total | 11 (12.0%) | 0 (0.0%) |
Race in Lakeridge
The most populous races in Lakeridge are White / Caucasian (252 | 90.6%), Asian (13 | 4.7%), and Hispanic or Latino (13 | 4.7%).
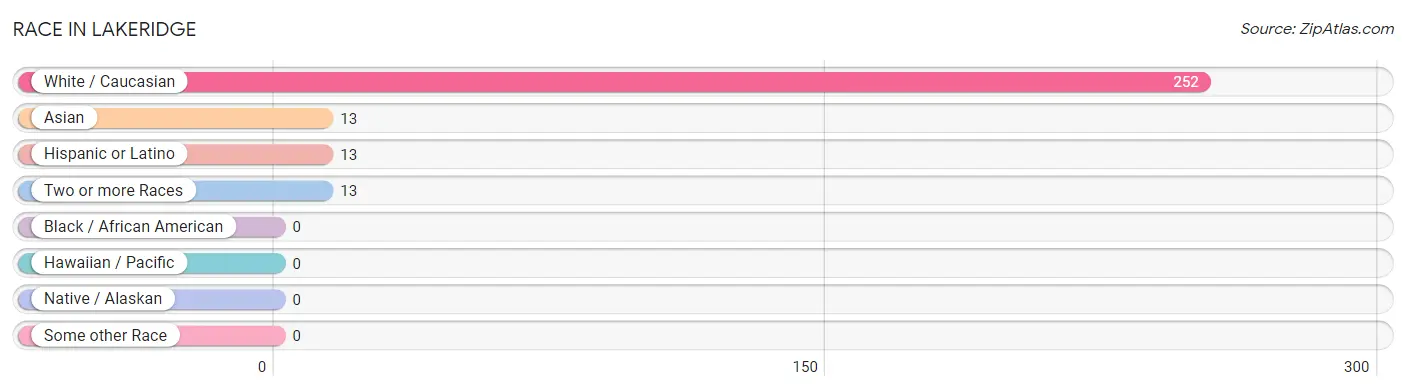
| Race | # Population | % Population |
| Asian | 13 | 4.7% |
| Black / African American | 0 | 0.0% |
| Hawaiian / Pacific | 0 | 0.0% |
| Hispanic or Latino | 13 | 4.7% |
| Native / Alaskan | 0 | 0.0% |
| White / Caucasian | 252 | 90.6% |
| Two or more Races | 13 | 4.7% |
| Some other Race | 0 | 0.0% |
| Total | 278 | 100.0% |
Ancestry in Lakeridge
The most populous ancestries reported in Lakeridge are German (70 | 25.2%), Irish (64 | 23.0%), Italian (38 | 13.7%), English (36 | 13.0%), and American (25 | 9.0%), together accounting for 83.8% of all Lakeridge residents.
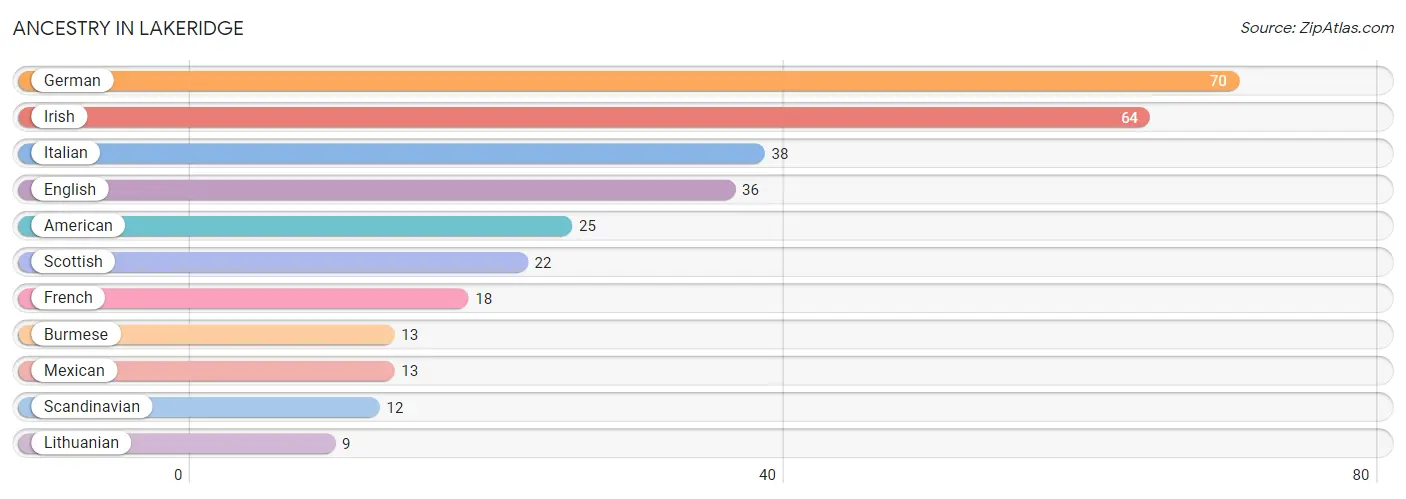
| Ancestry | # Population | % Population |
| American | 25 | 9.0% |
| Burmese | 13 | 4.7% |
| English | 36 | 13.0% |
| French | 18 | 6.5% |
| German | 70 | 25.2% |
| Irish | 64 | 23.0% |
| Italian | 38 | 13.7% |
| Lithuanian | 9 | 3.2% |
| Mexican | 13 | 4.7% |
| Scandinavian | 12 | 4.3% |
| Scottish | 22 | 7.9% | View All 11 Rows |
Immigrants in Lakeridge
The most numerous immigrant groups reported in Lakeridge came from Asia (13 | 4.7%), Eastern Asia (13 | 4.7%), and Korea (13 | 4.7%), together accounting for 14.0% of all Lakeridge residents.
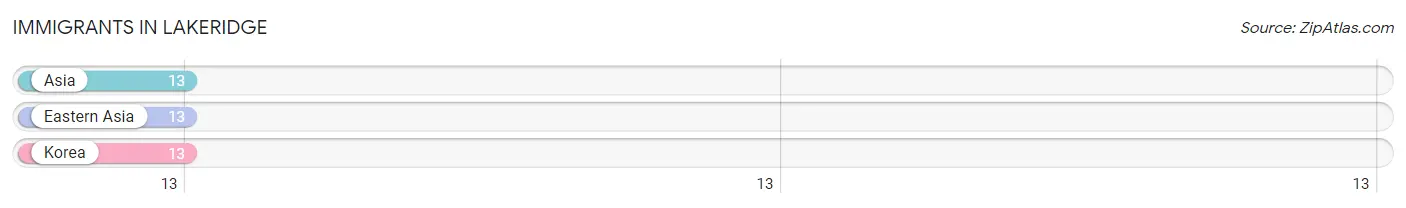
| Immigration Origin | # Population | % Population |
| Asia | 13 | 4.7% |
| Eastern Asia | 13 | 4.7% |
| Korea | 13 | 4.7% | View All 3 Rows |
Sex and Age in Lakeridge
Sex and Age in Lakeridge
The most populous age groups in Lakeridge are 60 to 64 Years (64 | 45.4%) for men and 60 to 64 Years (61 | 44.5%) for women.
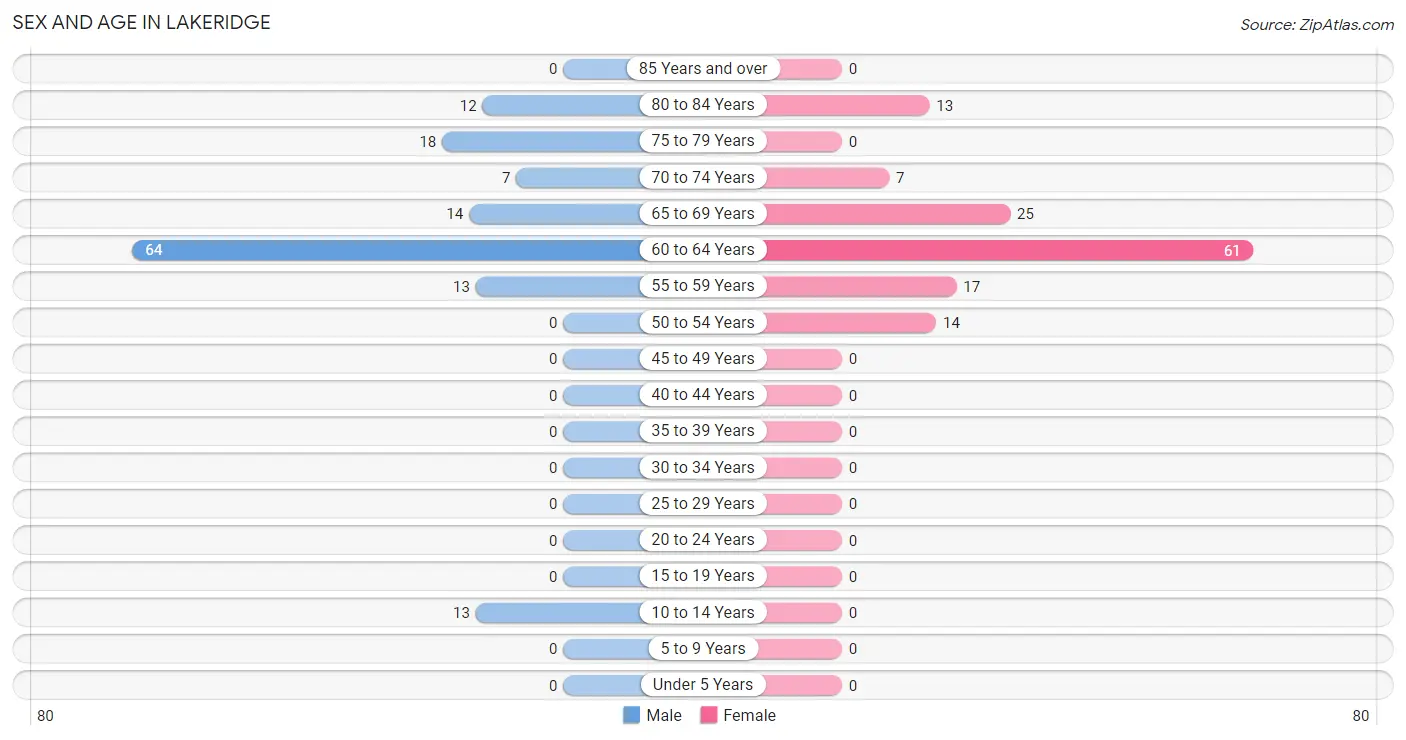
| Age Bracket | Male | Female |
| Under 5 Years | 0 (0.0%) | 0 (0.0%) |
| 5 to 9 Years | 0 (0.0%) | 0 (0.0%) |
| 10 to 14 Years | 13 (9.2%) | 0 (0.0%) |
| 15 to 19 Years | 0 (0.0%) | 0 (0.0%) |
| 20 to 24 Years | 0 (0.0%) | 0 (0.0%) |
| 25 to 29 Years | 0 (0.0%) | 0 (0.0%) |
| 30 to 34 Years | 0 (0.0%) | 0 (0.0%) |
| 35 to 39 Years | 0 (0.0%) | 0 (0.0%) |
| 40 to 44 Years | 0 (0.0%) | 0 (0.0%) |
| 45 to 49 Years | 0 (0.0%) | 0 (0.0%) |
| 50 to 54 Years | 0 (0.0%) | 14 (10.2%) |
| 55 to 59 Years | 13 (9.2%) | 17 (12.4%) |
| 60 to 64 Years | 64 (45.4%) | 61 (44.5%) |
| 65 to 69 Years | 14 (9.9%) | 25 (18.2%) |
| 70 to 74 Years | 7 (5.0%) | 7 (5.1%) |
| 75 to 79 Years | 18 (12.8%) | 0 (0.0%) |
| 80 to 84 Years | 12 (8.5%) | 13 (9.5%) |
| 85 Years and over | 0 (0.0%) | 0 (0.0%) |
| Total | 141 (100.0%) | 137 (100.0%) |
Families and Households in Lakeridge
Median Family Size in Lakeridge
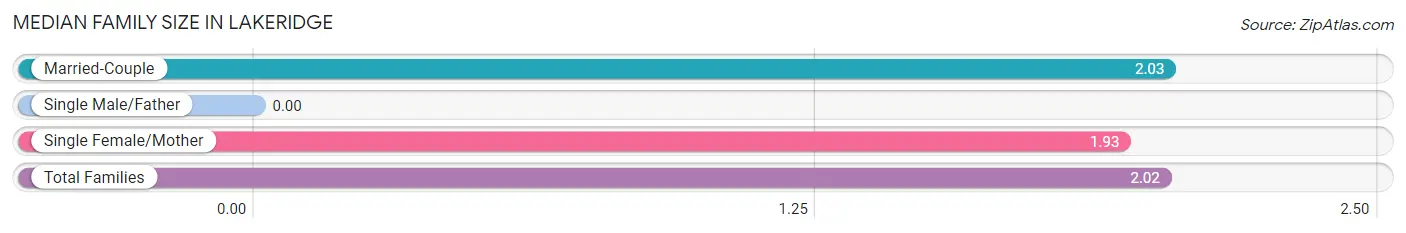
| Family Type | # Families | Family Size |
| Married-Couple | 92 (86.8%) | 2.03 |
| Single Male/Father | 0 (0.0%) | - |
| Single Female/Mother | 14 (13.2%) | 1.93 |
| Total Families | 106 (100.0%) | 2.02 |
Median Household Size in Lakeridge
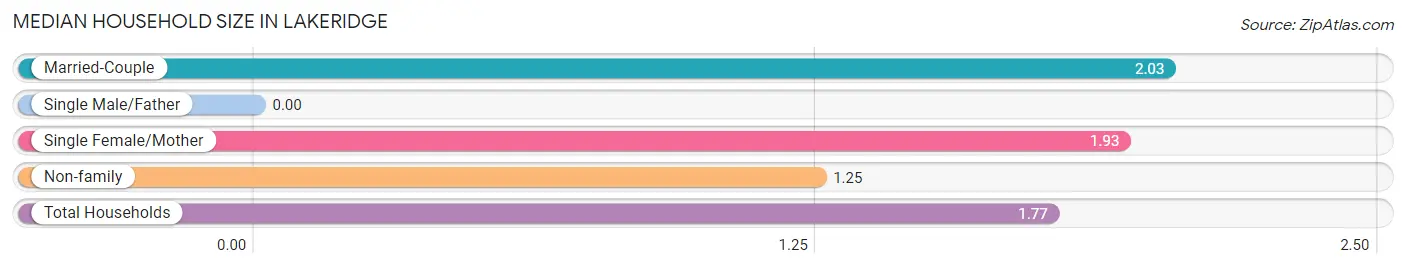
| Household Type | # Households | Household Size |
| Married-Couple | 92 (58.6%) | 2.03 |
| Single Male/Father | 0 (0.0%) | - |
| Single Female/Mother | 14 (8.9%) | 1.93 |
| Non-family | 51 (32.5%) | 1.25 |
| Total Households | 157 (100.0%) | 1.77 |
Household Size by Marriage Status in Lakeridge
Out of a total of 157 households in Lakeridge, 106 (67.5%) are family households, while 51 (32.5%) are nonfamily households. The most numerous type of family households are 2-person households, comprising 106, and the most common type of nonfamily households are 1-person households, comprising 39.
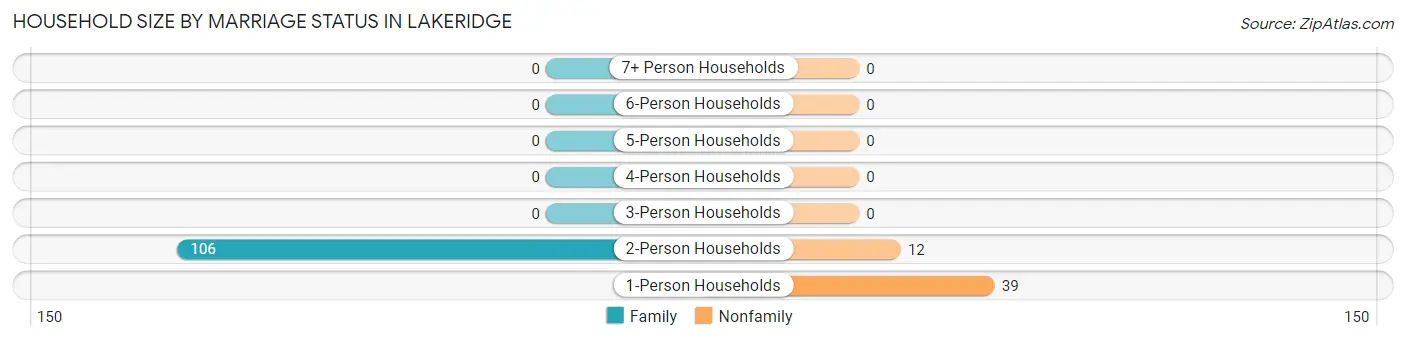
| Household Size | Family Households | Nonfamily Households |
| 1-Person Households | - | 39 (24.8%) |
| 2-Person Households | 106 (67.5%) | 12 (7.6%) |
| 3-Person Households | 0 (0.0%) | 0 (0.0%) |
| 4-Person Households | 0 (0.0%) | 0 (0.0%) |
| 5-Person Households | 0 (0.0%) | 0 (0.0%) |
| 6-Person Households | 0 (0.0%) | 0 (0.0%) |
| 7+ Person Households | 0 (0.0%) | 0 (0.0%) |
| Total | 106 (67.5%) | 51 (32.5%) |
Female Fertility in Lakeridge
Fertility by Age in Lakeridge
| Age Bracket | Women with Births | Births / 1,000 Women |
| 15 to 19 years | 0 (0.0%) | 0.0 |
| 20 to 34 years | 0 (0.0%) | 0.0 |
| 35 to 50 years | 0 (0.0%) | 0.0 |
| Total | 0 (0.0%) | 0.0 |
Fertility by Age by Marriage Status in Lakeridge
| Age Bracket | Married | Unmarried |
| 15 to 19 years | 0 (0.0%) | 0 (0.0%) |
| 20 to 34 years | 0 (0.0%) | 0 (0.0%) |
| 35 to 50 years | 0 (0.0%) | 0 (0.0%) |
| Total | 0 (0.0%) | 0 (0.0%) |
Fertility by Education in Lakeridge
| Educational Attainment | Women with Births | Births / 1,000 Women |
| Less than High School | 0 (0.0%) | 0.0 |
| High School Diploma | 0 (0.0%) | 0.0 |
| College or Associate's Degree | 0 (0.0%) | 0.0 |
| Bachelor's Degree | 0 (0.0%) | 0.0 |
| Graduate Degree | 0 (0.0%) | 0.0 |
| Total | 0 (0.0%) | 0.0 |
Fertility by Education by Marriage Status in Lakeridge
| Educational Attainment | Married | Unmarried |
| Less than High School | 0 (0.0%) | 0 (0.0%) |
| High School Diploma | 0 (0.0%) | 0 (0.0%) |
| College or Associate's Degree | 0 (0.0%) | 0 (0.0%) |
| Bachelor's Degree | 0 (0.0%) | 0 (0.0%) |
| Graduate Degree | 0 (0.0%) | 0 (0.0%) |
| Total | 0 (0.0%) | 0 (0.0%) |
Employment Characteristics in Lakeridge
Employment by Class of Employer in Lakeridge
Among the 58 employed individuals in Lakeridge, private company employees (41 | 70.7%), and self-employed (incorporated) (17 | 29.3%) make up the most common classes of employment.
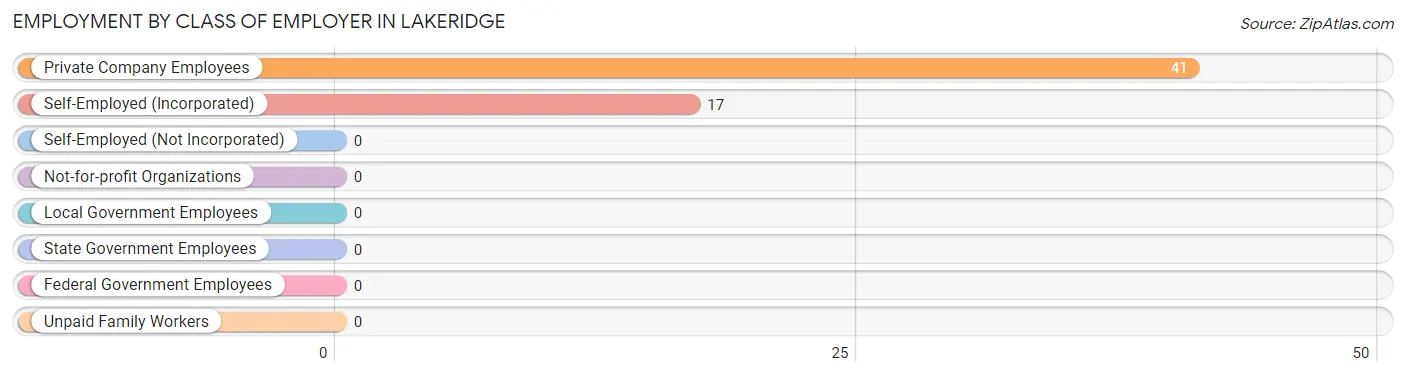
| Employer Class | # Employees | % Employees |
| Private Company Employees | 41 | 70.7% |
| Self-Employed (Incorporated) | 17 | 29.3% |
| Self-Employed (Not Incorporated) | 0 | 0.0% |
| Not-for-profit Organizations | 0 | 0.0% |
| Local Government Employees | 0 | 0.0% |
| State Government Employees | 0 | 0.0% |
| Federal Government Employees | 0 | 0.0% |
| Unpaid Family Workers | 0 | 0.0% |
| Total | 58 | 100.0% |
Employment Status by Age in Lakeridge
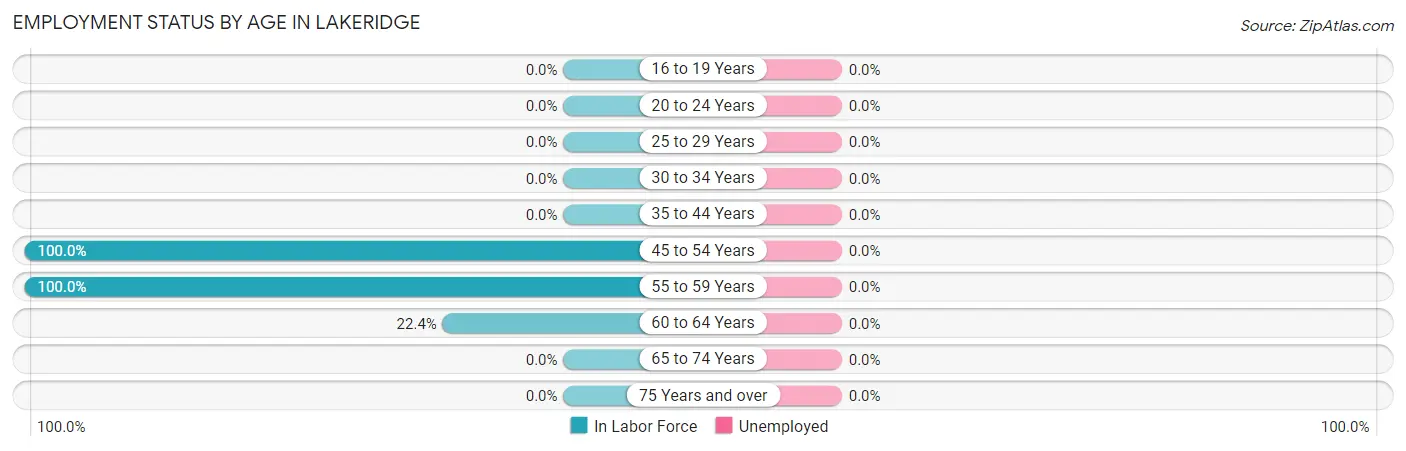
| Age Bracket | In Labor Force | Unemployed |
| 16 to 19 Years | 0 (0.0%) | 0 (0.0%) |
| 20 to 24 Years | 0 (0.0%) | 0 (0.0%) |
| 25 to 29 Years | 0 (0.0%) | 0 (0.0%) |
| 30 to 34 Years | 0 (0.0%) | 0 (0.0%) |
| 35 to 44 Years | 0 (0.0%) | 0 (0.0%) |
| 45 to 54 Years | 14 (100.0%) | 0 (0.0%) |
| 55 to 59 Years | 30 (100.0%) | 0 (0.0%) |
| 60 to 64 Years | 28 (22.4%) | 0 (0.0%) |
| 65 to 74 Years | 0 (0.0%) | 0 (0.0%) |
| 75 Years and over | 0 (0.0%) | 0 (0.0%) |
| Total | 72 (27.2%) | 0 (0.0%) |
Employment Status by Educational Attainment in Lakeridge
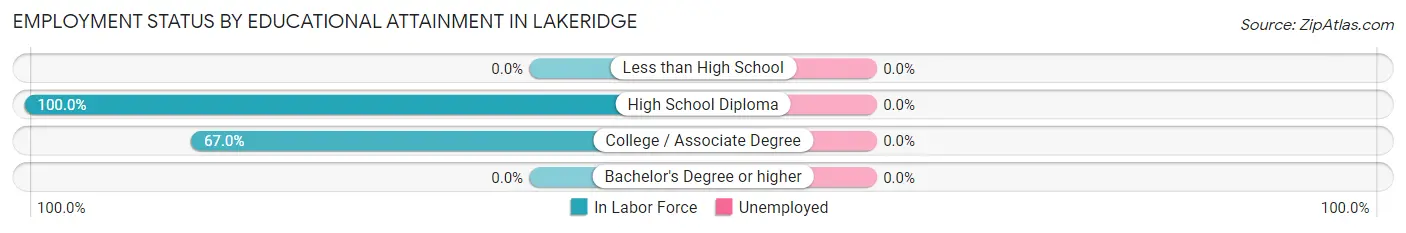
| Educational Attainment | In Labor Force | Unemployed |
| Less than High School | 0 (0.0%) | 0 (0.0%) |
| High School Diploma | 13 (100.0%) | 0 (0.0%) |
| College / Associate Degree | 59 (67.0%) | 0 (0.0%) |
| Bachelor's Degree or higher | 0 (0.0%) | 0 (0.0%) |
| Total | 72 (42.6%) | 0 (0.0%) |
Employment Occupations by Sex in Lakeridge
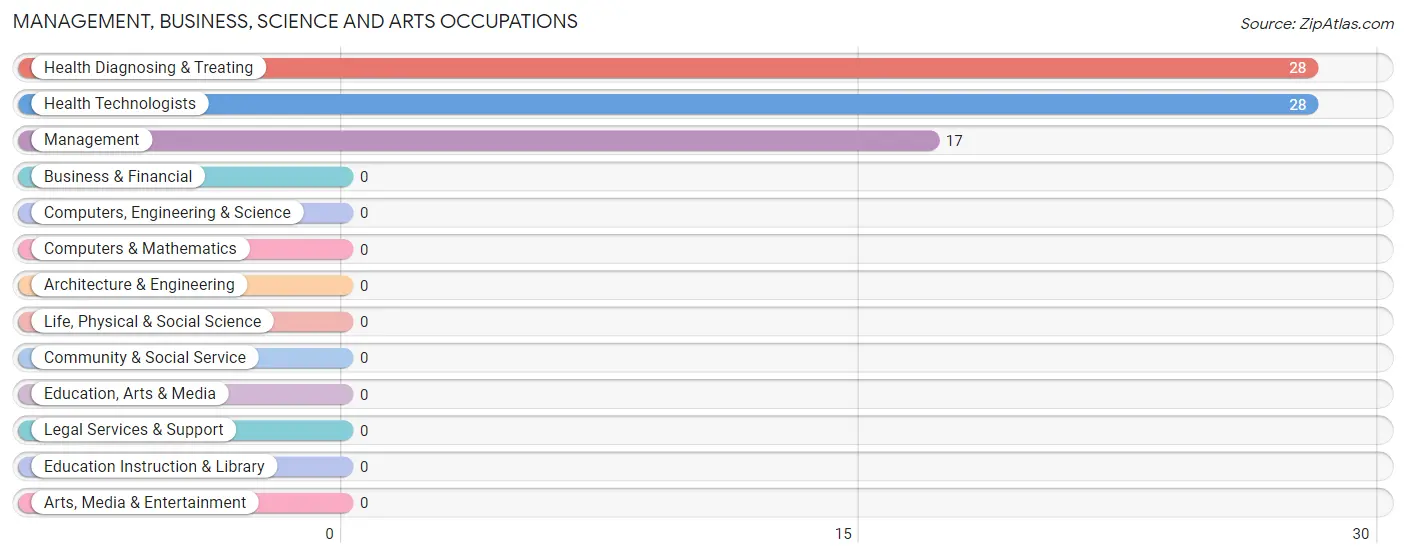
Management, Business, Science and Arts Occupations
The most common Management, Business, Science and Arts occupations in Lakeridge are Health Diagnosing & Treating (28 | 38.9%), Health Technologists (28 | 38.9%), and Management (17 | 23.6%).
Management, Business, Science and Arts Occupations by Sex
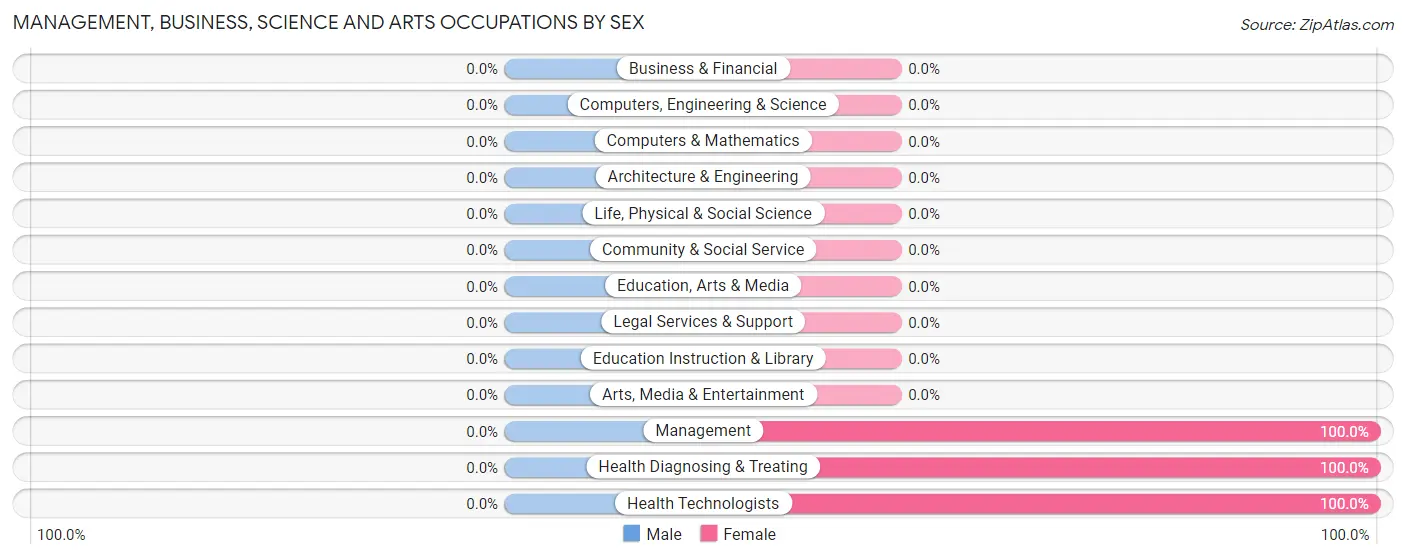
| Occupation | Male | Female |
| Management | 0 (0.0%) | 17 (100.0%) |
| Business & Financial | 0 (0.0%) | 0 (0.0%) |
| Computers, Engineering & Science | 0 (0.0%) | 0 (0.0%) |
| Computers & Mathematics | 0 (0.0%) | 0 (0.0%) |
| Architecture & Engineering | 0 (0.0%) | 0 (0.0%) |
| Life, Physical & Social Science | 0 (0.0%) | 0 (0.0%) |
| Community & Social Service | 0 (0.0%) | 0 (0.0%) |
| Education, Arts & Media | 0 (0.0%) | 0 (0.0%) |
| Legal Services & Support | 0 (0.0%) | 0 (0.0%) |
| Education Instruction & Library | 0 (0.0%) | 0 (0.0%) |
| Arts, Media & Entertainment | 0 (0.0%) | 0 (0.0%) |
| Health Diagnosing & Treating | 0 (0.0%) | 28 (100.0%) |
| Health Technologists | 0 (0.0%) | 28 (100.0%) |
| Total (Category) | 0 (0.0%) | 45 (100.0%) |
| Total (Overall) | 13 (18.1%) | 59 (81.9%) |
Services Occupations
Services Occupations by Sex
| Occupation | Male | Female |
| Healthcare Support | 0 (0.0%) | 0 (0.0%) |
| Security & Protection | 0 (0.0%) | 0 (0.0%) |
| Firefighting & Prevention | 0 (0.0%) | 0 (0.0%) |
| Law Enforcement | 0 (0.0%) | 0 (0.0%) |
| Food Preparation & Serving | 0 (0.0%) | 0 (0.0%) |
| Cleaning & Maintenance | 0 (0.0%) | 0 (0.0%) |
| Personal Care & Service | 0 (0.0%) | 0 (0.0%) |
| Total (Category) | 0 (0.0%) | 0 (0.0%) |
| Total (Overall) | 13 (18.1%) | 59 (81.9%) |
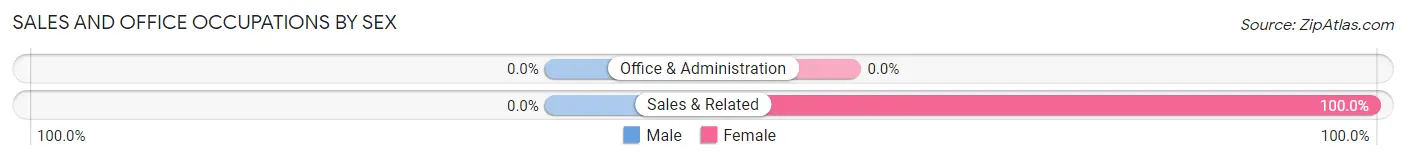
Sales and Office Occupations
The most common Sales and Office occupations in Lakeridge are , and Sales & Related (14 | 19.4%).
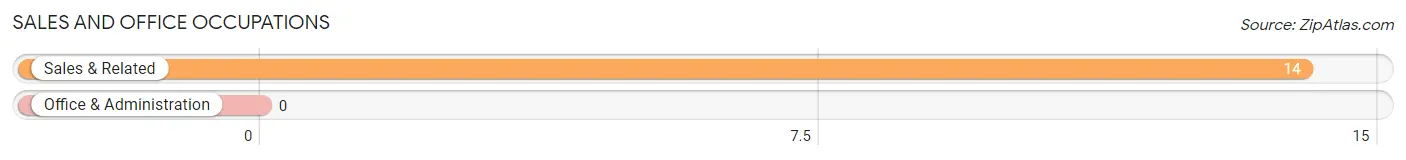
Sales and Office Occupations by Sex
| Occupation | Male | Female |
| Sales & Related | 0 (0.0%) | 14 (100.0%) |
| Office & Administration | 0 (0.0%) | 0 (0.0%) |
| Total (Category) | 0 (0.0%) | 14 (100.0%) |
| Total (Overall) | 13 (18.1%) | 59 (81.9%) |
Natural Resources, Construction and Maintenance Occupations
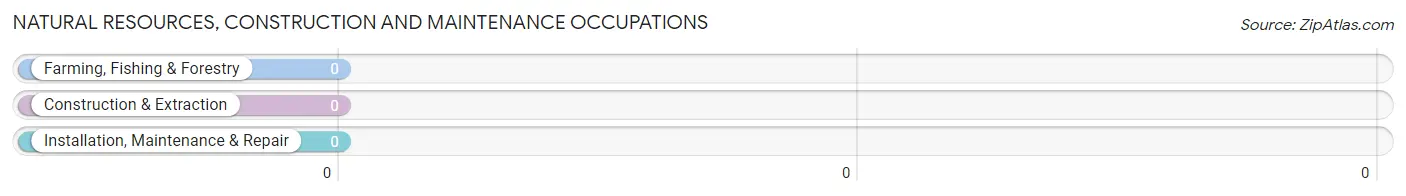
Natural Resources, Construction and Maintenance Occupations by Sex
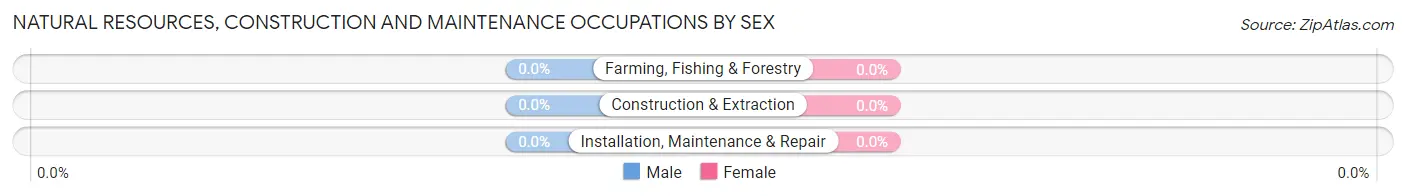
| Occupation | Male | Female |
| Farming, Fishing & Forestry | 0 (0.0%) | 0 (0.0%) |
| Construction & Extraction | 0 (0.0%) | 0 (0.0%) |
| Installation, Maintenance & Repair | 0 (0.0%) | 0 (0.0%) |
| Total (Category) | 0 (0.0%) | 0 (0.0%) |
| Total (Overall) | 13 (18.1%) | 59 (81.9%) |
Production, Transportation and Moving Occupations
The most common Production, Transportation and Moving occupations in Lakeridge are , and Transportation (13 | 18.1%).
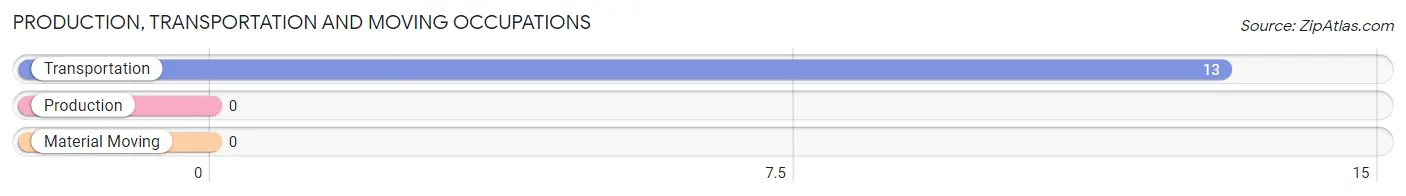
Production, Transportation and Moving Occupations by Sex
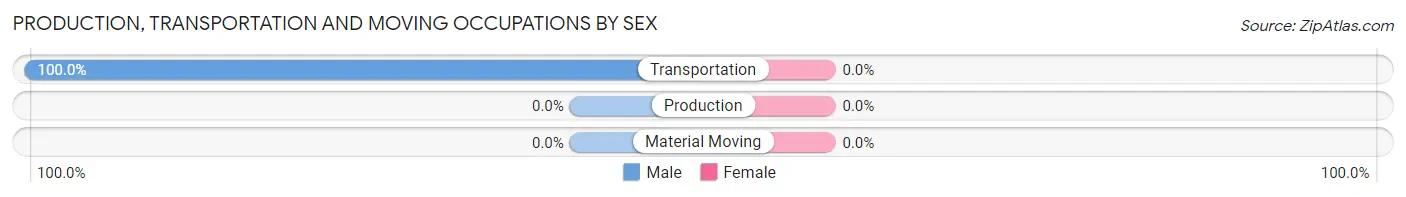
| Occupation | Male | Female |
| Production | 0 (0.0%) | 0 (0.0%) |
| Transportation | 13 (100.0%) | 0 (0.0%) |
| Material Moving | 0 (0.0%) | 0 (0.0%) |
| Total (Category) | 13 (100.0%) | 0 (0.0%) |
| Total (Overall) | 13 (18.1%) | 59 (81.9%) |
Employment Industries by Sex in Lakeridge
Employment Industries in Lakeridge
The major employment industries in Lakeridge include Health Care & Social Assistance (28 | 38.9%), Real Estate, Rental & Leasing (17 | 23.6%), and Transportation & Warehousing (13 | 18.1%).
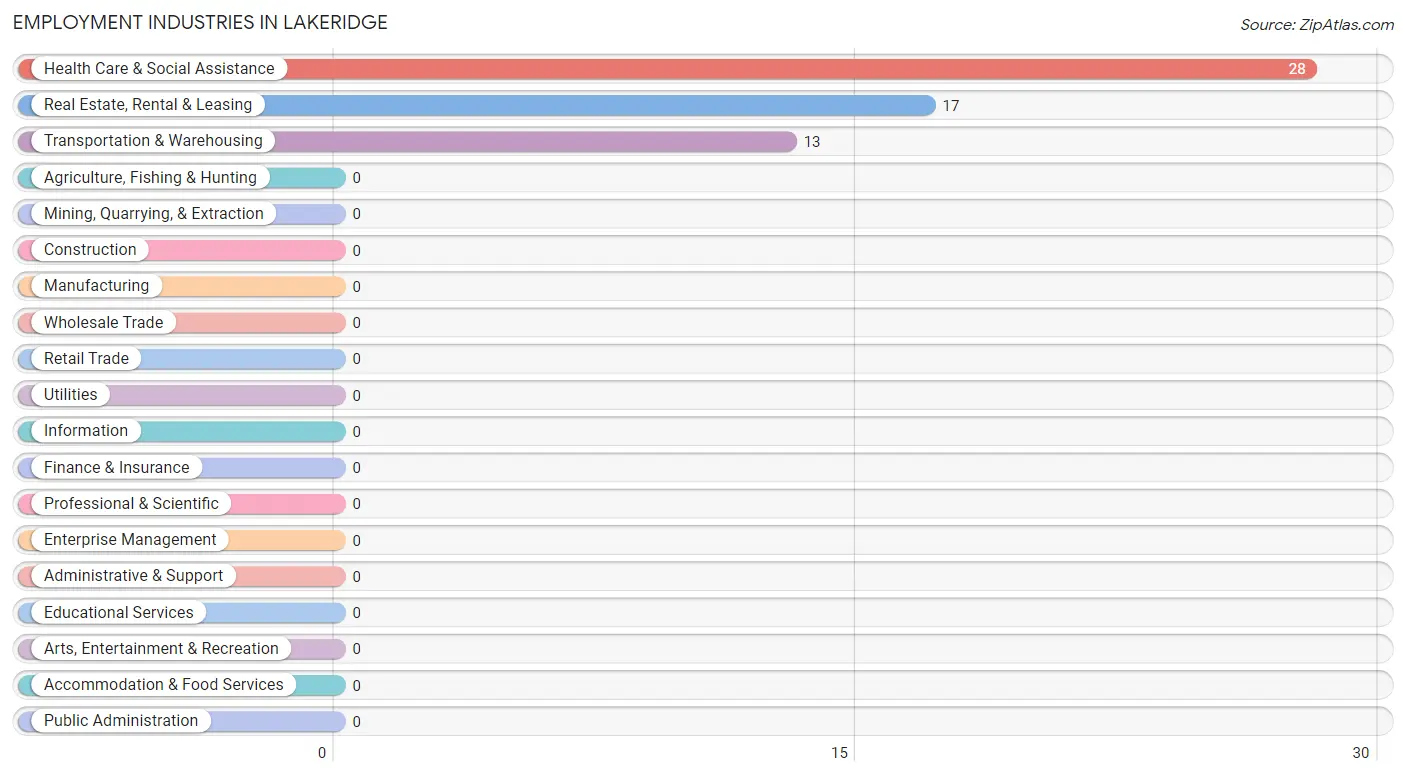
Employment Industries by Sex in Lakeridge
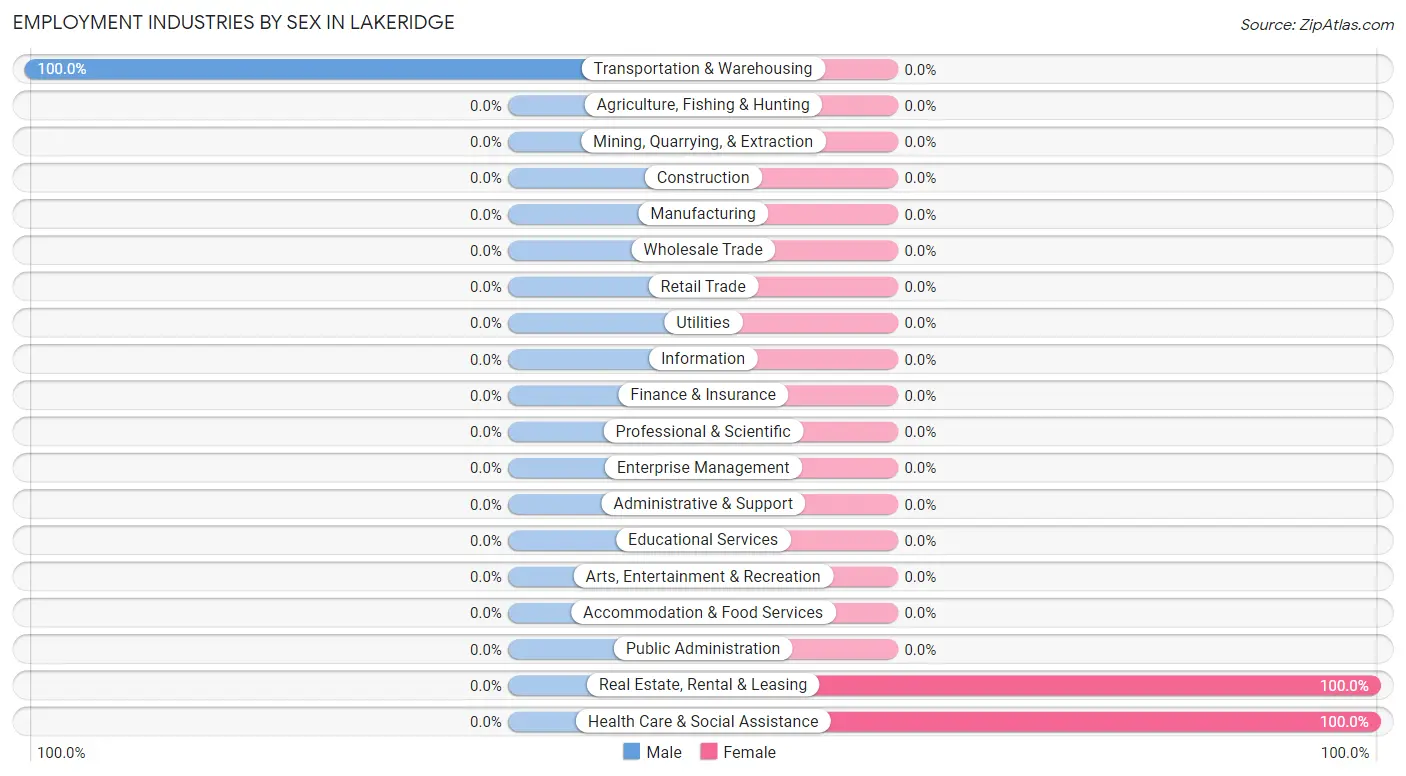
| Industry | Male | Female |
| Agriculture, Fishing & Hunting | 0 (0.0%) | 0 (0.0%) |
| Mining, Quarrying, & Extraction | 0 (0.0%) | 0 (0.0%) |
| Construction | 0 (0.0%) | 0 (0.0%) |
| Manufacturing | 0 (0.0%) | 0 (0.0%) |
| Wholesale Trade | 0 (0.0%) | 0 (0.0%) |
| Retail Trade | 0 (0.0%) | 0 (0.0%) |
| Transportation & Warehousing | 13 (100.0%) | 0 (0.0%) |
| Utilities | 0 (0.0%) | 0 (0.0%) |
| Information | 0 (0.0%) | 0 (0.0%) |
| Finance & Insurance | 0 (0.0%) | 0 (0.0%) |
| Real Estate, Rental & Leasing | 0 (0.0%) | 17 (100.0%) |
| Professional & Scientific | 0 (0.0%) | 0 (0.0%) |
| Enterprise Management | 0 (0.0%) | 0 (0.0%) |
| Administrative & Support | 0 (0.0%) | 0 (0.0%) |
| Educational Services | 0 (0.0%) | 0 (0.0%) |
| Health Care & Social Assistance | 0 (0.0%) | 28 (100.0%) |
| Arts, Entertainment & Recreation | 0 (0.0%) | 0 (0.0%) |
| Accommodation & Food Services | 0 (0.0%) | 0 (0.0%) |
| Public Administration | 0 (0.0%) | 0 (0.0%) |
| Total | 13 (18.1%) | 59 (81.9%) |
Education in Lakeridge
School Enrollment in Lakeridge
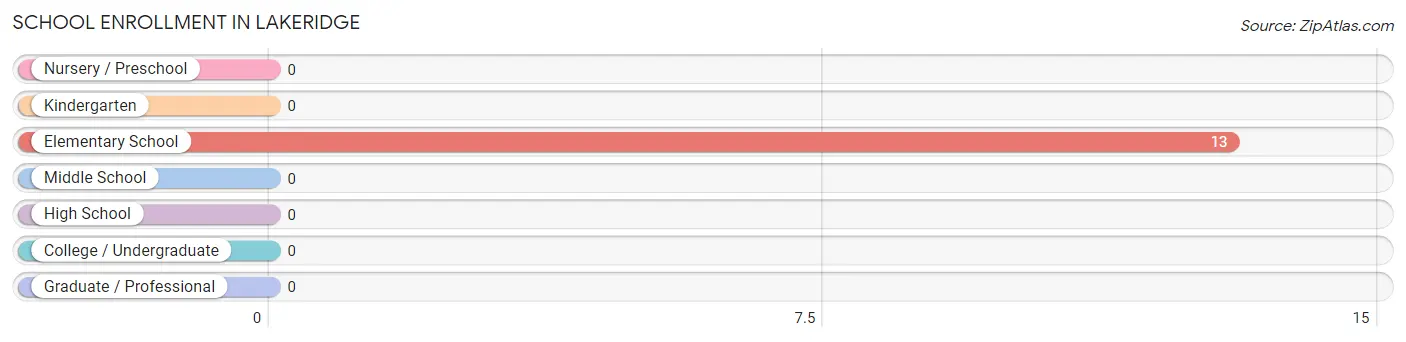
| School Level | # Students | % Students |
| Nursery / Preschool | 0 | 0.0% |
| Kindergarten | 0 | 0.0% |
| Elementary School | 13 | 100.0% |
| Middle School | 0 | 0.0% |
| High School | 0 | 0.0% |
| College / Undergraduate | 0 | 0.0% |
| Graduate / Professional | 0 | 0.0% |
| Total | 13 | 100.0% |
School Enrollment by Age by Funding Source in Lakeridge
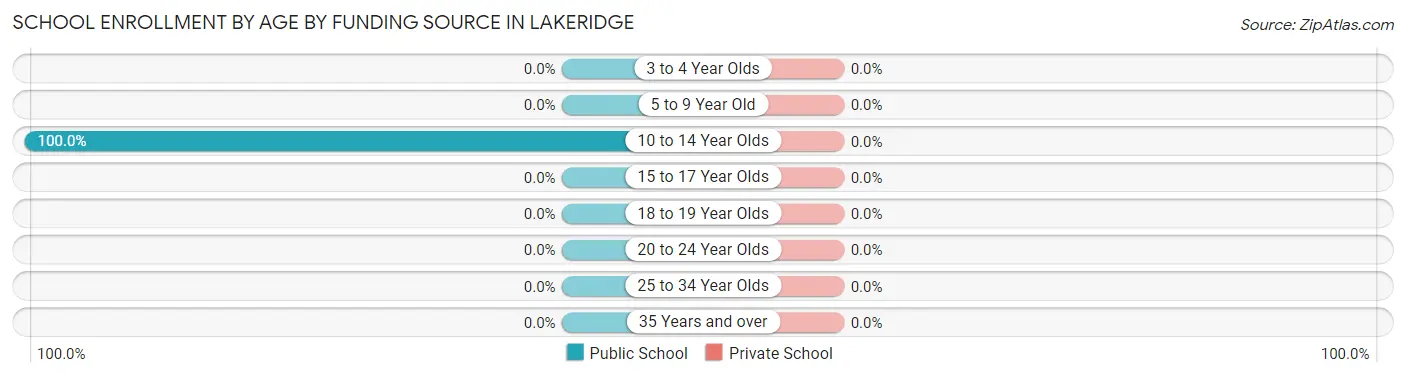
| Age Bracket | Public School | Private School |
| 3 to 4 Year Olds | 0 (0.0%) | 0 (0.0%) |
| 5 to 9 Year Old | 0 (0.0%) | 0 (0.0%) |
| 10 to 14 Year Olds | 13 (100.0%) | 0 (0.0%) |
| 15 to 17 Year Olds | 0 (0.0%) | 0 (0.0%) |
| 18 to 19 Year Olds | 0 (0.0%) | 0 (0.0%) |
| 20 to 24 Year Olds | 0 (0.0%) | 0 (0.0%) |
| 25 to 34 Year Olds | 0 (0.0%) | 0 (0.0%) |
| 35 Years and over | 0 (0.0%) | 0 (0.0%) |
| Total | 13 (100.0%) | 0 (0.0%) |
Educational Attainment by Field of Study in Lakeridge
Arts & humanities (25 | 17.5%), communications (24 | 16.8%), education (23 | 16.1%), science & technology (22 | 15.4%), and bio, nature & agricultural (14 | 9.8%) are the most common fields of study among 143 individuals in Lakeridge who have obtained a bachelor's degree or higher.
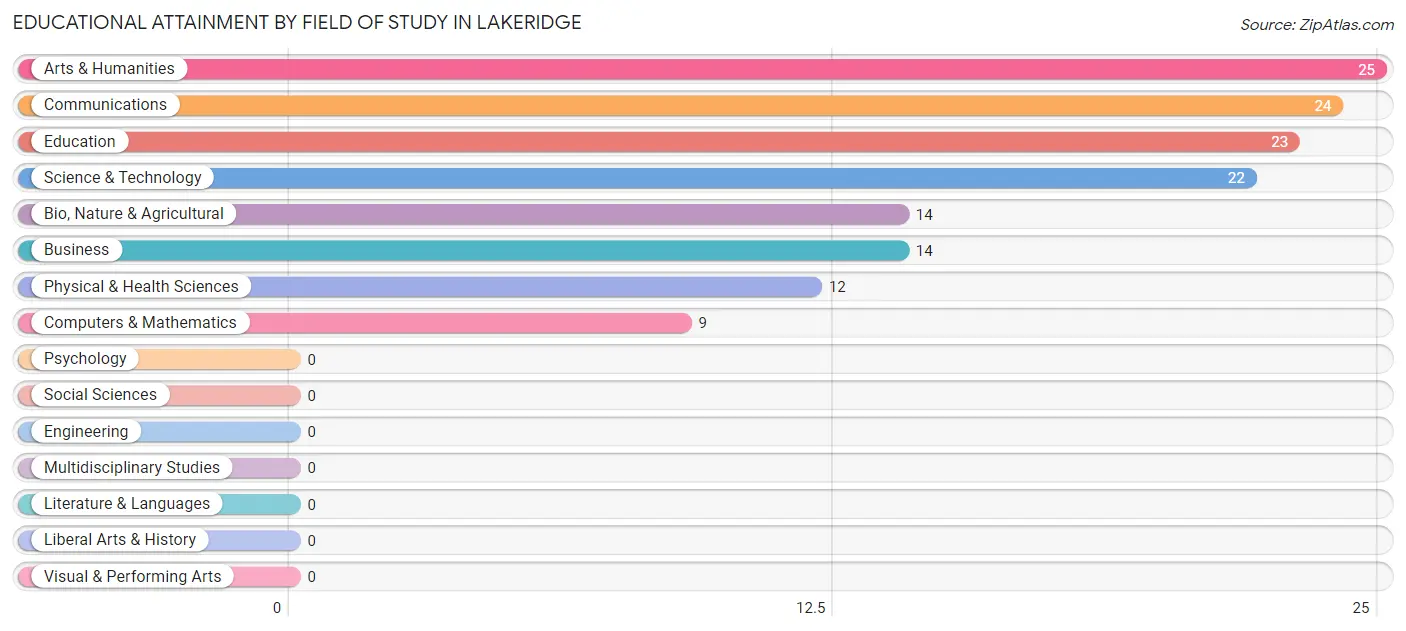
| Field of Study | # Graduates | % Graduates |
| Computers & Mathematics | 9 | 6.3% |
| Bio, Nature & Agricultural | 14 | 9.8% |
| Physical & Health Sciences | 12 | 8.4% |
| Psychology | 0 | 0.0% |
| Social Sciences | 0 | 0.0% |
| Engineering | 0 | 0.0% |
| Multidisciplinary Studies | 0 | 0.0% |
| Science & Technology | 22 | 15.4% |
| Business | 14 | 9.8% |
| Education | 23 | 16.1% |
| Literature & Languages | 0 | 0.0% |
| Liberal Arts & History | 0 | 0.0% |
| Visual & Performing Arts | 0 | 0.0% |
| Communications | 24 | 16.8% |
| Arts & Humanities | 25 | 17.5% |
| Total | 143 | 100.0% |
Transportation & Commute in Lakeridge
Vehicle Availability by Sex in Lakeridge
The most prevalent vehicle ownership categories in Lakeridge are males with 1 vehicle (13, accounting for 100.0%) and females with 1 vehicle (0, making up 28.9%).
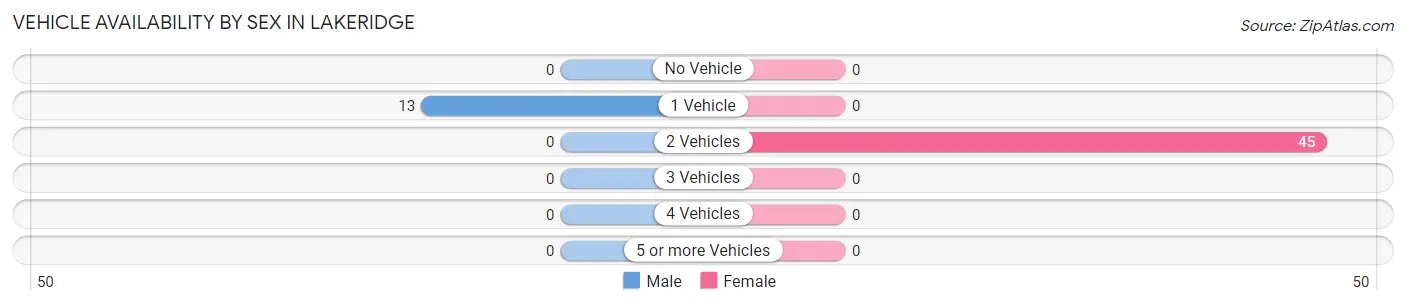
| Vehicles Available | Male | Female |
| No Vehicle | 0 (0.0%) | 0 (0.0%) |
| 1 Vehicle | 13 (100.0%) | 0 (0.0%) |
| 2 Vehicles | 0 (0.0%) | 45 (100.0%) |
| 3 Vehicles | 0 (0.0%) | 0 (0.0%) |
| 4 Vehicles | 0 (0.0%) | 0 (0.0%) |
| 5 or more Vehicles | 0 (0.0%) | 0 (0.0%) |
| Total | 13 (100.0%) | 45 (100.0%) |
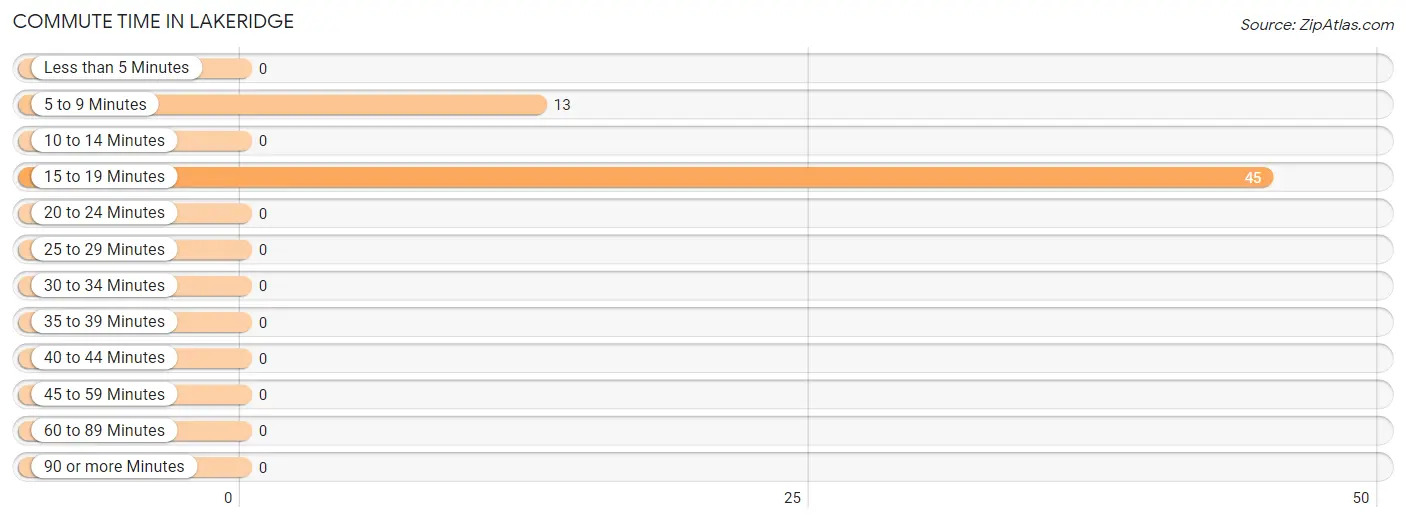
Commute Time in Lakeridge
The most frequently occuring commute durations in Lakeridge are 15 to 19 minutes (45 commuters, 77.6%), 5 to 9 minutes (13 commuters, 22.4%), and less than 5 minutes (0 commuters, 0.0%).
| Commute Time | # Commuters | % Commuters |
| Less than 5 Minutes | 0 | 0.0% |
| 5 to 9 Minutes | 13 | 22.4% |
| 10 to 14 Minutes | 0 | 0.0% |
| 15 to 19 Minutes | 45 | 77.6% |
| 20 to 24 Minutes | 0 | 0.0% |
| 25 to 29 Minutes | 0 | 0.0% |
| 30 to 34 Minutes | 0 | 0.0% |
| 35 to 39 Minutes | 0 | 0.0% |
| 40 to 44 Minutes | 0 | 0.0% |
| 45 to 59 Minutes | 0 | 0.0% |
| 60 to 89 Minutes | 0 | 0.0% |
| 90 or more Minutes | 0 | 0.0% |
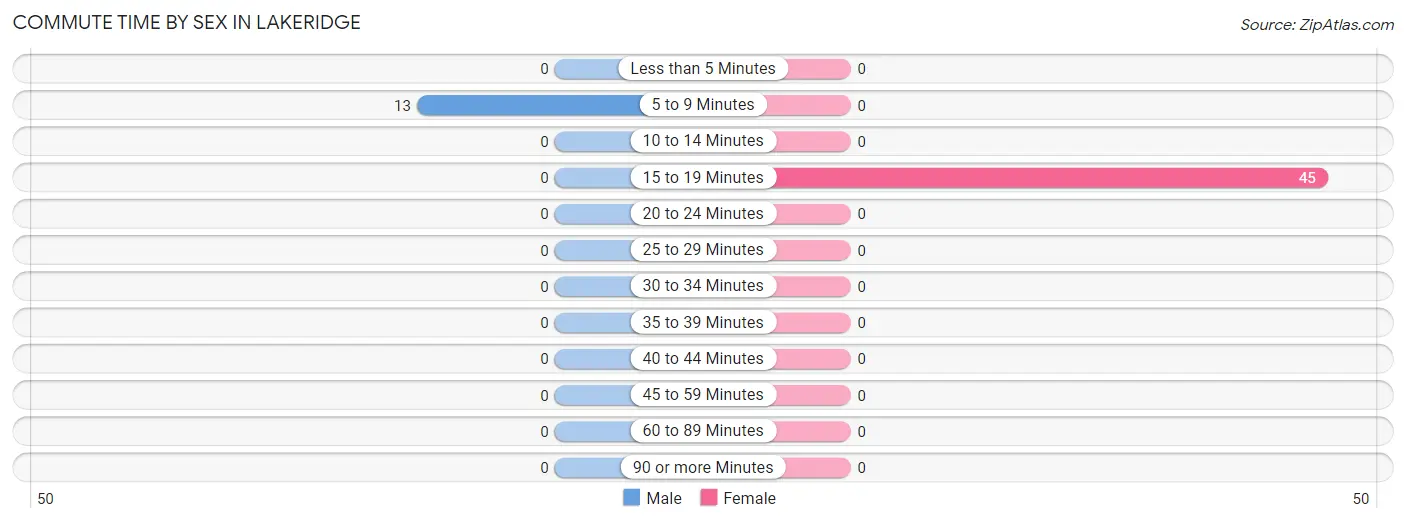
Commute Time by Sex in Lakeridge
The most common commute times in Lakeridge are 5 to 9 minutes (13 commuters, 100.0%) for males and 15 to 19 minutes (45 commuters, 100.0%) for females.
| Commute Time | Male | Female |
| Less than 5 Minutes | 0 (0.0%) | 0 (0.0%) |
| 5 to 9 Minutes | 13 (100.0%) | 0 (0.0%) |
| 10 to 14 Minutes | 0 (0.0%) | 0 (0.0%) |
| 15 to 19 Minutes | 0 (0.0%) | 45 (100.0%) |
| 20 to 24 Minutes | 0 (0.0%) | 0 (0.0%) |
| 25 to 29 Minutes | 0 (0.0%) | 0 (0.0%) |
| 30 to 34 Minutes | 0 (0.0%) | 0 (0.0%) |
| 35 to 39 Minutes | 0 (0.0%) | 0 (0.0%) |
| 40 to 44 Minutes | 0 (0.0%) | 0 (0.0%) |
| 45 to 59 Minutes | 0 (0.0%) | 0 (0.0%) |
| 60 to 89 Minutes | 0 (0.0%) | 0 (0.0%) |
| 90 or more Minutes | 0 (0.0%) | 0 (0.0%) |
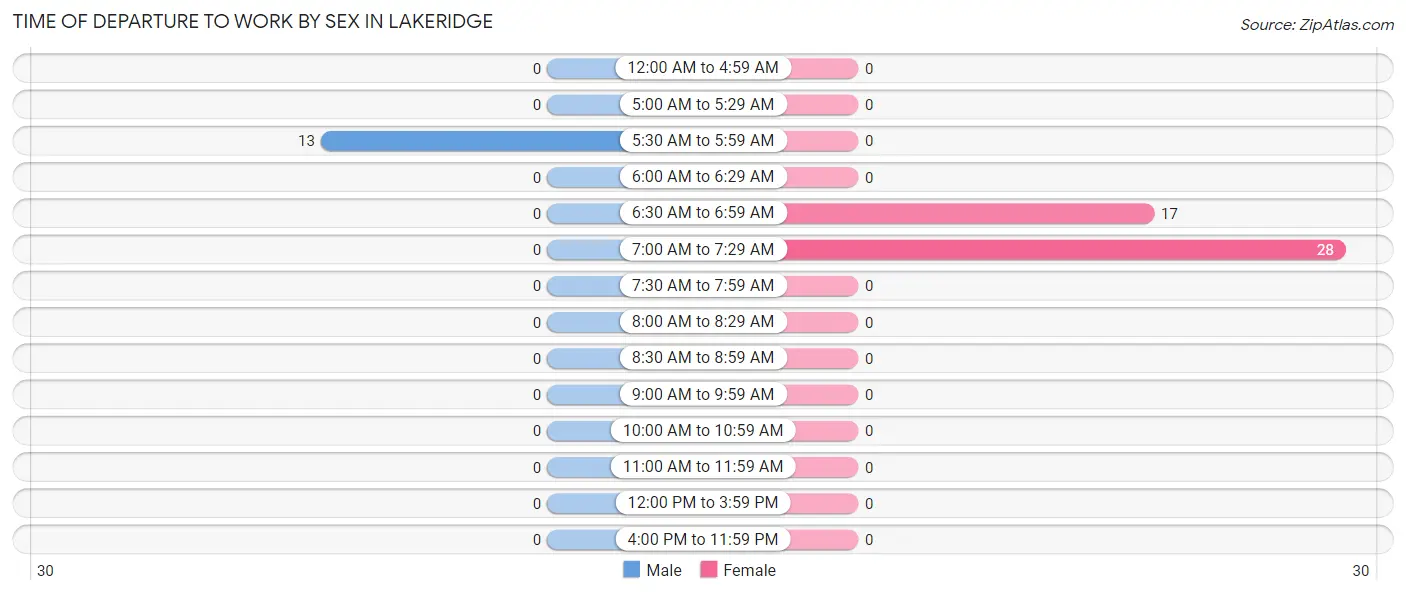
Time of Departure to Work by Sex in Lakeridge
The most frequent times of departure to work in Lakeridge are 5:30 AM to 5:59 AM (13, 100.0%) for males and 7:00 AM to 7:29 AM (28, 62.2%) for females.
| Time of Departure | Male | Female |
| 12:00 AM to 4:59 AM | 0 (0.0%) | 0 (0.0%) |
| 5:00 AM to 5:29 AM | 0 (0.0%) | 0 (0.0%) |
| 5:30 AM to 5:59 AM | 13 (100.0%) | 0 (0.0%) |
| 6:00 AM to 6:29 AM | 0 (0.0%) | 0 (0.0%) |
| 6:30 AM to 6:59 AM | 0 (0.0%) | 17 (37.8%) |
| 7:00 AM to 7:29 AM | 0 (0.0%) | 28 (62.2%) |
| 7:30 AM to 7:59 AM | 0 (0.0%) | 0 (0.0%) |
| 8:00 AM to 8:29 AM | 0 (0.0%) | 0 (0.0%) |
| 8:30 AM to 8:59 AM | 0 (0.0%) | 0 (0.0%) |
| 9:00 AM to 9:59 AM | 0 (0.0%) | 0 (0.0%) |
| 10:00 AM to 10:59 AM | 0 (0.0%) | 0 (0.0%) |
| 11:00 AM to 11:59 AM | 0 (0.0%) | 0 (0.0%) |
| 12:00 PM to 3:59 PM | 0 (0.0%) | 0 (0.0%) |
| 4:00 PM to 11:59 PM | 0 (0.0%) | 0 (0.0%) |
| Total | 13 (100.0%) | 45 (100.0%) |
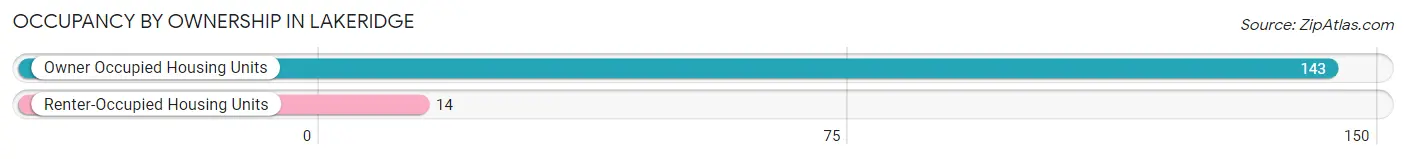
Housing Occupancy in Lakeridge
Occupancy by Ownership in Lakeridge
Of the total 157 dwellings in Lakeridge, owner-occupied units account for 143 (91.1%), while renter-occupied units make up 14 (8.9%).
| Occupancy | # Housing Units | % Housing Units |
| Owner Occupied Housing Units | 143 | 91.1% |
| Renter-Occupied Housing Units | 14 | 8.9% |
| Total Occupied Housing Units | 157 | 100.0% |
Occupancy by Household Size in Lakeridge
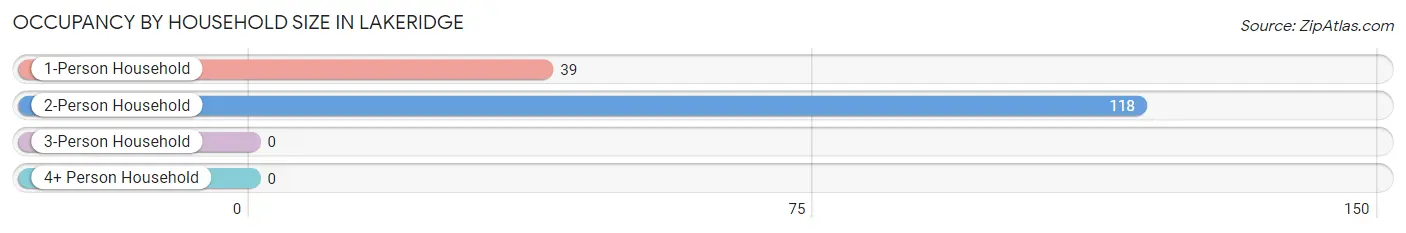
| Household Size | # Housing Units | % Housing Units |
| 1-Person Household | 39 | 24.8% |
| 2-Person Household | 118 | 75.2% |
| 3-Person Household | 0 | 0.0% |
| 4+ Person Household | 0 | 0.0% |
| Total Housing Units | 157 | 100.0% |
Occupancy by Ownership by Household Size in Lakeridge
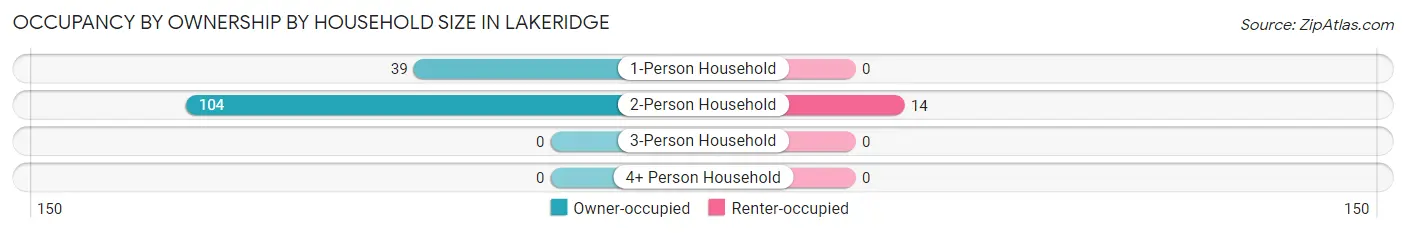
| Household Size | Owner-occupied | Renter-occupied |
| 1-Person Household | 39 (100.0%) | 0 (0.0%) |
| 2-Person Household | 104 (88.1%) | 14 (11.9%) |
| 3-Person Household | 0 (0.0%) | 0 (0.0%) |
| 4+ Person Household | 0 (0.0%) | 0 (0.0%) |
| Total Housing Units | 143 (91.1%) | 14 (8.9%) |
Occupancy by Educational Attainment in Lakeridge
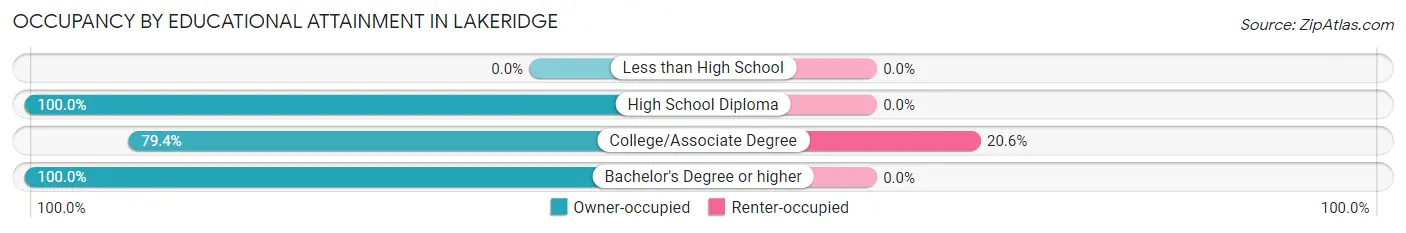
| Household Size | Owner-occupied | Renter-occupied |
| Less than High School | 0 (0.0%) | 0 (0.0%) |
| High School Diploma | 13 (100.0%) | 0 (0.0%) |
| College/Associate Degree | 54 (79.4%) | 14 (20.6%) |
| Bachelor's Degree or higher | 76 (100.0%) | 0 (0.0%) |
Occupancy by Age of Householder in Lakeridge
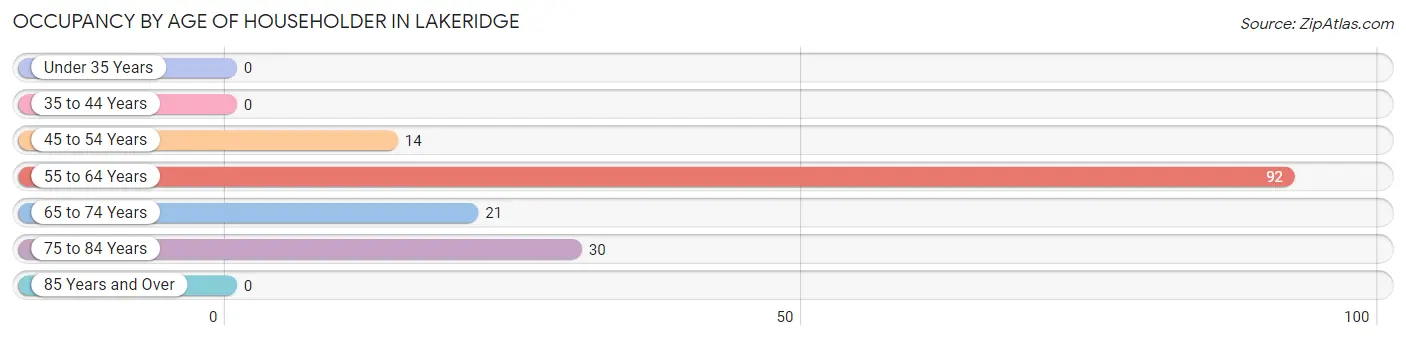
| Age Bracket | # Households | % Households |
| Under 35 Years | 0 | 0.0% |
| 35 to 44 Years | 0 | 0.0% |
| 45 to 54 Years | 14 | 8.9% |
| 55 to 64 Years | 92 | 58.6% |
| 65 to 74 Years | 21 | 13.4% |
| 75 to 84 Years | 30 | 19.1% |
| 85 Years and Over | 0 | 0.0% |
| Total | 157 | 100.0% |
Housing Finances in Lakeridge
Median Income by Occupancy in Lakeridge
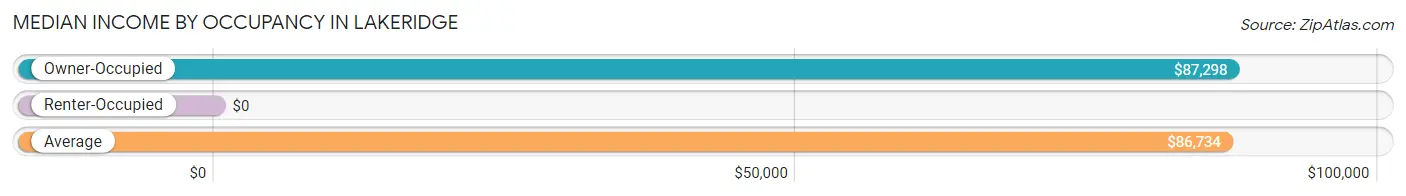
| Occupancy Type | # Households | Median Income |
| Owner-Occupied | 143 (91.1%) | $87,298 |
| Renter-Occupied | 14 (8.9%) | $0 |
| Average | 157 (100.0%) | $86,734 |
Occupancy by Householder Income Bracket in Lakeridge
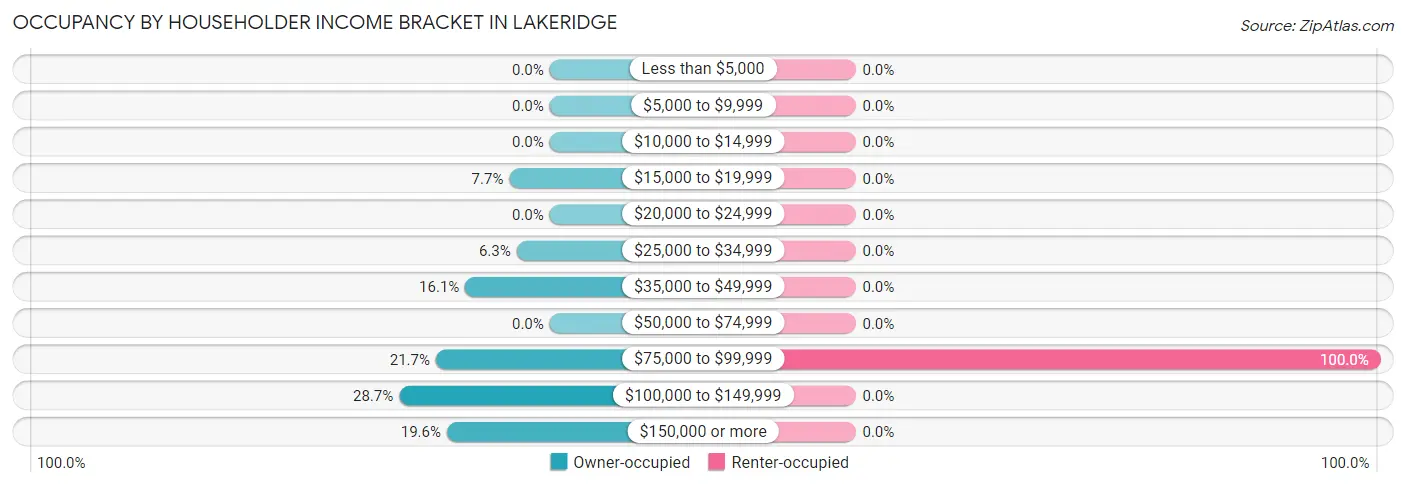
| Income Bracket | Owner-occupied | Renter-occupied |
| Less than $5,000 | 0 (0.0%) | 0 (0.0%) |
| $5,000 to $9,999 | 0 (0.0%) | 0 (0.0%) |
| $10,000 to $14,999 | 0 (0.0%) | 0 (0.0%) |
| $15,000 to $19,999 | 11 (7.7%) | 0 (0.0%) |
| $20,000 to $24,999 | 0 (0.0%) | 0 (0.0%) |
| $25,000 to $34,999 | 9 (6.3%) | 0 (0.0%) |
| $35,000 to $49,999 | 23 (16.1%) | 0 (0.0%) |
| $50,000 to $74,999 | 0 (0.0%) | 0 (0.0%) |
| $75,000 to $99,999 | 31 (21.7%) | 14 (100.0%) |
| $100,000 to $149,999 | 41 (28.7%) | 0 (0.0%) |
| $150,000 or more | 28 (19.6%) | 0 (0.0%) |
| Total | 143 (100.0%) | 14 (100.0%) |
Monthly Housing Cost Tiers in Lakeridge
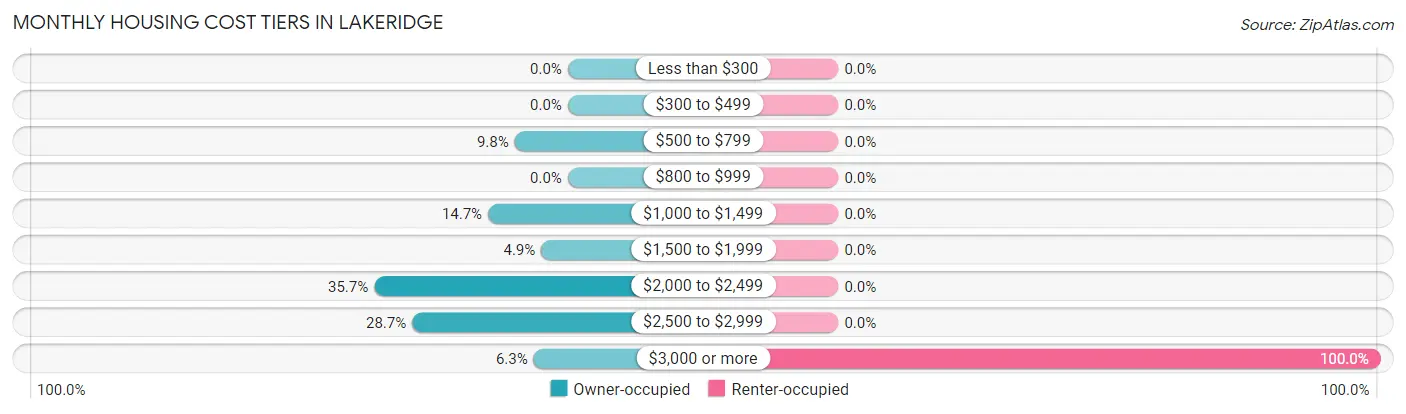
| Monthly Cost | Owner-occupied | Renter-occupied |
| Less than $300 | 0 (0.0%) | 0 (0.0%) |
| $300 to $499 | 0 (0.0%) | 0 (0.0%) |
| $500 to $799 | 14 (9.8%) | 0 (0.0%) |
| $800 to $999 | 0 (0.0%) | 0 (0.0%) |
| $1,000 to $1,499 | 21 (14.7%) | 0 (0.0%) |
| $1,500 to $1,999 | 7 (4.9%) | 0 (0.0%) |
| $2,000 to $2,499 | 51 (35.7%) | 0 (0.0%) |
| $2,500 to $2,999 | 41 (28.7%) | 0 (0.0%) |
| $3,000 or more | 9 (6.3%) | 14 (100.0%) |
| Total | 143 (100.0%) | 14 (100.0%) |
Physical Housing Characteristics in Lakeridge
Housing Structures in Lakeridge
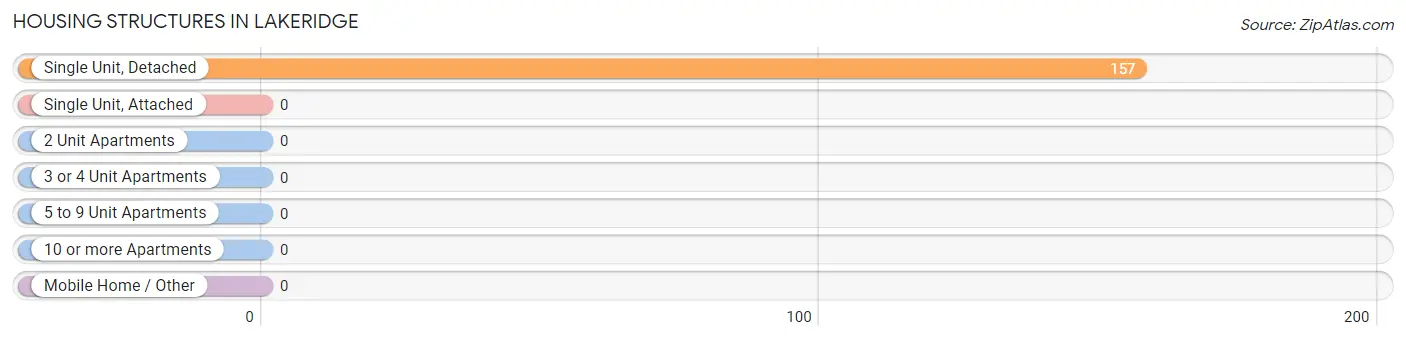
| Structure Type | # Housing Units | % Housing Units |
| Single Unit, Detached | 157 | 100.0% |
| Single Unit, Attached | 0 | 0.0% |
| 2 Unit Apartments | 0 | 0.0% |
| 3 or 4 Unit Apartments | 0 | 0.0% |
| 5 to 9 Unit Apartments | 0 | 0.0% |
| 10 or more Apartments | 0 | 0.0% |
| Mobile Home / Other | 0 | 0.0% |
| Total | 157 | 100.0% |
Housing Structures by Occupancy in Lakeridge
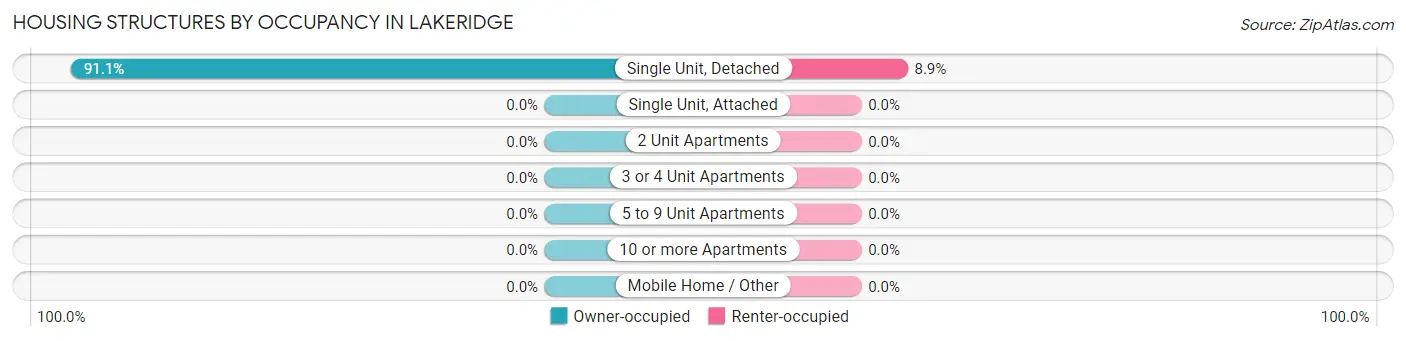
| Structure Type | Owner-occupied | Renter-occupied |
| Single Unit, Detached | 143 (91.1%) | 14 (8.9%) |
| Single Unit, Attached | 0 (0.0%) | 0 (0.0%) |
| 2 Unit Apartments | 0 (0.0%) | 0 (0.0%) |
| 3 or 4 Unit Apartments | 0 (0.0%) | 0 (0.0%) |
| 5 to 9 Unit Apartments | 0 (0.0%) | 0 (0.0%) |
| 10 or more Apartments | 0 (0.0%) | 0 (0.0%) |
| Mobile Home / Other | 0 (0.0%) | 0 (0.0%) |
| Total | 143 (91.1%) | 14 (8.9%) |
Housing Structures by Number of Rooms in Lakeridge
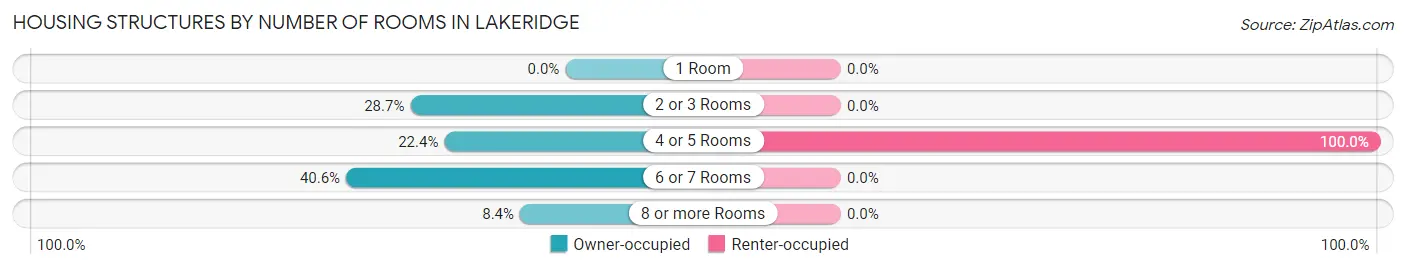
| Number of Rooms | Owner-occupied | Renter-occupied |
| 1 Room | 0 (0.0%) | 0 (0.0%) |
| 2 or 3 Rooms | 41 (28.7%) | 0 (0.0%) |
| 4 or 5 Rooms | 32 (22.4%) | 14 (100.0%) |
| 6 or 7 Rooms | 58 (40.6%) | 0 (0.0%) |
| 8 or more Rooms | 12 (8.4%) | 0 (0.0%) |
| Total | 143 (100.0%) | 14 (100.0%) |
Housing Structure by Heating Type in Lakeridge
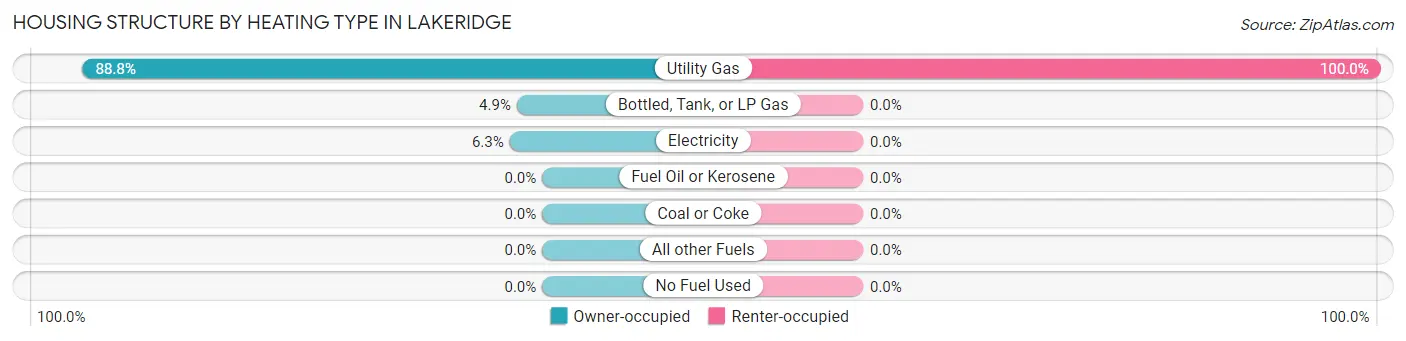
| Heating Type | Owner-occupied | Renter-occupied |
| Utility Gas | 127 (88.8%) | 14 (100.0%) |
| Bottled, Tank, or LP Gas | 7 (4.9%) | 0 (0.0%) |
| Electricity | 9 (6.3%) | 0 (0.0%) |
| Fuel Oil or Kerosene | 0 (0.0%) | 0 (0.0%) |
| Coal or Coke | 0 (0.0%) | 0 (0.0%) |
| All other Fuels | 0 (0.0%) | 0 (0.0%) |
| No Fuel Used | 0 (0.0%) | 0 (0.0%) |
| Total | 143 (100.0%) | 14 (100.0%) |
Household Vehicle Usage in Lakeridge
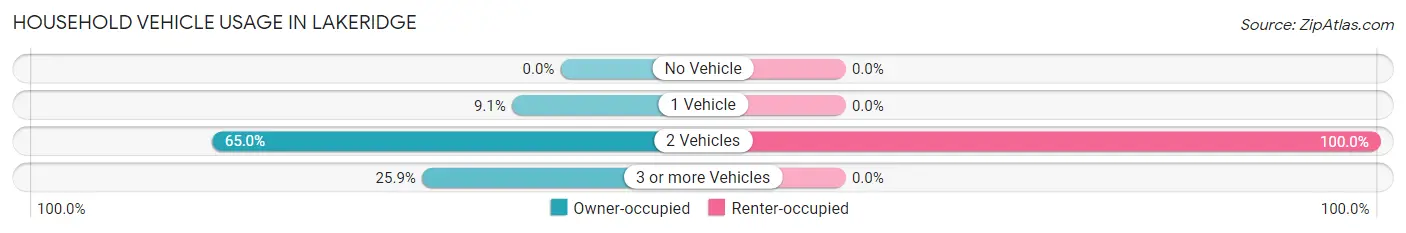
| Vehicles per Household | Owner-occupied | Renter-occupied |
| No Vehicle | 0 (0.0%) | 0 (0.0%) |
| 1 Vehicle | 13 (9.1%) | 0 (0.0%) |
| 2 Vehicles | 93 (65.0%) | 14 (100.0%) |
| 3 or more Vehicles | 37 (25.9%) | 0 (0.0%) |
| Total | 143 (100.0%) | 14 (100.0%) |
Real Estate & Mortgages in Lakeridge
Real Estate and Mortgage Overview in Lakeridge
| Characteristic | Without Mortgage | With Mortgage |
| Housing Units | 59 | 84 |
| Median Property Value | $2,000,001 | $979,200 |
| Median Household Income | - | - |
| Monthly Housing Costs | $1,374 | $9 |
| Real Estate Taxes | $8,472 | $0 |
Property Value by Mortgage Status in Lakeridge
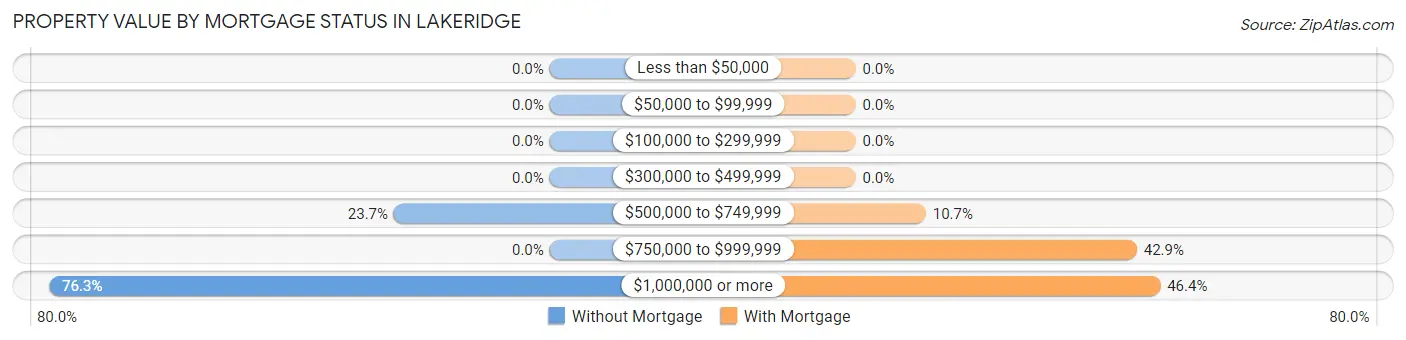
| Property Value | Without Mortgage | With Mortgage |
| Less than $50,000 | 0 (0.0%) | 0 (0.0%) |
| $50,000 to $99,999 | 0 (0.0%) | 0 (0.0%) |
| $100,000 to $299,999 | 0 (0.0%) | 0 (0.0%) |
| $300,000 to $499,999 | 0 (0.0%) | 0 (0.0%) |
| $500,000 to $749,999 | 14 (23.7%) | 9 (10.7%) |
| $750,000 to $999,999 | 0 (0.0%) | 36 (42.9%) |
| $1,000,000 or more | 45 (76.3%) | 39 (46.4%) |
| Total | 59 (100.0%) | 84 (100.0%) |
Household Income by Mortgage Status in Lakeridge
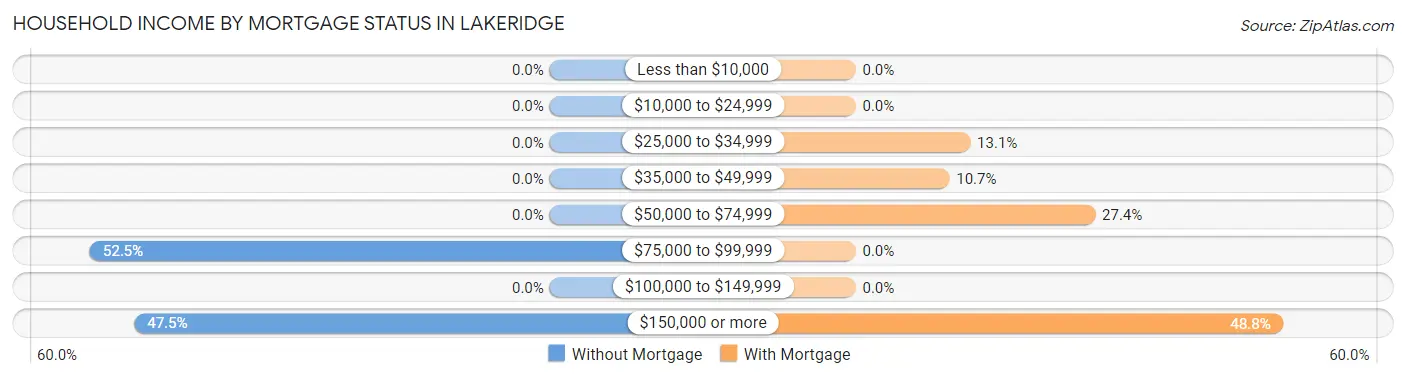
| Household Income | Without Mortgage | With Mortgage |
| Less than $10,000 | 0 (0.0%) | 0 (0.0%) |
| $10,000 to $24,999 | 0 (0.0%) | 0 (0.0%) |
| $25,000 to $34,999 | 0 (0.0%) | 11 (13.1%) |
| $35,000 to $49,999 | 0 (0.0%) | 9 (10.7%) |
| $50,000 to $74,999 | 0 (0.0%) | 23 (27.4%) |
| $75,000 to $99,999 | 31 (52.5%) | 0 (0.0%) |
| $100,000 to $149,999 | 0 (0.0%) | 0 (0.0%) |
| $150,000 or more | 28 (47.5%) | 41 (48.8%) |
| Total | 59 (100.0%) | 84 (100.0%) |
Property Value to Household Income Ratio in Lakeridge
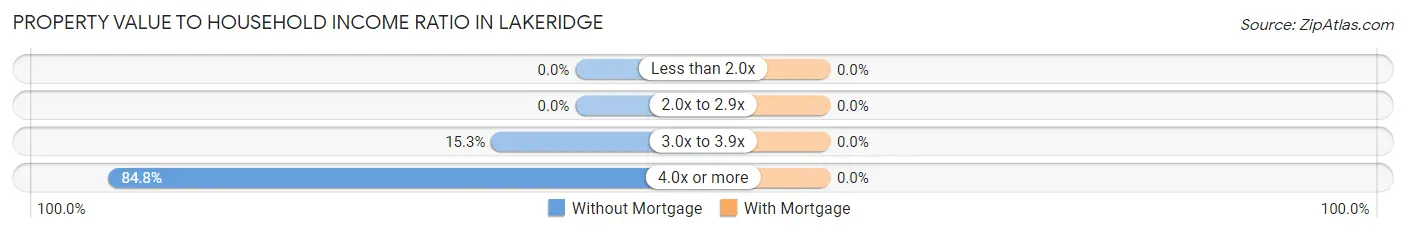
| Value-to-Income Ratio | Without Mortgage | With Mortgage |
| Less than 2.0x | 0 (0.0%) | 0 (0.0%) |
| 2.0x to 2.9x | 0 (0.0%) | 0 (0.0%) |
| 3.0x to 3.9x | 9 (15.2%) | 0 (0.0%) |
| 4.0x or more | 50 (84.8%) | 0 (0.0%) |
| Total | 59 (100.0%) | 84 (100.0%) |
Real Estate Taxes by Mortgage Status in Lakeridge
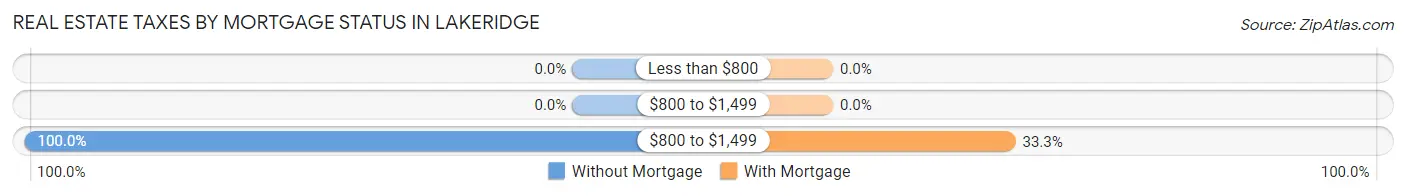
| Property Taxes | Without Mortgage | With Mortgage |
| Less than $800 | 0 (0.0%) | 0 (0.0%) |
| $800 to $1,499 | 0 (0.0%) | 0 (0.0%) |
| $800 to $1,499 | 59 (100.0%) | 28 (33.3%) |
| Total | 59 (100.0%) | 84 (100.0%) |
Health & Disability in Lakeridge
Health Insurance Coverage by Age in Lakeridge
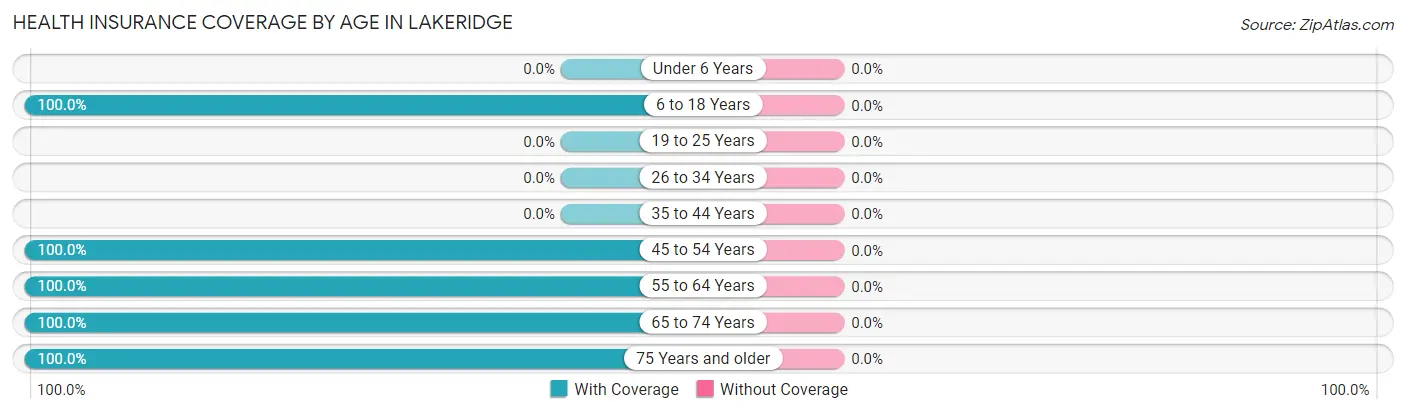
| Age Bracket | With Coverage | Without Coverage |
| Under 6 Years | 0 (0.0%) | 0 (0.0%) |
| 6 to 18 Years | 13 (100.0%) | 0 (0.0%) |
| 19 to 25 Years | 0 (0.0%) | 0 (0.0%) |
| 26 to 34 Years | 0 (0.0%) | 0 (0.0%) |
| 35 to 44 Years | 0 (0.0%) | 0 (0.0%) |
| 45 to 54 Years | 14 (100.0%) | 0 (0.0%) |
| 55 to 64 Years | 155 (100.0%) | 0 (0.0%) |
| 65 to 74 Years | 53 (100.0%) | 0 (0.0%) |
| 75 Years and older | 43 (100.0%) | 0 (0.0%) |
| Total | 278 (100.0%) | 0 (0.0%) |
Health Insurance Coverage by Citizenship Status in Lakeridge
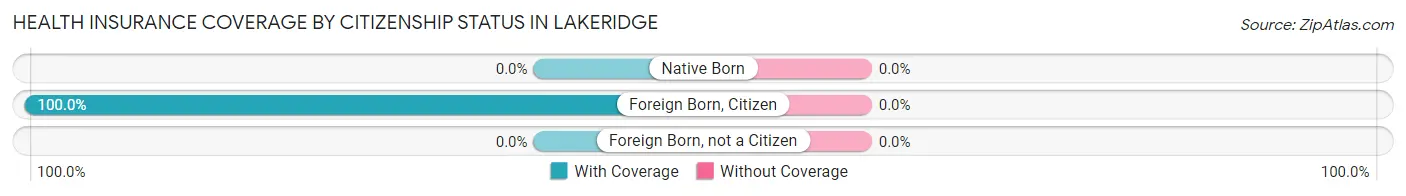
| Citizenship Status | With Coverage | Without Coverage |
| Native Born | 0 (0.0%) | 0 (0.0%) |
| Foreign Born, Citizen | 13 (100.0%) | 0 (0.0%) |
| Foreign Born, not a Citizen | 0 (0.0%) | 0 (0.0%) |
Health Insurance Coverage by Household Income in Lakeridge
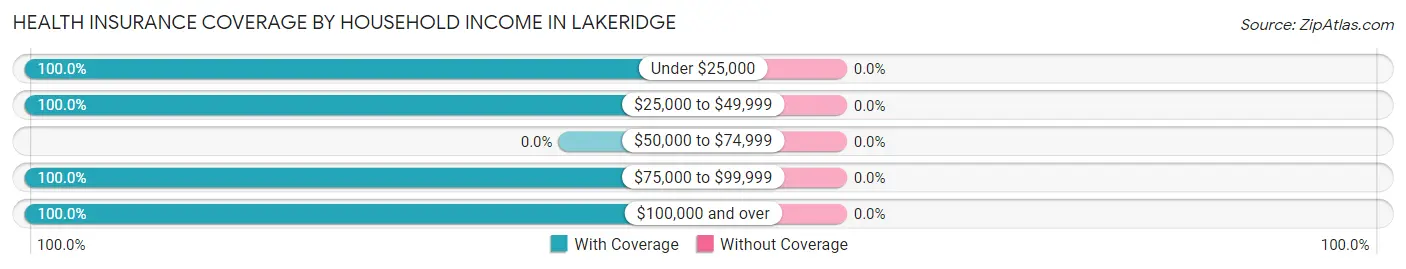
| Household Income | With Coverage | Without Coverage |
| Under $25,000 | 23 (100.0%) | 0 (0.0%) |
| $25,000 to $49,999 | 54 (100.0%) | 0 (0.0%) |
| $50,000 to $74,999 | 0 (0.0%) | 0 (0.0%) |
| $75,000 to $99,999 | 70 (100.0%) | 0 (0.0%) |
| $100,000 and over | 131 (100.0%) | 0 (0.0%) |
Public vs Private Health Insurance Coverage by Age in Lakeridge
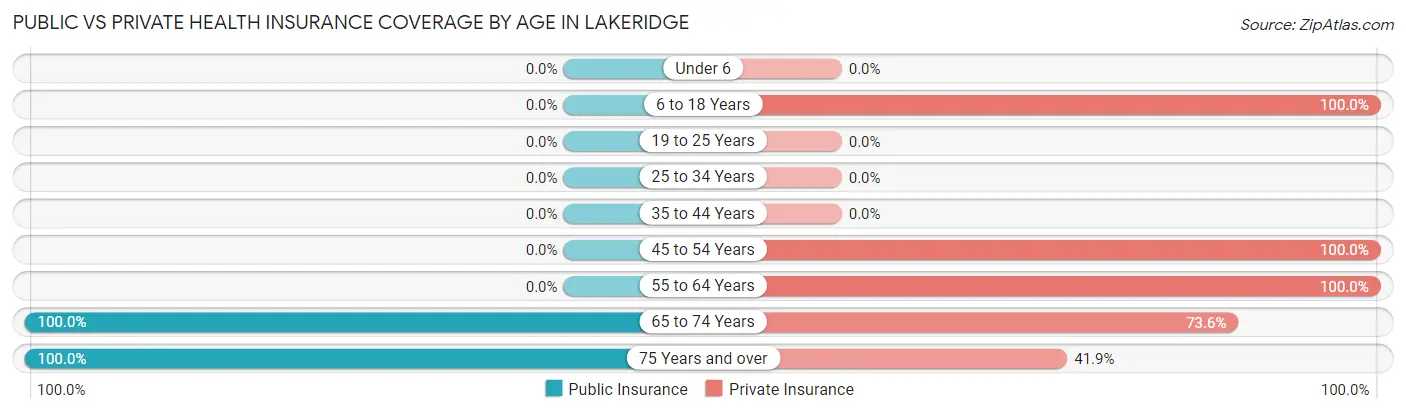
| Age Bracket | Public Insurance | Private Insurance |
| Under 6 | 0 (0.0%) | 0 (0.0%) |
| 6 to 18 Years | 0 (0.0%) | 13 (100.0%) |
| 19 to 25 Years | 0 (0.0%) | 0 (0.0%) |
| 25 to 34 Years | 0 (0.0%) | 0 (0.0%) |
| 35 to 44 Years | 0 (0.0%) | 0 (0.0%) |
| 45 to 54 Years | 0 (0.0%) | 14 (100.0%) |
| 55 to 64 Years | 0 (0.0%) | 155 (100.0%) |
| 65 to 74 Years | 53 (100.0%) | 39 (73.6%) |
| 75 Years and over | 43 (100.0%) | 18 (41.9%) |
| Total | 96 (34.5%) | 239 (86.0%) |
Disability Status by Sex by Age in Lakeridge
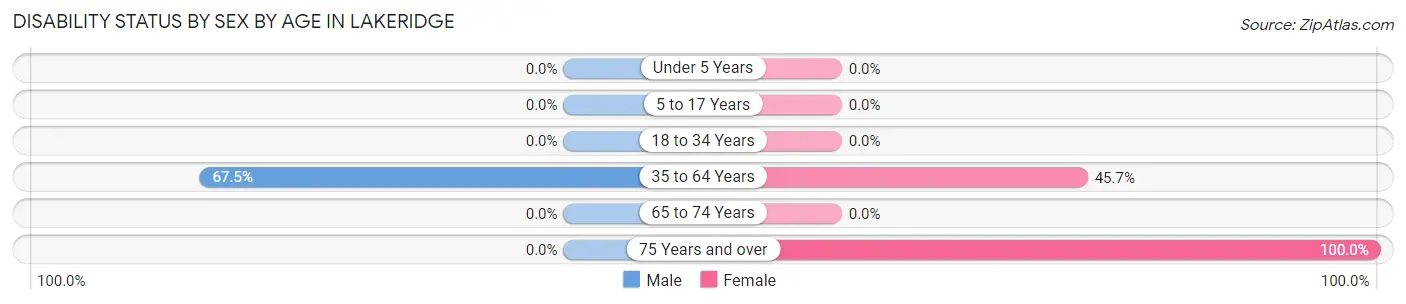
| Age Bracket | Male | Female |
| Under 5 Years | 0 (0.0%) | 0 (0.0%) |
| 5 to 17 Years | 0 (0.0%) | 0 (0.0%) |
| 18 to 34 Years | 0 (0.0%) | 0 (0.0%) |
| 35 to 64 Years | 52 (67.5%) | 42 (45.7%) |
| 65 to 74 Years | 0 (0.0%) | 0 (0.0%) |
| 75 Years and over | 0 (0.0%) | 13 (100.0%) |
Disability Class by Sex by Age in Lakeridge
Disability Class: Hearing Difficulty
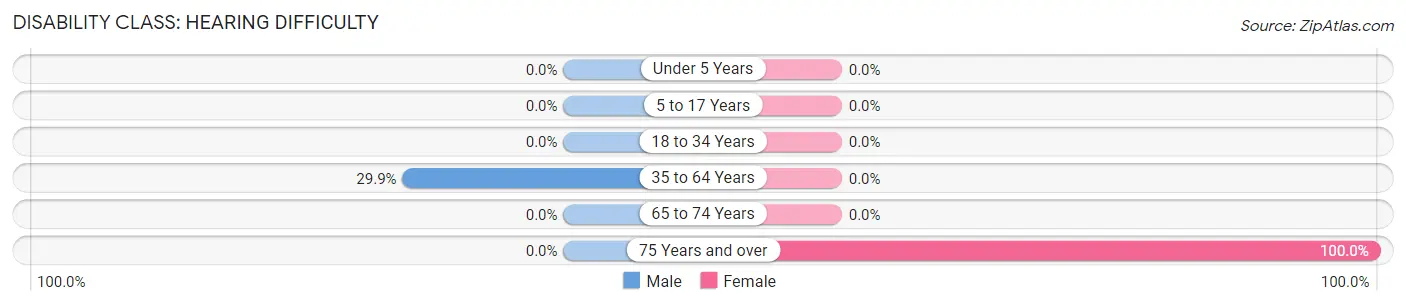
| Age Bracket | Male | Female |
| Under 5 Years | 0 (0.0%) | 0 (0.0%) |
| 5 to 17 Years | 0 (0.0%) | 0 (0.0%) |
| 18 to 34 Years | 0 (0.0%) | 0 (0.0%) |
| 35 to 64 Years | 23 (29.9%) | 0 (0.0%) |
| 65 to 74 Years | 0 (0.0%) | 0 (0.0%) |
| 75 Years and over | 0 (0.0%) | 13 (100.0%) |
Disability Class: Vision Difficulty
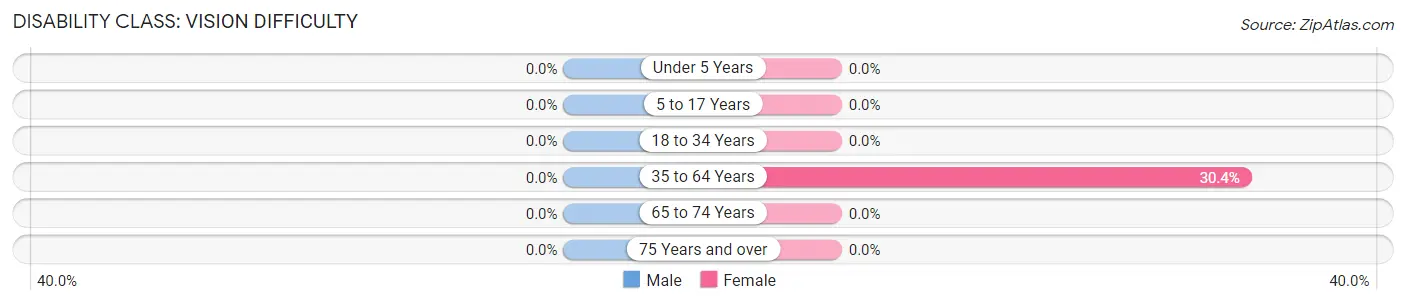
| Age Bracket | Male | Female |
| Under 5 Years | 0 (0.0%) | 0 (0.0%) |
| 5 to 17 Years | 0 (0.0%) | 0 (0.0%) |
| 18 to 34 Years | 0 (0.0%) | 0 (0.0%) |
| 35 to 64 Years | 0 (0.0%) | 28 (30.4%) |
| 65 to 74 Years | 0 (0.0%) | 0 (0.0%) |
| 75 Years and over | 0 (0.0%) | 0 (0.0%) |
Disability Class: Cognitive Difficulty

| Age Bracket | Male | Female |
| 5 to 17 Years | 0 (0.0%) | 0 (0.0%) |
| 18 to 34 Years | 0 (0.0%) | 0 (0.0%) |
| 35 to 64 Years | 29 (37.7%) | 0 (0.0%) |
| 65 to 74 Years | 0 (0.0%) | 0 (0.0%) |
| 75 Years and over | 0 (0.0%) | 0 (0.0%) |
Disability Class: Ambulatory Difficulty
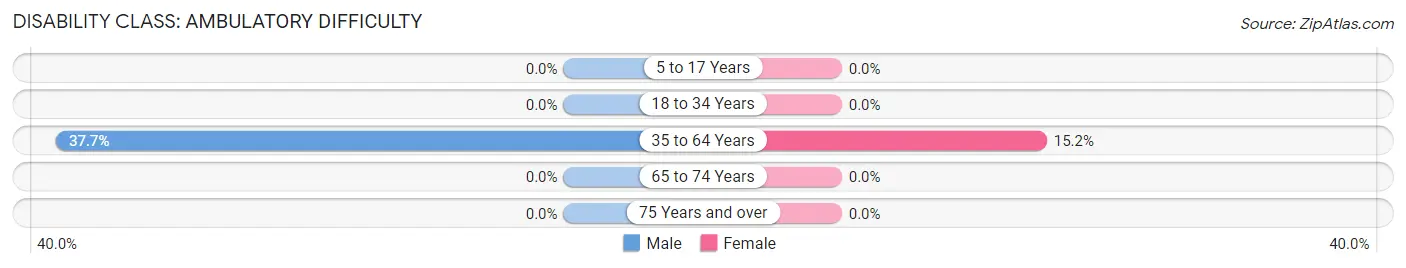
| Age Bracket | Male | Female |
| 5 to 17 Years | 0 (0.0%) | 0 (0.0%) |
| 18 to 34 Years | 0 (0.0%) | 0 (0.0%) |
| 35 to 64 Years | 29 (37.7%) | 14 (15.2%) |
| 65 to 74 Years | 0 (0.0%) | 0 (0.0%) |
| 75 Years and over | 0 (0.0%) | 0 (0.0%) |
Disability Class: Self-Care Difficulty
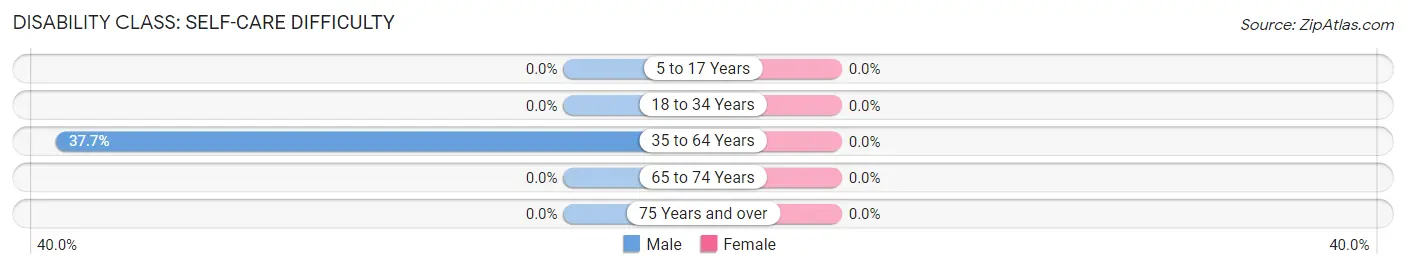
| Age Bracket | Male | Female |
| 5 to 17 Years | 0 (0.0%) | 0 (0.0%) |
| 18 to 34 Years | 0 (0.0%) | 0 (0.0%) |
| 35 to 64 Years | 29 (37.7%) | 0 (0.0%) |
| 65 to 74 Years | 0 (0.0%) | 0 (0.0%) |
| 75 Years and over | 0 (0.0%) | 0 (0.0%) |
Technology Access in Lakeridge
Computing Device Access in Lakeridge
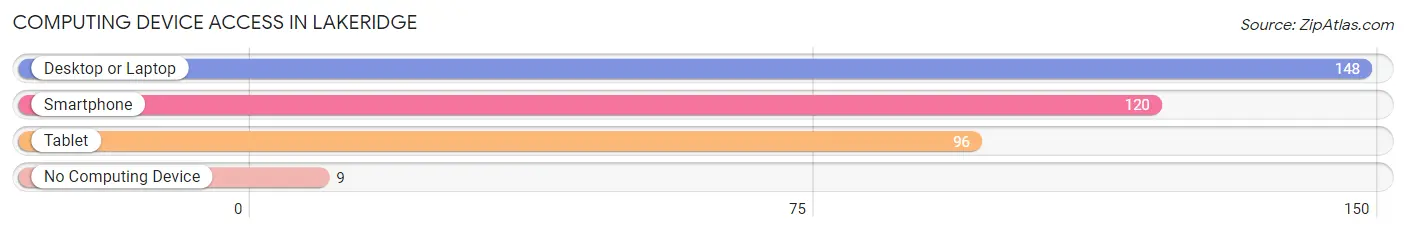
| Device Type | # Households | % Households |
| Desktop or Laptop | 148 | 94.3% |
| Smartphone | 120 | 76.4% |
| Tablet | 96 | 61.2% |
| No Computing Device | 9 | 5.7% |
| Total | 157 | 100.0% |
Internet Access in Lakeridge
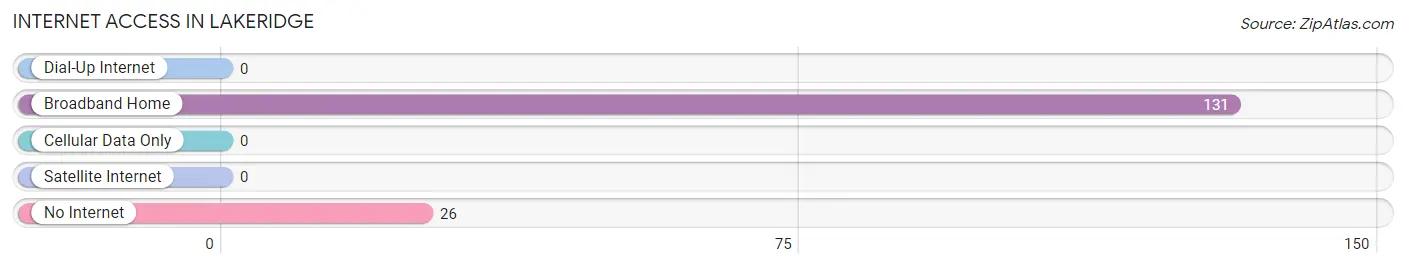
| Internet Type | # Households | % Households |
| Dial-Up Internet | 0 | 0.0% |
| Broadband Home | 131 | 83.4% |
| Cellular Data Only | 0 | 0.0% |
| Satellite Internet | 0 | 0.0% |
| No Internet | 26 | 16.6% |
| Total | 157 | 100.0% |
Lakeridge Summary
Lakeridge is a census-designated place (CDP) located in Washoe County, Nevada, United States. The population was 1,845 at the 2010 census. It is part of the Reno–Sparks Metropolitan Statistical Area.
History
Lakeridge was first settled in the late 19th century by ranchers and farmers. The area was originally known as "Lakeside" and was later changed to "Lakeridge" in the early 20th century. The area was annexed by the City of Reno in the 1950s and was later incorporated as a CDP in the 1970s.
Geography
Lakeridge is located at 39°33'17" North, 119°45'17" West (39.554722, -119.754722). According to the United States Census Bureau, the CDP has a total area of 4.2 square miles (10.8 km2), all of it land.
Economy
Lakeridge is primarily a residential community, with most of its residents commuting to nearby Reno for work. The area is home to several small businesses, including a grocery store, a gas station, and a few restaurants.
Demographics
As of the census of 2000, there were 1,845 people, 717 households, and 517 families residing in the CDP. The population density was 441.3 people per square mile (170.5/km2). There were 771 housing units at an average density of 184.3 per square mile (71.2/km2). The racial makeup of the CDP was 87.2% White, 0.9% African American, 1.7% Native American, 2.2% Asian, 0.1% Pacific Islander, 5.2% from other races, and 3.7% from two or more races. Hispanic or Latino of any race were 11.2% of the population.
There were 717 households, out of which 33.2% had children under the age of 18 living with them, 54.2% were married couples living together, 11.2% had a female householder with no husband present, and 29.7% were non-families. 22.7% of all households were made up of individuals, and 5.2% had someone living alone who was 65 years of age or older. The average household size was 2.57 and the average family size was 3.03.
In the CDP, the population was spread out, with 25.7% under the age of 18, 8.2% from 18 to 24, 32.2% from 25 to 44, 24.2% from 45 to 64, and 9.7% who were 65 years of age or older. The median age was 36 years. For every 100 females, there were 97.2 males. For every 100 females age 18 and over, there were 95.2 males.
The median income for a household in the CDP was $45,938, and the median income for a family was $50,000. Males had a median income of $37,500 versus $27,500 for females. The per capita income for the CDP was $20,945. About 6.2% of families and 8.2% of the population were below the poverty line, including 10.2% of those under age 18 and none of those age 65 or over.
Common Questions
What is Per Capita Income in Lakeridge?
Per Capita income in Lakeridge is $87,363.
What is the Median Family Income in Lakeridge?
Median Family Income in Lakeridge is $85,893.
What is the Median Household income in Lakeridge?
Median Household Income in Lakeridge is $86,734.
What is Inequality or Gini Index in Lakeridge?
Inequality or Gini Index in Lakeridge is 0.50.
What is the Total Population of Lakeridge?
Total Population of Lakeridge is 278.
What is the Total Male Population of Lakeridge?
Total Male Population of Lakeridge is 141.
What is the Total Female Population of Lakeridge?
Total Female Population of Lakeridge is 137.
What is the Ratio of Males per 100 Females in Lakeridge?
There are 102.92 Males per 100 Females in Lakeridge.
What is the Ratio of Females per 100 Males in Lakeridge?
There are 97.16 Females per 100 Males in Lakeridge.
What is the Median Population Age in Lakeridge?
Median Population Age in Lakeridge is 64.2 Years.
What is the Average Family Size in Lakeridge
Average Family Size in Lakeridge is 2.0 People.
What is the Average Household Size in Lakeridge
Average Household Size in Lakeridge is 1.8 People.
How Large is the Labor Force in Lakeridge?
There are 72 People in the Labor Forcein in Lakeridge.
What is the Percentage of People in the Labor Force in Lakeridge?
27.2% of People are in the Labor Force in Lakeridge.