Sun Prairie, MT Map & Demographics
Sun Prairie Map
Sun Prairie Overview
$31,587
PER CAPITA INCOME
$78,661
AVG FAMILY INCOME
$52,311
AVG HOUSEHOLD INCOME
29.9%
WAGE / INCOME GAP [ % ]
70.1¢/ $1
WAGE / INCOME GAP [ $ ]
0.38
INEQUALITY / GINI INDEX
1,366
TOTAL POPULATION
694
MALE POPULATION
672
FEMALE POPULATION
103.27
MALES / 100 FEMALES
96.83
FEMALES / 100 MALES
50.0
MEDIAN AGE
2.7
AVG FAMILY SIZE
2.3
AVG HOUSEHOLD SIZE
675
LABOR FORCE [ PEOPLE ]
59.3%
PERCENT IN LABOR FORCE
Income in Sun Prairie
Income Overview in Sun Prairie
Per Capita Income in Sun Prairie is $31,587, while median incomes of families and households are $78,661 and $52,311 respectively.
| Characteristic | Number | Measure |
| Per Capita Income | 1,366 | $31,587 |
| Median Family Income | 425 | $78,661 |
| Mean Family Income | 425 | $84,501 |
| Median Household Income | 590 | $52,311 |
| Mean Household Income | 590 | $72,137 |
| Income Deficit | 425 | $0 |
| Wage / Income Gap (%) | 1,366 | 29.90% |
| Wage / Income Gap ($) | 1,366 | 70.10¢ per $1 |
| Gini / Inequality Index | 1,366 | 0.38 |
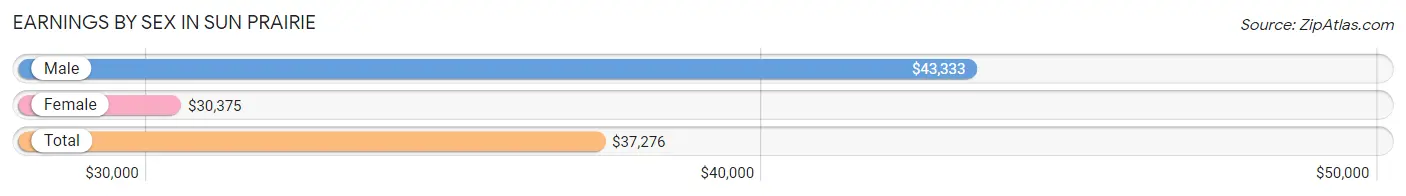
Earnings by Sex in Sun Prairie
Average Earnings in Sun Prairie are $37,276, $43,333 for men and $30,375 for women, a difference of 29.9%.
| Sex | Number | Average Earnings |
| Male | 424 (58.8%) | $43,333 |
| Female | 297 (41.2%) | $30,375 |
| Total | 721 (100.0%) | $37,276 |
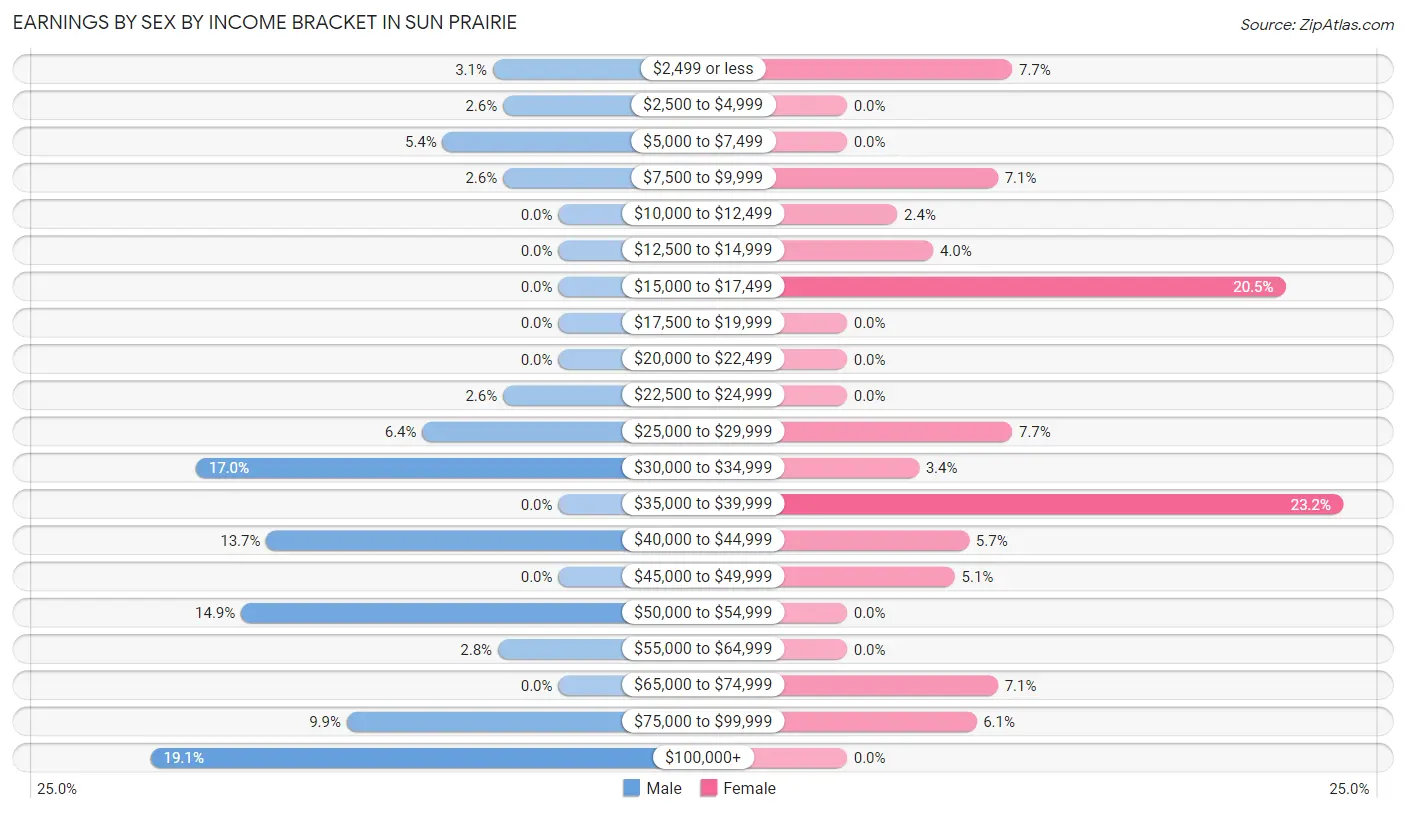
Earnings by Sex by Income Bracket in Sun Prairie
The most common earnings brackets in Sun Prairie are $100,000+ for men (81 | 19.1%) and $35,000 to $39,999 for women (69 | 23.2%).
| Income | Male | Female |
| $2,499 or less | 13 (3.1%) | 23 (7.7%) |
| $2,500 to $4,999 | 11 (2.6%) | 0 (0.0%) |
| $5,000 to $7,499 | 23 (5.4%) | 0 (0.0%) |
| $7,500 to $9,999 | 11 (2.6%) | 21 (7.1%) |
| $10,000 to $12,499 | 0 (0.0%) | 7 (2.4%) |
| $12,500 to $14,999 | 0 (0.0%) | 12 (4.0%) |
| $15,000 to $17,499 | 0 (0.0%) | 61 (20.5%) |
| $17,500 to $19,999 | 0 (0.0%) | 0 (0.0%) |
| $20,000 to $22,499 | 0 (0.0%) | 0 (0.0%) |
| $22,500 to $24,999 | 11 (2.6%) | 0 (0.0%) |
| $25,000 to $29,999 | 27 (6.4%) | 23 (7.7%) |
| $30,000 to $34,999 | 72 (17.0%) | 10 (3.4%) |
| $35,000 to $39,999 | 0 (0.0%) | 69 (23.2%) |
| $40,000 to $44,999 | 58 (13.7%) | 17 (5.7%) |
| $45,000 to $49,999 | 0 (0.0%) | 15 (5.1%) |
| $50,000 to $54,999 | 63 (14.9%) | 0 (0.0%) |
| $55,000 to $64,999 | 12 (2.8%) | 0 (0.0%) |
| $65,000 to $74,999 | 0 (0.0%) | 21 (7.1%) |
| $75,000 to $99,999 | 42 (9.9%) | 18 (6.1%) |
| $100,000+ | 81 (19.1%) | 0 (0.0%) |
| Total | 424 (100.0%) | 297 (100.0%) |
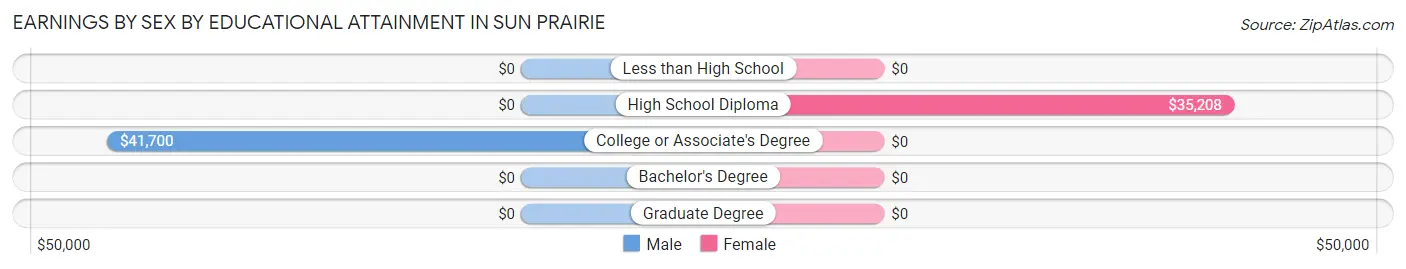
Earnings by Sex by Educational Attainment in Sun Prairie
Average earnings in Sun Prairie are $51,151 for men and $35,128 for women, a difference of 31.3%. Men with an educational attainment of college or associate's degree enjoy the highest average annual earnings of $41,700, while those with college or associate's degree education earn the least with $41,700. Women with an educational attainment of high school diploma earn the most with the average annual earnings of $35,208, while those with high school diploma education have the smallest earnings of $35,208.
| Educational Attainment | Male Income | Female Income |
| Less than High School | - | - |
| High School Diploma | - | - |
| College or Associate's Degree | $41,700 | $0 |
| Bachelor's Degree | - | - |
| Graduate Degree | - | - |
| Total | $51,151 | $35,128 |
Family Income in Sun Prairie
Family Income Brackets in Sun Prairie
According to the Sun Prairie family income data, there are 112 families falling into the $100,000 to $149,999 income range, which is the most common income bracket and makes up 26.4% of all families.
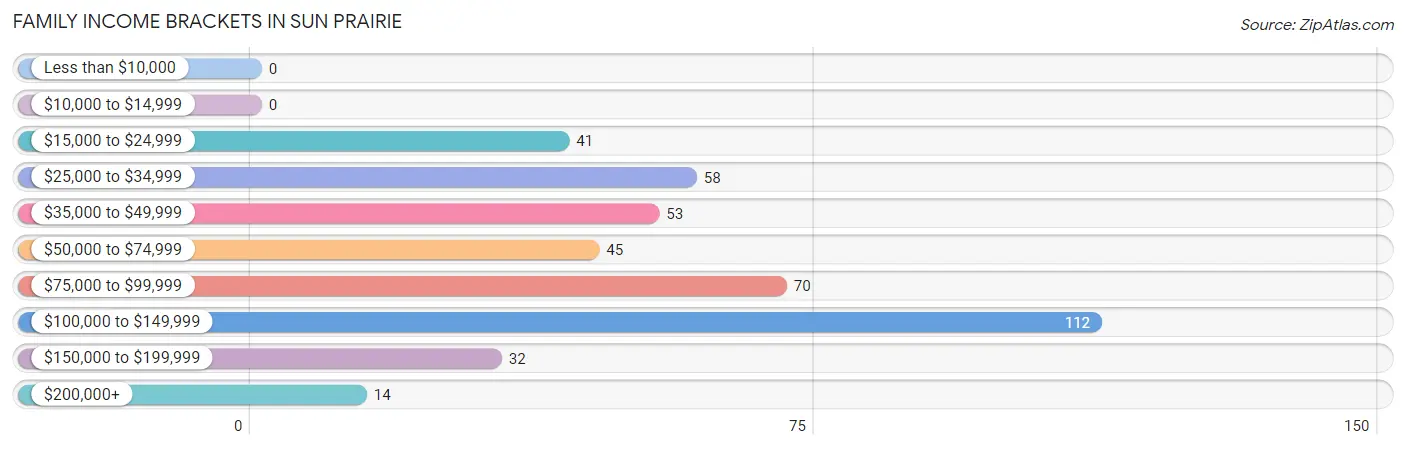
| Income Bracket | # Families | % Families |
| Less than $10,000 | 0 | 0.0% |
| $10,000 to $14,999 | 0 | 0.0% |
| $15,000 to $24,999 | 41 | 9.6% |
| $25,000 to $34,999 | 58 | 13.6% |
| $35,000 to $49,999 | 53 | 12.5% |
| $50,000 to $74,999 | 45 | 10.6% |
| $75,000 to $99,999 | 70 | 16.5% |
| $100,000 to $149,999 | 112 | 26.4% |
| $150,000 to $199,999 | 32 | 7.5% |
| $200,000+ | 14 | 3.3% |
Family Income by Famaliy Size in Sun Prairie
4-person families (37 | 8.7%) account for the highest median family income in Sun Prairie with $198,977 per family, while 4-person families (37 | 8.7%) have the highest median income of $49,744 per family member.
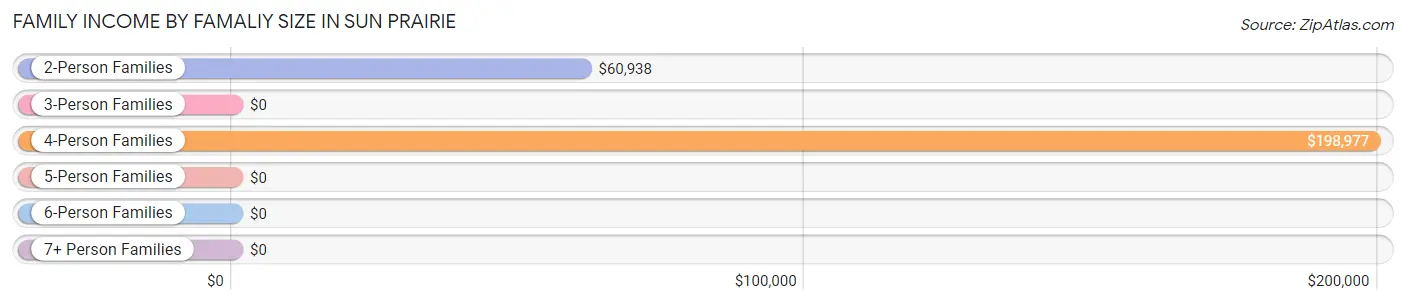
| Income Bracket | # Families | Median Income |
| 2-Person Families | 243 (57.2%) | $60,938 |
| 3-Person Families | 131 (30.8%) | $0 |
| 4-Person Families | 37 (8.7%) | $198,977 |
| 5-Person Families | 14 (3.3%) | $0 |
| 6-Person Families | 0 (0.0%) | $0 |
| 7+ Person Families | 0 (0.0%) | $0 |
| Total | 425 (100.0%) | $78,661 |
Family Income by Number of Earners in Sun Prairie
The median family income in Sun Prairie is $78,661, with families comprising 3+ earners (32) having the highest median family income of $199,545, while families with 1 earner (117) have the lowest median family income of $34,401, accounting for 7.5% and 27.5% of families, respectively.
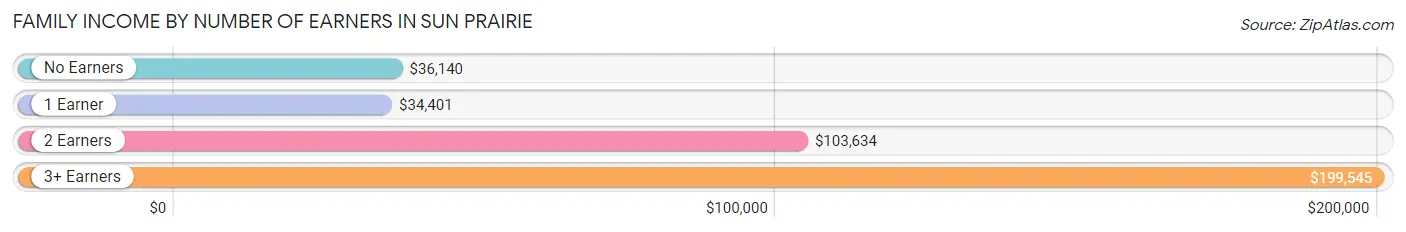
| Number of Earners | # Families | Median Income |
| No Earners | 89 (20.9%) | $36,140 |
| 1 Earner | 117 (27.5%) | $34,401 |
| 2 Earners | 187 (44.0%) | $103,634 |
| 3+ Earners | 32 (7.5%) | $199,545 |
| Total | 425 (100.0%) | $78,661 |
Household Income in Sun Prairie
Household Income Brackets in Sun Prairie
With 122 households falling in the category, the $100,000 to $149,999 income range is the most frequent in Sun Prairie, accounting for 20.7% of all households.
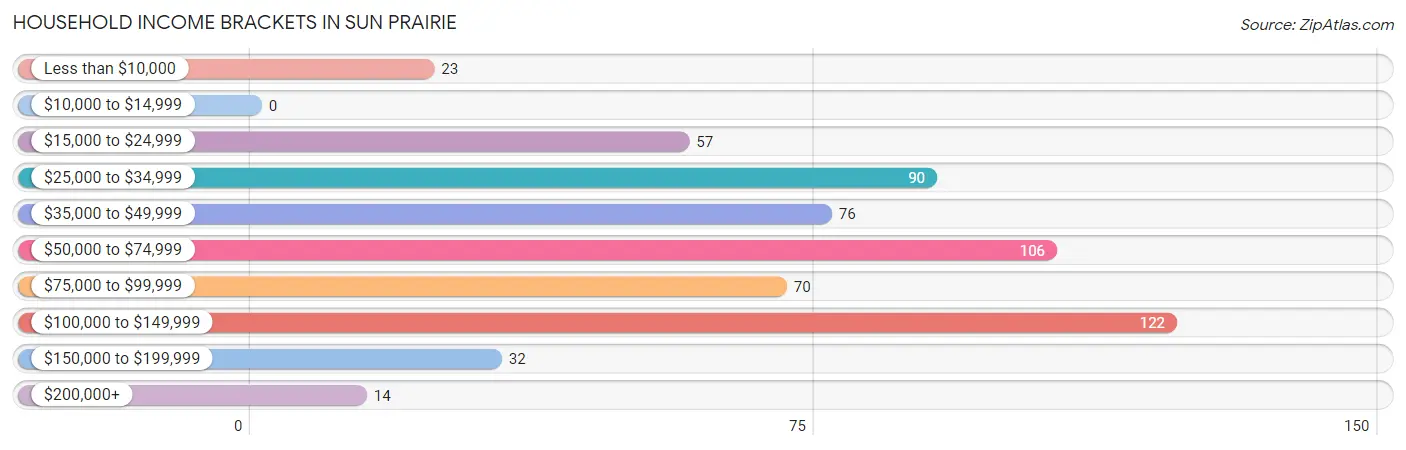
| Income Bracket | # Households | % Households |
| Less than $10,000 | 23 | 3.9% |
| $10,000 to $14,999 | 0 | 0.0% |
| $15,000 to $24,999 | 57 | 9.7% |
| $25,000 to $34,999 | 90 | 15.3% |
| $35,000 to $49,999 | 76 | 12.9% |
| $50,000 to $74,999 | 106 | 18.0% |
| $75,000 to $99,999 | 70 | 11.9% |
| $100,000 to $149,999 | 122 | 20.7% |
| $150,000 to $199,999 | 32 | 5.4% |
| $200,000+ | 14 | 2.4% |
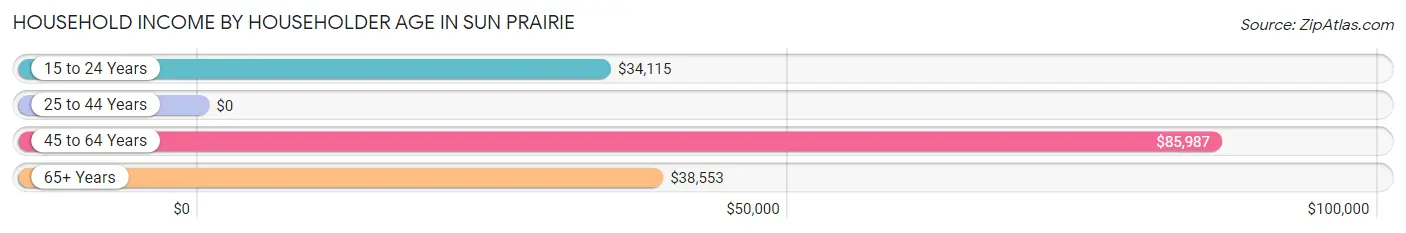
Household Income by Householder Age in Sun Prairie
The median household income in Sun Prairie is $52,311, with the highest median household income of $85,987 found in the 45 to 64 years age bracket for the primary householder. A total of 277 households (46.9%) fall into this category. Meanwhile, the 25 to 44 years age bracket for the primary householder has the lowest median household income of $0, with 73 households (12.4%) in this group.
| Income Bracket | # Households | Median Income |
| 15 to 24 Years | 62 (10.5%) | $34,115 |
| 25 to 44 Years | 73 (12.4%) | $0 |
| 45 to 64 Years | 277 (46.9%) | $85,987 |
| 65+ Years | 178 (30.2%) | $38,553 |
| Total | 590 (100.0%) | $52,311 |
Poverty in Sun Prairie
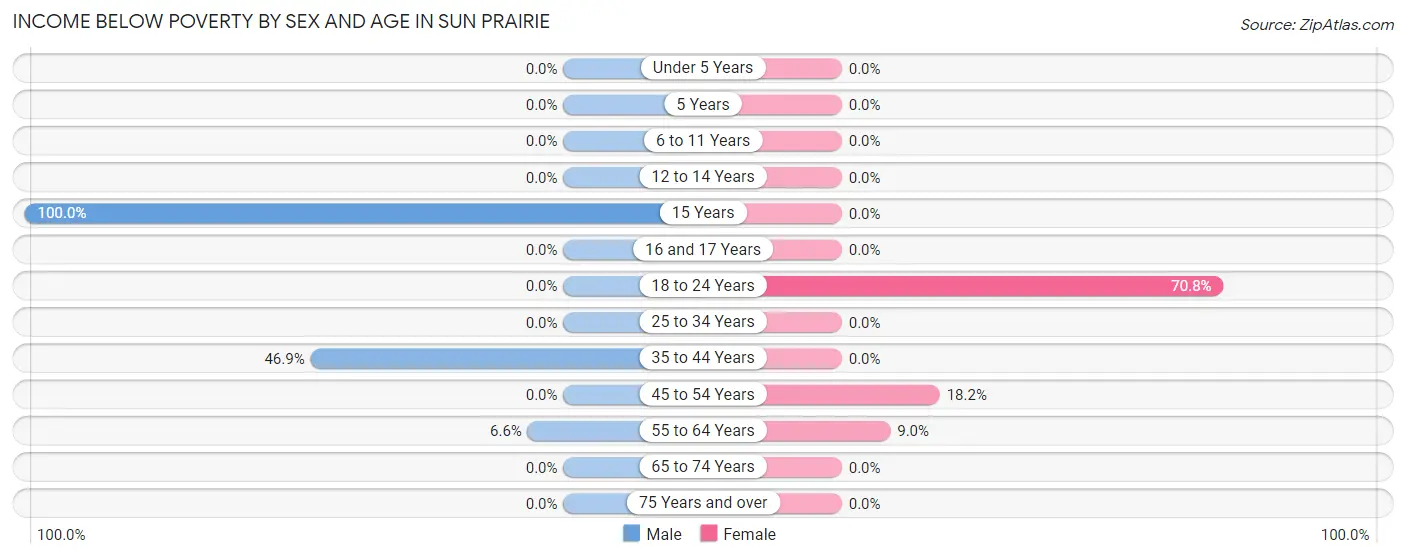
Income Below Poverty by Sex and Age in Sun Prairie
With 10.5% poverty level for males and 10.7% for females among the residents of Sun Prairie, 15 year old males and 18 to 24 year old females are the most vulnerable to poverty, with 41 males (100.0%) and 51 females (70.8%) in their respective age groups living below the poverty level.
| Age Bracket | Male | Female |
| Under 5 Years | 0 (0.0%) | 0 (0.0%) |
| 5 Years | 0 (0.0%) | 0 (0.0%) |
| 6 to 11 Years | 0 (0.0%) | 0 (0.0%) |
| 12 to 14 Years | 0 (0.0%) | 0 (0.0%) |
| 15 Years | 41 (100.0%) | 0 (0.0%) |
| 16 and 17 Years | 0 (0.0%) | 0 (0.0%) |
| 18 to 24 Years | 0 (0.0%) | 51 (70.8%) |
| 25 to 34 Years | 0 (0.0%) | 0 (0.0%) |
| 35 to 44 Years | 23 (46.9%) | 0 (0.0%) |
| 45 to 54 Years | 0 (0.0%) | 12 (18.2%) |
| 55 to 64 Years | 9 (6.6%) | 9 (9.0%) |
| 65 to 74 Years | 0 (0.0%) | 0 (0.0%) |
| 75 Years and over | 0 (0.0%) | 0 (0.0%) |
| Total | 73 (10.5%) | 72 (10.7%) |
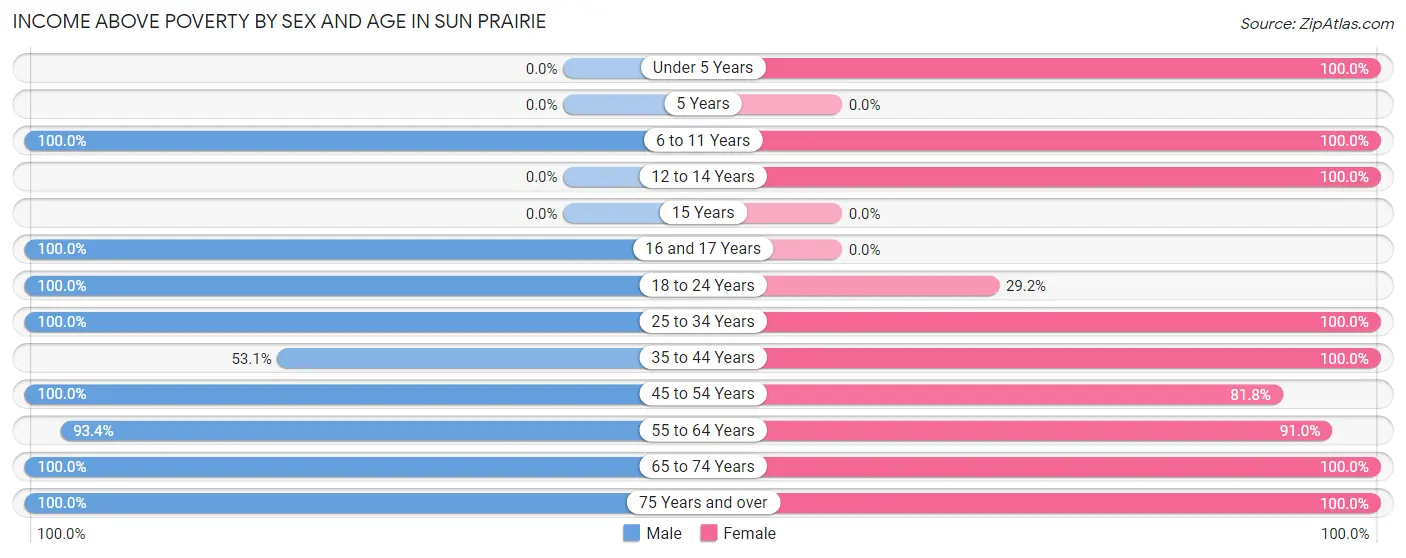
Income Above Poverty by Sex and Age in Sun Prairie
According to the poverty statistics in Sun Prairie, males aged 6 to 11 years and females aged under 5 years are the age groups that are most secure financially, with 100.0% of males and 100.0% of females in these age groups living above the poverty line.
| Age Bracket | Male | Female |
| Under 5 Years | 0 (0.0%) | 101 (100.0%) |
| 5 Years | 0 (0.0%) | 0 (0.0%) |
| 6 to 11 Years | 31 (100.0%) | 26 (100.0%) |
| 12 to 14 Years | 0 (0.0%) | 28 (100.0%) |
| 15 Years | 0 (0.0%) | 0 (0.0%) |
| 16 and 17 Years | 21 (100.0%) | 0 (0.0%) |
| 18 to 24 Years | 73 (100.0%) | 21 (29.2%) |
| 25 to 34 Years | 33 (100.0%) | 102 (100.0%) |
| 35 to 44 Years | 26 (53.1%) | 37 (100.0%) |
| 45 to 54 Years | 117 (100.0%) | 54 (81.8%) |
| 55 to 64 Years | 127 (93.4%) | 91 (91.0%) |
| 65 to 74 Years | 126 (100.0%) | 128 (100.0%) |
| 75 Years and over | 67 (100.0%) | 12 (100.0%) |
| Total | 621 (89.5%) | 600 (89.3%) |
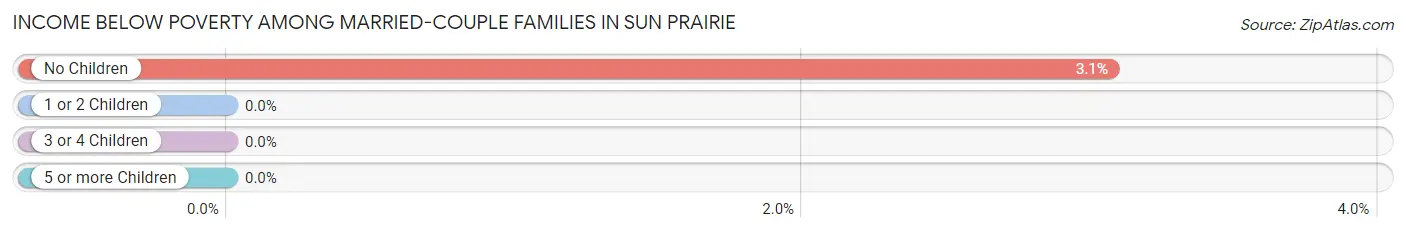
Income Below Poverty Among Married-Couple Families in Sun Prairie
The poverty statistics for married-couple families in Sun Prairie show that 2.6% or 9 of the total 352 families live below the poverty line. Families with no children have the highest poverty rate of 3.1%, comprising of 9 families. On the other hand, families with 1 or 2 children have the lowest poverty rate of 0.0%, which includes 0 families.
| Children | Above Poverty | Below Poverty |
| No Children | 284 (96.9%) | 9 (3.1%) |
| 1 or 2 Children | 45 (100.0%) | 0 (0.0%) |
| 3 or 4 Children | 14 (100.0%) | 0 (0.0%) |
| 5 or more Children | 0 (0.0%) | 0 (0.0%) |
| Total | 343 (97.4%) | 9 (2.6%) |
Income Below Poverty Among Single-Parent Households in Sun Prairie
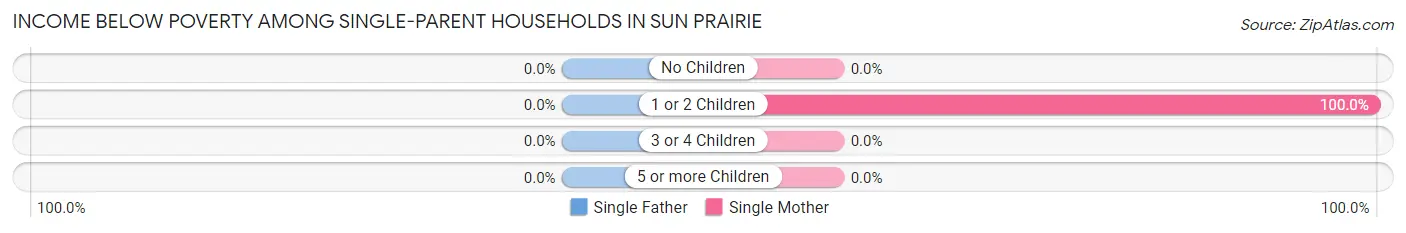
| Children | Single Father | Single Mother |
| No Children | 0 (0.0%) | 0 (0.0%) |
| 1 or 2 Children | 0 (0.0%) | 12 (100.0%) |
| 3 or 4 Children | 0 (0.0%) | 0 (0.0%) |
| 5 or more Children | 0 (0.0%) | 0 (0.0%) |
| Total | 0 (0.0%) | 12 (100.0%) |
Income Below Poverty Among Married-Couple vs Single-Parent Households in Sun Prairie
The poverty data for Sun Prairie shows that 9 of the married-couple family households (2.6%) and 12 of the single-parent households (16.4%) are living below the poverty level. Within the married-couple family households, those with no children have the highest poverty rate, with 9 households (3.1%) falling below the poverty line. Among the single-parent households, those with 1 or 2 children have the highest poverty rate, with 12 household (16.4%) living below poverty.
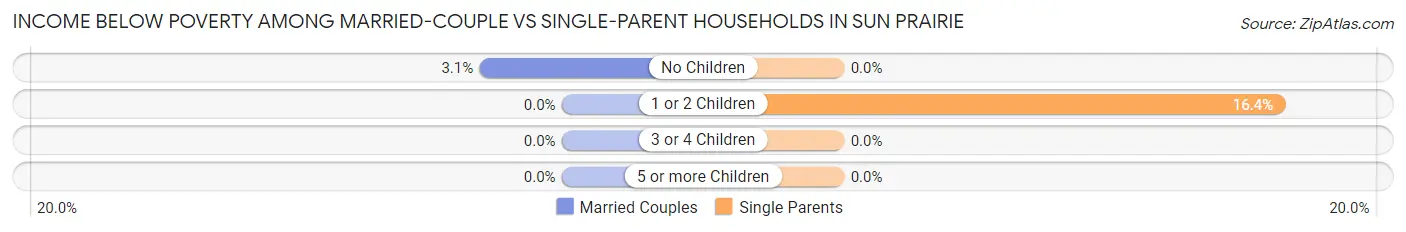
| Children | Married-Couple Families | Single-Parent Households |
| No Children | 9 (3.1%) | 0 (0.0%) |
| 1 or 2 Children | 0 (0.0%) | 12 (16.4%) |
| 3 or 4 Children | 0 (0.0%) | 0 (0.0%) |
| 5 or more Children | 0 (0.0%) | 0 (0.0%) |
| Total | 9 (2.6%) | 12 (16.4%) |
Race in Sun Prairie
The most populous races in Sun Prairie are White / Caucasian (1,254 | 91.8%), Two or more Races (73 | 5.3%), and Native / Alaskan (39 | 2.9%).
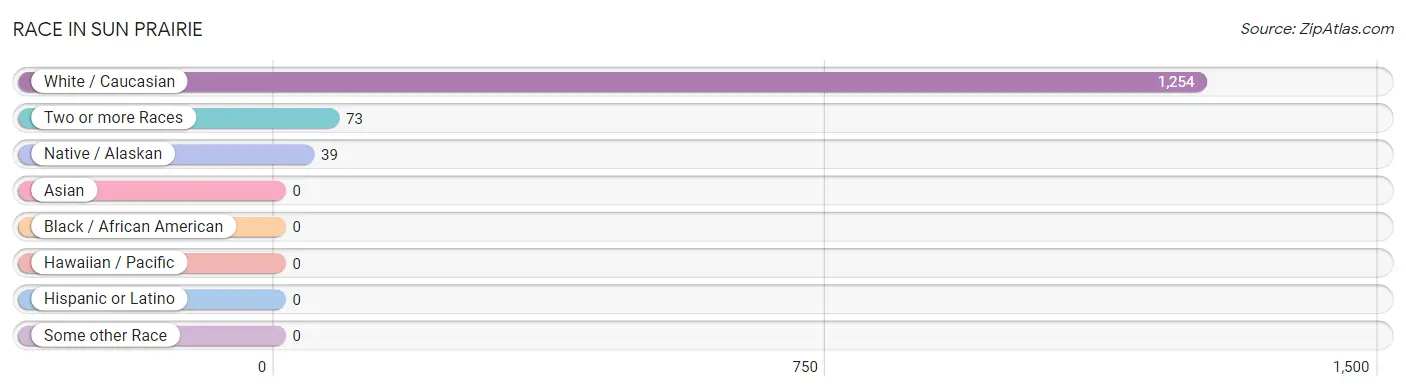
| Race | # Population | % Population |
| Asian | 0 | 0.0% |
| Black / African American | 0 | 0.0% |
| Hawaiian / Pacific | 0 | 0.0% |
| Hispanic or Latino | 0 | 0.0% |
| Native / Alaskan | 39 | 2.9% |
| White / Caucasian | 1,254 | 91.8% |
| Two or more Races | 73 | 5.3% |
| Some other Race | 0 | 0.0% |
| Total | 1,366 | 100.0% |
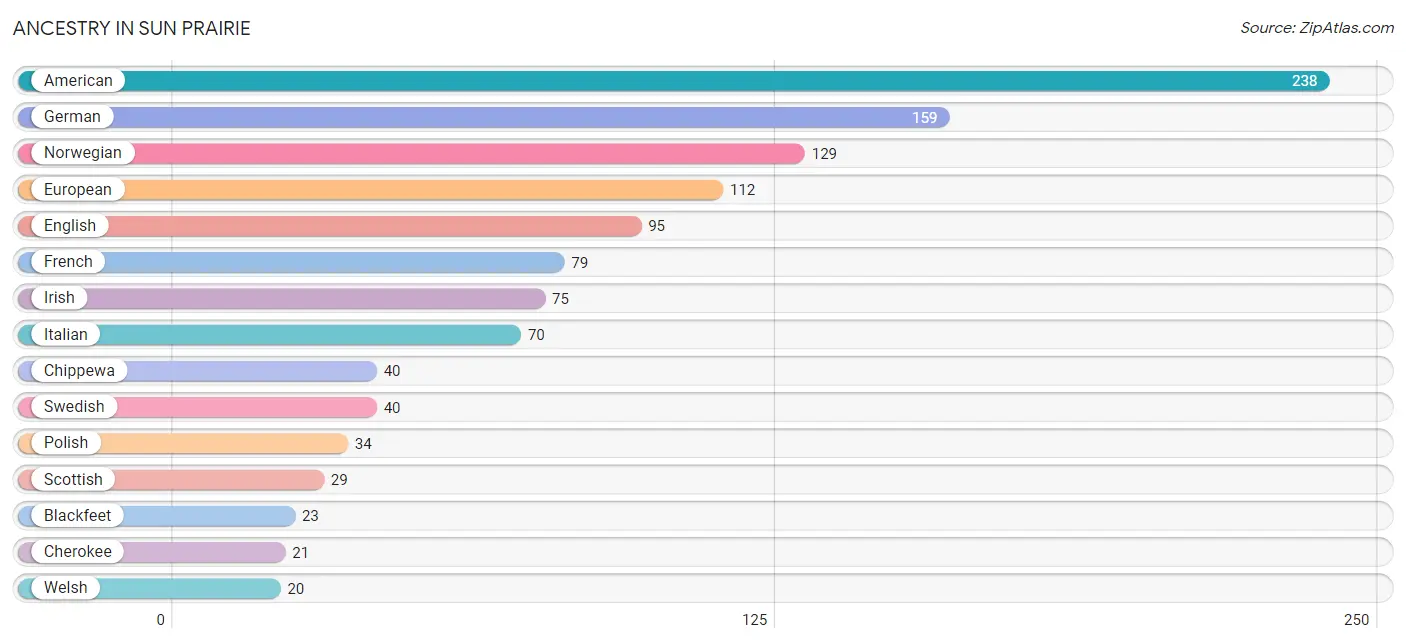
Ancestry in Sun Prairie
The most populous ancestries reported in Sun Prairie are American (238 | 17.4%), German (159 | 11.6%), Norwegian (129 | 9.4%), European (112 | 8.2%), and English (95 | 7.0%), together accounting for 53.6% of all Sun Prairie residents.
| Ancestry | # Population | % Population |
| American | 238 | 17.4% |
| Austrian | 14 | 1.0% |
| Blackfeet | 23 | 1.7% |
| Cherokee | 21 | 1.5% |
| Chippewa | 40 | 2.9% |
| Danish | 8 | 0.6% |
| English | 95 | 7.0% |
| European | 112 | 8.2% |
| Finnish | 8 | 0.6% |
| French | 79 | 5.8% |
| French Canadian | 9 | 0.7% |
| German | 159 | 11.6% |
| Hungarian | 10 | 0.7% |
| Irish | 75 | 5.5% |
| Italian | 70 | 5.1% |
| Norwegian | 129 | 9.4% |
| Polish | 34 | 2.5% |
| Scandinavian | 9 | 0.7% |
| Scotch-Irish | 9 | 0.7% |
| Scottish | 29 | 2.1% |
| Swedish | 40 | 2.9% |
| Ukrainian | 7 | 0.5% |
| Welsh | 20 | 1.5% | View All 23 Rows |
Immigrants in Sun Prairie

| Immigration Origin | # Population | % Population | View All 0 Rows |
Sex and Age in Sun Prairie
Sex and Age in Sun Prairie
The most populous age groups in Sun Prairie are 60 to 64 Years (101 | 14.5%) for men and Under 5 Years (101 | 15.0%) for women.
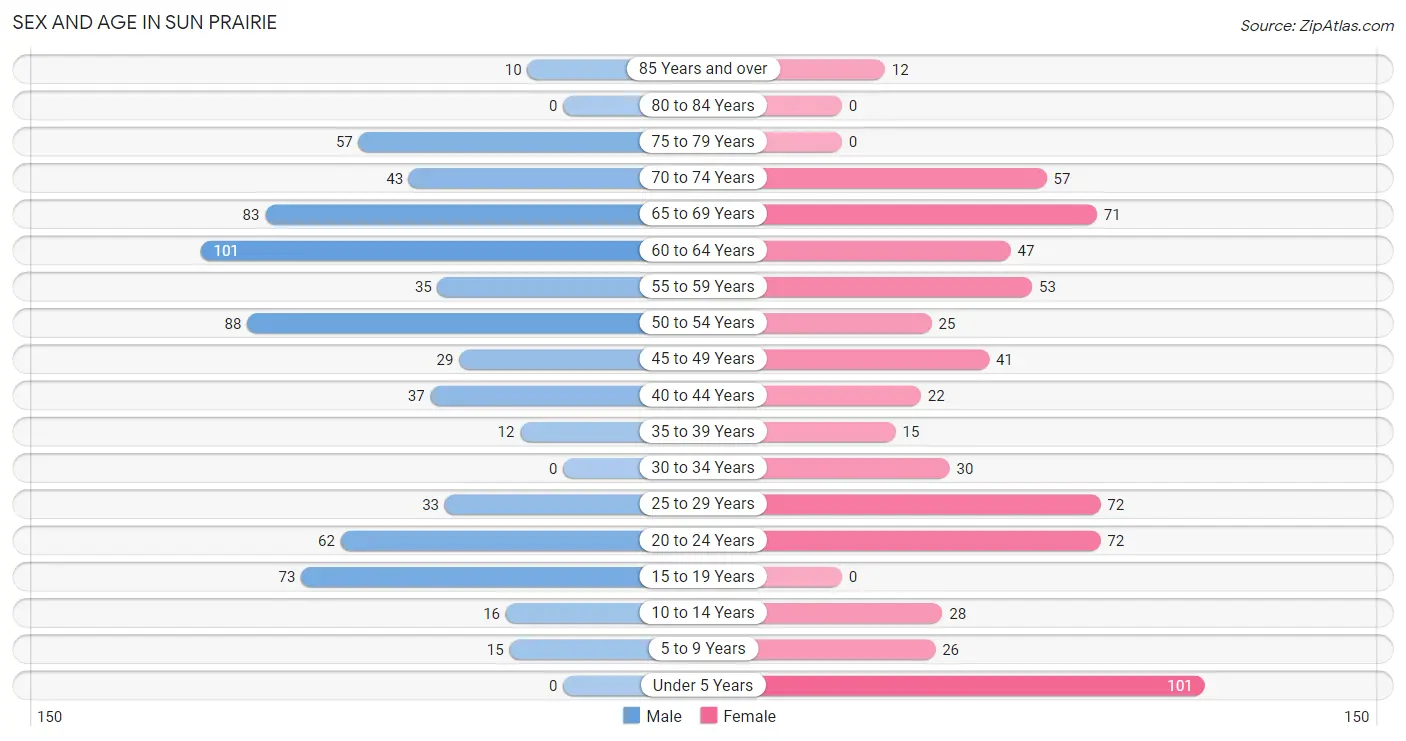
| Age Bracket | Male | Female |
| Under 5 Years | 0 (0.0%) | 101 (15.0%) |
| 5 to 9 Years | 15 (2.2%) | 26 (3.9%) |
| 10 to 14 Years | 16 (2.3%) | 28 (4.2%) |
| 15 to 19 Years | 73 (10.5%) | 0 (0.0%) |
| 20 to 24 Years | 62 (8.9%) | 72 (10.7%) |
| 25 to 29 Years | 33 (4.8%) | 72 (10.7%) |
| 30 to 34 Years | 0 (0.0%) | 30 (4.5%) |
| 35 to 39 Years | 12 (1.7%) | 15 (2.2%) |
| 40 to 44 Years | 37 (5.3%) | 22 (3.3%) |
| 45 to 49 Years | 29 (4.2%) | 41 (6.1%) |
| 50 to 54 Years | 88 (12.7%) | 25 (3.7%) |
| 55 to 59 Years | 35 (5.0%) | 53 (7.9%) |
| 60 to 64 Years | 101 (14.5%) | 47 (7.0%) |
| 65 to 69 Years | 83 (12.0%) | 71 (10.6%) |
| 70 to 74 Years | 43 (6.2%) | 57 (8.5%) |
| 75 to 79 Years | 57 (8.2%) | 0 (0.0%) |
| 80 to 84 Years | 0 (0.0%) | 0 (0.0%) |
| 85 Years and over | 10 (1.4%) | 12 (1.8%) |
| Total | 694 (100.0%) | 672 (100.0%) |
Families and Households in Sun Prairie
Median Family Size in Sun Prairie
The median family size in Sun Prairie is 2.71 persons per family, with single female/mother families (12 | 2.8%) accounting for the largest median family size of 4.42 persons per family. On the other hand, single male/father families (61 | 14.3%) represent the smallest median family size with 2.44 persons per family.
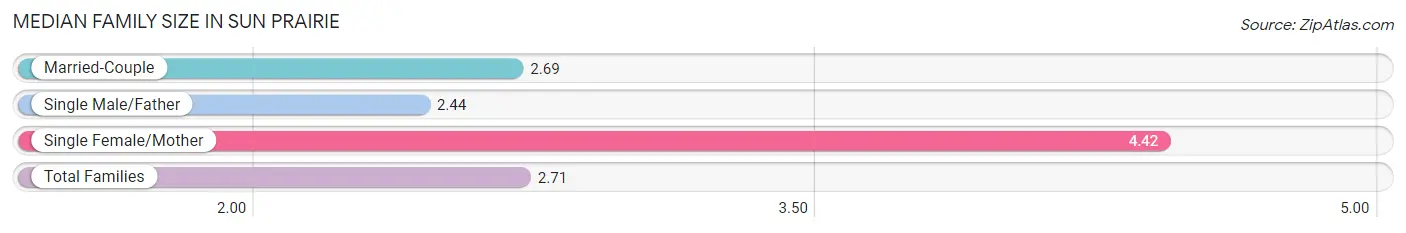
| Family Type | # Families | Family Size |
| Married-Couple | 352 (82.8%) | 2.69 |
| Single Male/Father | 61 (14.3%) | 2.44 |
| Single Female/Mother | 12 (2.8%) | 4.42 |
| Total Families | 425 (100.0%) | 2.71 |
Median Household Size in Sun Prairie
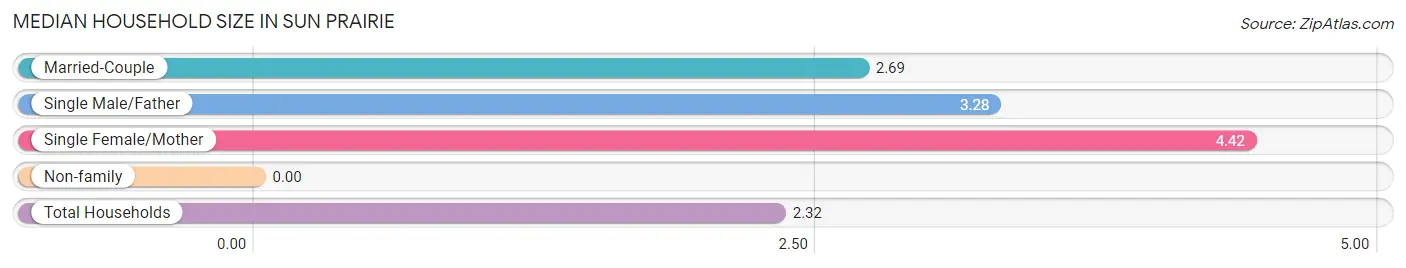
| Household Type | # Households | Household Size |
| Married-Couple | 352 (59.7%) | 2.69 |
| Single Male/Father | 61 (10.3%) | 3.28 |
| Single Female/Mother | 12 (2.0%) | 4.42 |
| Non-family | 165 (28.0%) | - |
| Total Households | 590 (100.0%) | 2.32 |
Household Size by Marriage Status in Sun Prairie
Out of a total of 590 households in Sun Prairie, 425 (72.0%) are family households, while 165 (28.0%) are nonfamily households. The most numerous type of family households are 2-person households, comprising 243, and the most common type of nonfamily households are 1-person households, comprising 165.
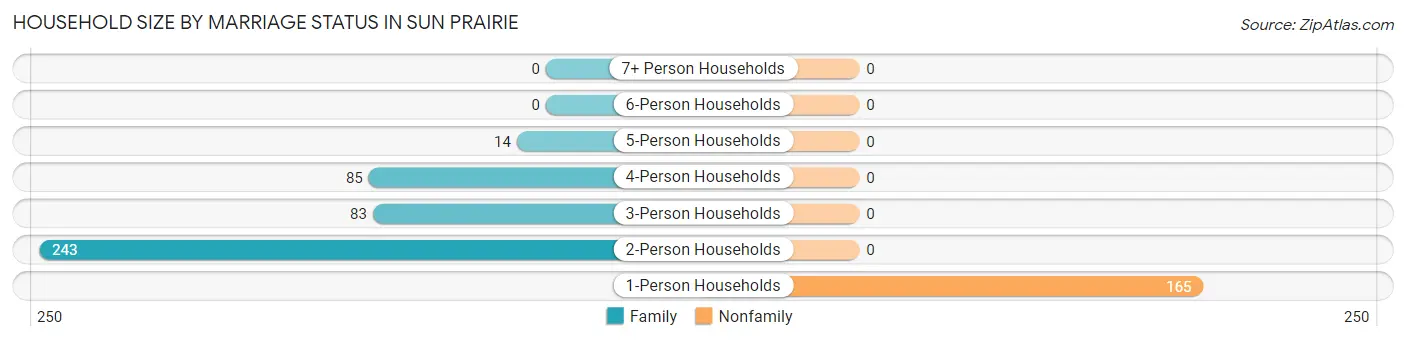
| Household Size | Family Households | Nonfamily Households |
| 1-Person Households | - | 165 (28.0%) |
| 2-Person Households | 243 (41.2%) | 0 (0.0%) |
| 3-Person Households | 83 (14.1%) | 0 (0.0%) |
| 4-Person Households | 85 (14.4%) | 0 (0.0%) |
| 5-Person Households | 14 (2.4%) | 0 (0.0%) |
| 6-Person Households | 0 (0.0%) | 0 (0.0%) |
| 7+ Person Households | 0 (0.0%) | 0 (0.0%) |
| Total | 425 (72.0%) | 165 (28.0%) |
Female Fertility in Sun Prairie
Fertility by Age in Sun Prairie
| Age Bracket | Women with Births | Births / 1,000 Women |
| 15 to 19 years | 0 (0.0%) | 0.0 |
| 20 to 34 years | 0 (0.0%) | 0.0 |
| 35 to 50 years | 0 (0.0%) | 0.0 |
| Total | 0 (0.0%) | 0.0 |
Fertility by Age by Marriage Status in Sun Prairie
| Age Bracket | Married | Unmarried |
| 15 to 19 years | 0 (0.0%) | 0 (0.0%) |
| 20 to 34 years | 0 (0.0%) | 0 (0.0%) |
| 35 to 50 years | 0 (0.0%) | 0 (0.0%) |
| Total | 0 (0.0%) | 0 (0.0%) |
Fertility by Education in Sun Prairie
| Educational Attainment | Women with Births | Births / 1,000 Women |
| Less than High School | 0 (0.0%) | 0.0 |
| High School Diploma | 0 (0.0%) | 0.0 |
| College or Associate's Degree | 0 (0.0%) | 0.0 |
| Bachelor's Degree | 0 (0.0%) | 0.0 |
| Graduate Degree | 0 (0.0%) | 0.0 |
| Total | 0 (0.0%) | 0.0 |
Fertility by Education by Marriage Status in Sun Prairie
| Educational Attainment | Married | Unmarried |
| Less than High School | 0 (0.0%) | 0 (0.0%) |
| High School Diploma | 0 (0.0%) | 0 (0.0%) |
| College or Associate's Degree | 0 (0.0%) | 0 (0.0%) |
| Bachelor's Degree | 0 (0.0%) | 0 (0.0%) |
| Graduate Degree | 0 (0.0%) | 0 (0.0%) |
| Total | 0 (0.0%) | 0 (0.0%) |
Employment Characteristics in Sun Prairie
Employment by Class of Employer in Sun Prairie
Among the 675 employed individuals in Sun Prairie, private company employees (434 | 64.3%), not-for-profit organizations (98 | 14.5%), and local government employees (45 | 6.7%) make up the most common classes of employment.
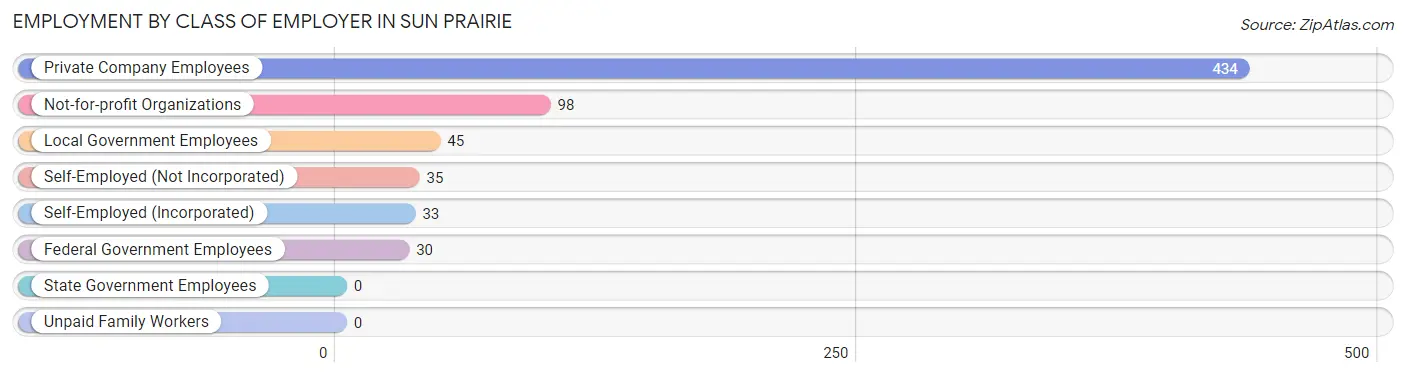
| Employer Class | # Employees | % Employees |
| Private Company Employees | 434 | 64.3% |
| Self-Employed (Incorporated) | 33 | 4.9% |
| Self-Employed (Not Incorporated) | 35 | 5.2% |
| Not-for-profit Organizations | 98 | 14.5% |
| Local Government Employees | 45 | 6.7% |
| State Government Employees | 0 | 0.0% |
| Federal Government Employees | 30 | 4.4% |
| Unpaid Family Workers | 0 | 0.0% |
| Total | 675 | 100.0% |
Employment Status by Age in Sun Prairie
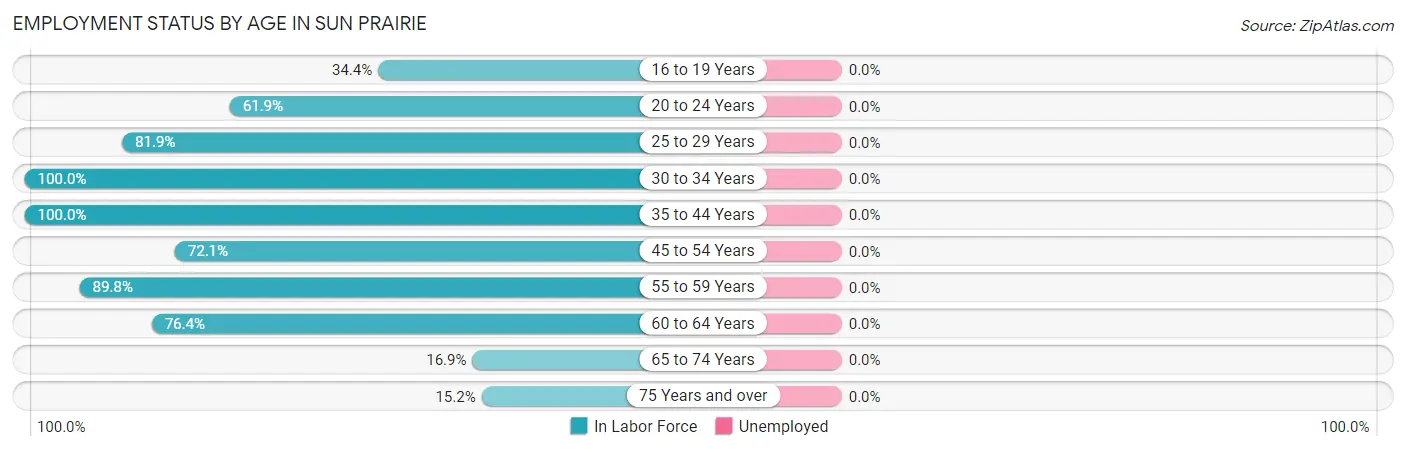
| Age Bracket | In Labor Force | Unemployed |
| 16 to 19 Years | 11 (34.4%) | 0 (0.0%) |
| 20 to 24 Years | 83 (61.9%) | 0 (0.0%) |
| 25 to 29 Years | 86 (81.9%) | 0 (0.0%) |
| 30 to 34 Years | 30 (100.0%) | 0 (0.0%) |
| 35 to 44 Years | 86 (100.0%) | 0 (0.0%) |
| 45 to 54 Years | 132 (72.1%) | 0 (0.0%) |
| 55 to 59 Years | 79 (89.8%) | 0 (0.0%) |
| 60 to 64 Years | 113 (76.4%) | 0 (0.0%) |
| 65 to 74 Years | 43 (16.9%) | 0 (0.0%) |
| 75 Years and over | 12 (15.2%) | 0 (0.0%) |
| Total | 675 (59.3%) | 0 (0.0%) |
Employment Status by Educational Attainment in Sun Prairie
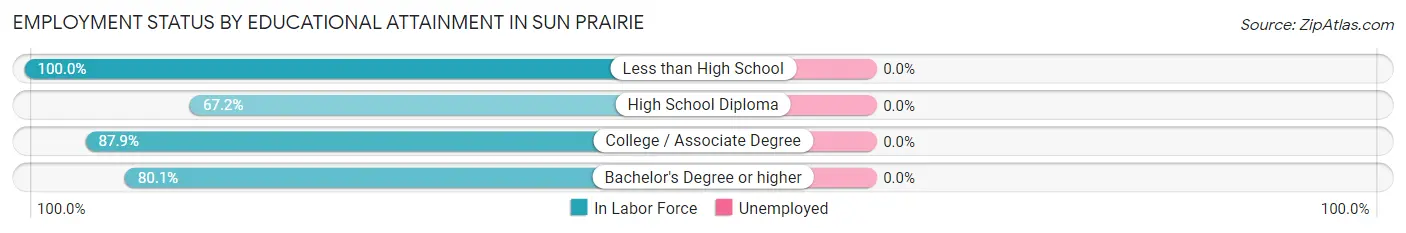
| Educational Attainment | In Labor Force | Unemployed |
| Less than High School | 65 (100.0%) | 0 (0.0%) |
| High School Diploma | 92 (67.2%) | 0 (0.0%) |
| College / Associate Degree | 204 (87.9%) | 0 (0.0%) |
| Bachelor's Degree or higher | 165 (80.1%) | 0 (0.0%) |
| Total | 526 (82.2%) | 0 (0.0%) |
Employment Occupations by Sex in Sun Prairie
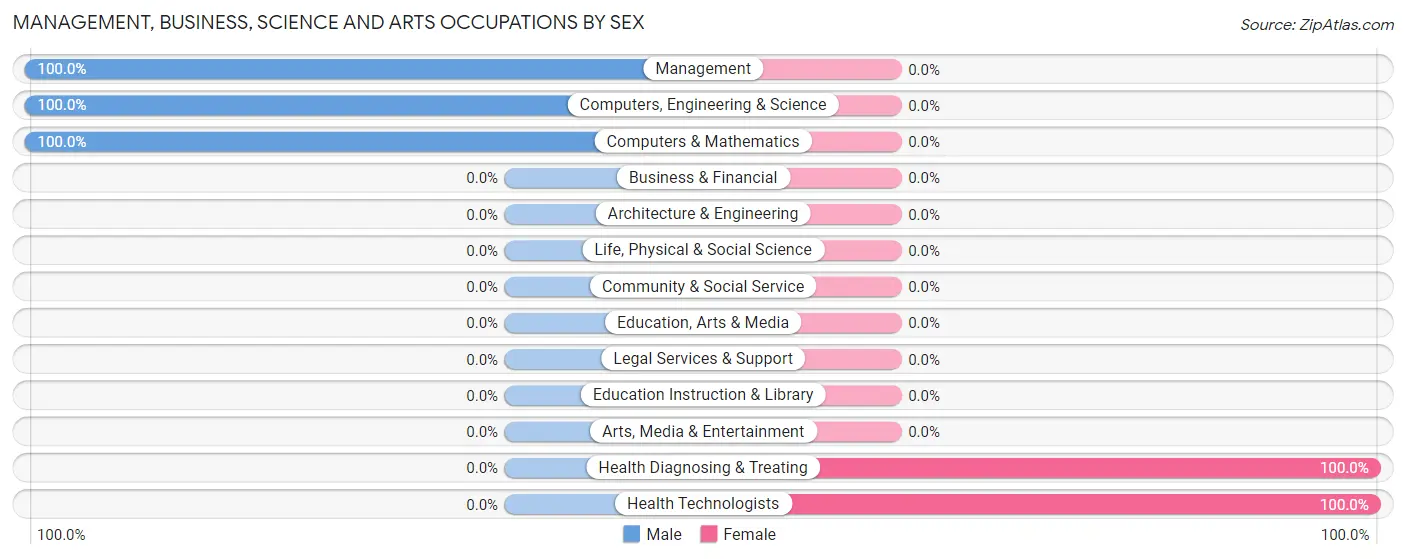
Management, Business, Science and Arts Occupations
The most common Management, Business, Science and Arts occupations in Sun Prairie are Management (70 | 10.7%), Health Diagnosing & Treating (38 | 5.8%), Health Technologists (23 | 3.5%), Computers, Engineering & Science (10 | 1.5%), and Computers & Mathematics (10 | 1.5%).
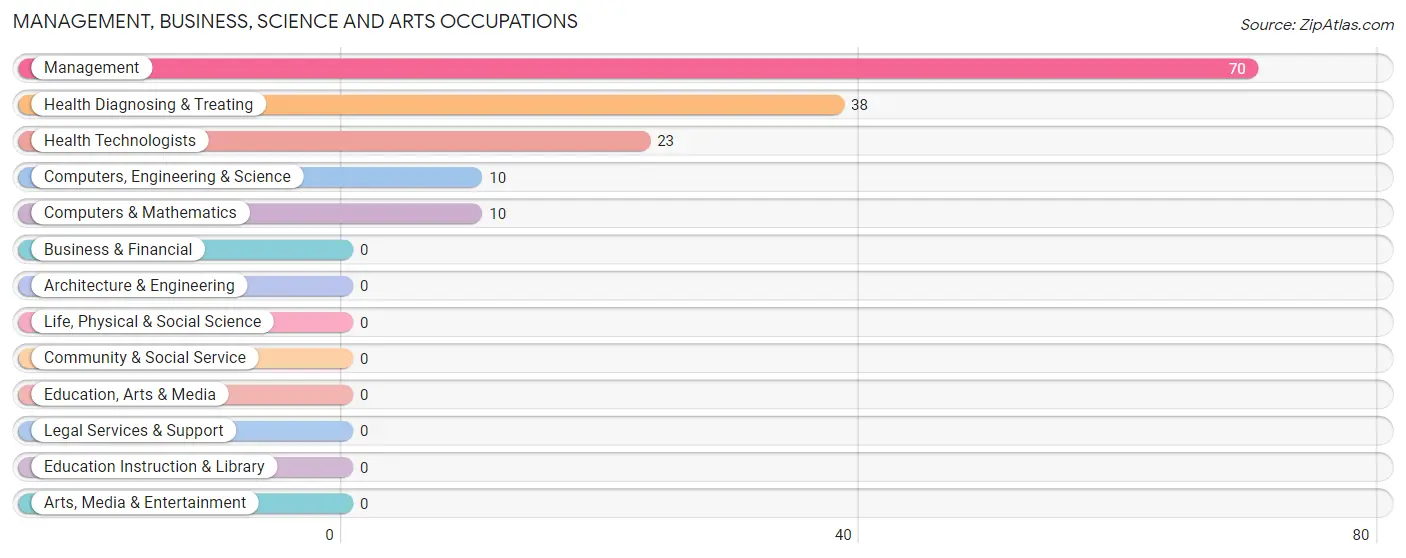
Management, Business, Science and Arts Occupations by Sex
Within the Management, Business, Science and Arts occupations in Sun Prairie, the most male-oriented occupations are Management (100.0%), Computers, Engineering & Science (100.0%), and Computers & Mathematics (100.0%), while the most female-oriented occupations are Health Diagnosing & Treating (100.0%), and Health Technologists (100.0%).
| Occupation | Male | Female |
| Management | 70 (100.0%) | 0 (0.0%) |
| Business & Financial | 0 (0.0%) | 0 (0.0%) |
| Computers, Engineering & Science | 10 (100.0%) | 0 (0.0%) |
| Computers & Mathematics | 10 (100.0%) | 0 (0.0%) |
| Architecture & Engineering | 0 (0.0%) | 0 (0.0%) |
| Life, Physical & Social Science | 0 (0.0%) | 0 (0.0%) |
| Community & Social Service | 0 (0.0%) | 0 (0.0%) |
| Education, Arts & Media | 0 (0.0%) | 0 (0.0%) |
| Legal Services & Support | 0 (0.0%) | 0 (0.0%) |
| Education Instruction & Library | 0 (0.0%) | 0 (0.0%) |
| Arts, Media & Entertainment | 0 (0.0%) | 0 (0.0%) |
| Health Diagnosing & Treating | 0 (0.0%) | 38 (100.0%) |
| Health Technologists | 0 (0.0%) | 23 (100.0%) |
| Total (Category) | 80 (67.8%) | 38 (32.2%) |
| Total (Overall) | 378 (57.7%) | 277 (42.3%) |
Services Occupations
The most common Services occupations in Sun Prairie are Healthcare Support (82 | 12.5%), Personal Care & Service (31 | 4.7%), and Food Preparation & Serving (30 | 4.6%).
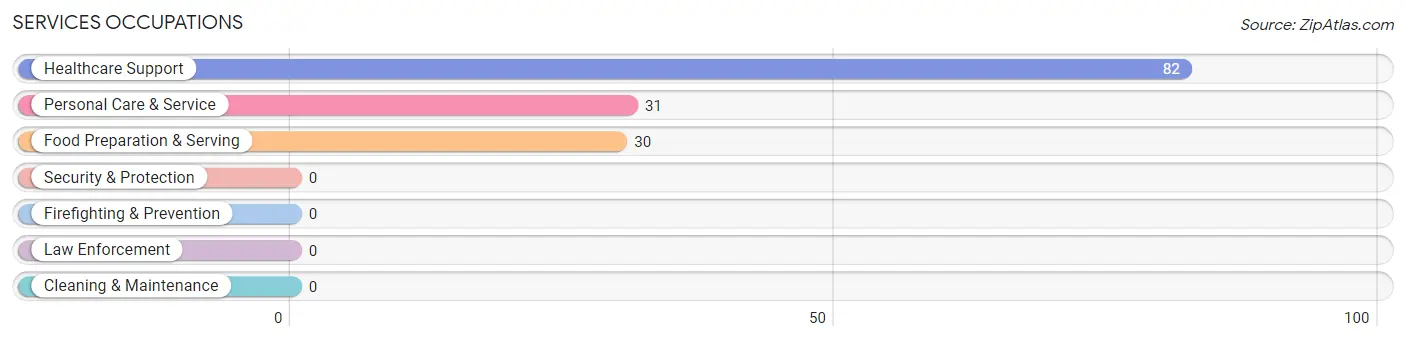
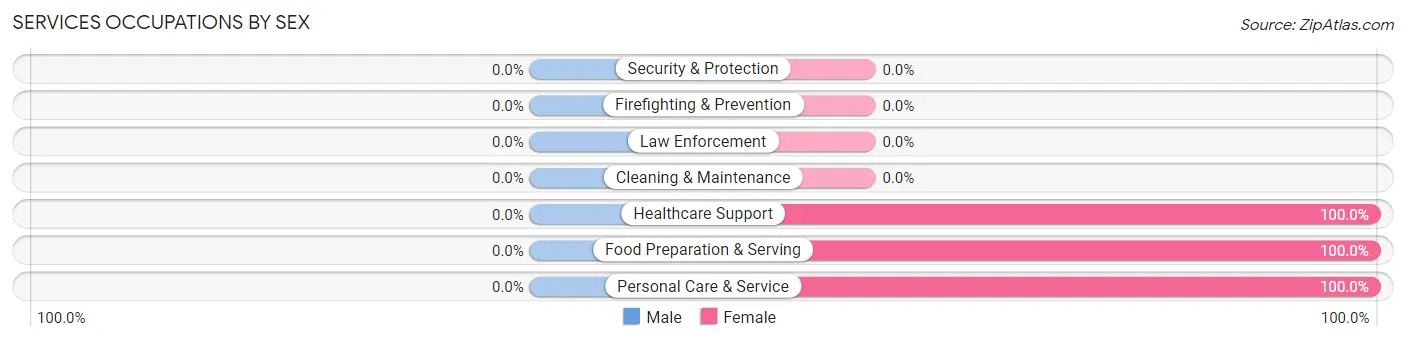
Services Occupations by Sex
| Occupation | Male | Female |
| Healthcare Support | 0 (0.0%) | 82 (100.0%) |
| Security & Protection | 0 (0.0%) | 0 (0.0%) |
| Firefighting & Prevention | 0 (0.0%) | 0 (0.0%) |
| Law Enforcement | 0 (0.0%) | 0 (0.0%) |
| Food Preparation & Serving | 0 (0.0%) | 30 (100.0%) |
| Cleaning & Maintenance | 0 (0.0%) | 0 (0.0%) |
| Personal Care & Service | 0 (0.0%) | 31 (100.0%) |
| Total (Category) | 0 (0.0%) | 143 (100.0%) |
| Total (Overall) | 378 (57.7%) | 277 (42.3%) |
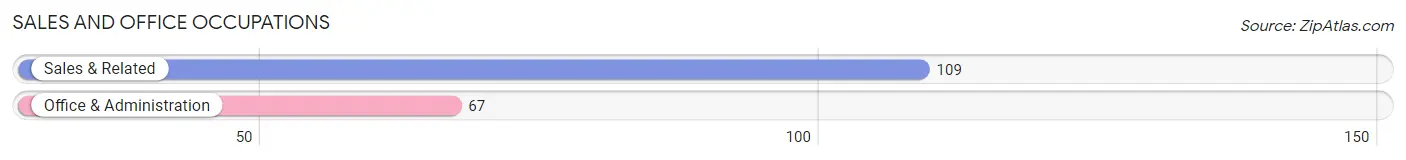
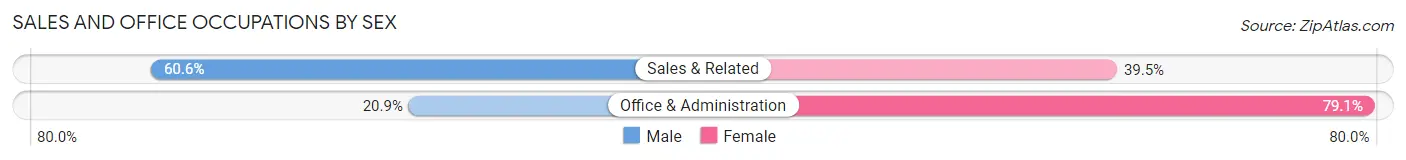
Sales and Office Occupations
The most common Sales and Office occupations in Sun Prairie are Sales & Related (109 | 16.6%), and Office & Administration (67 | 10.2%).
Sales and Office Occupations by Sex
| Occupation | Male | Female |
| Sales & Related | 66 (60.6%) | 43 (39.5%) |
| Office & Administration | 14 (20.9%) | 53 (79.1%) |
| Total (Category) | 80 (45.5%) | 96 (54.5%) |
| Total (Overall) | 378 (57.7%) | 277 (42.3%) |
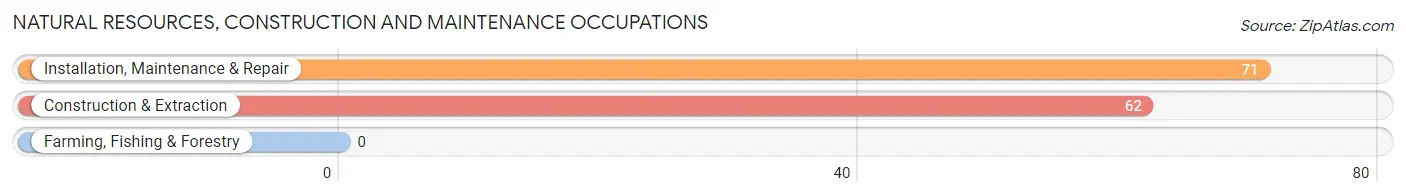
Natural Resources, Construction and Maintenance Occupations
The most common Natural Resources, Construction and Maintenance occupations in Sun Prairie are Installation, Maintenance & Repair (71 | 10.8%), and Construction & Extraction (62 | 9.5%).
Natural Resources, Construction and Maintenance Occupations by Sex
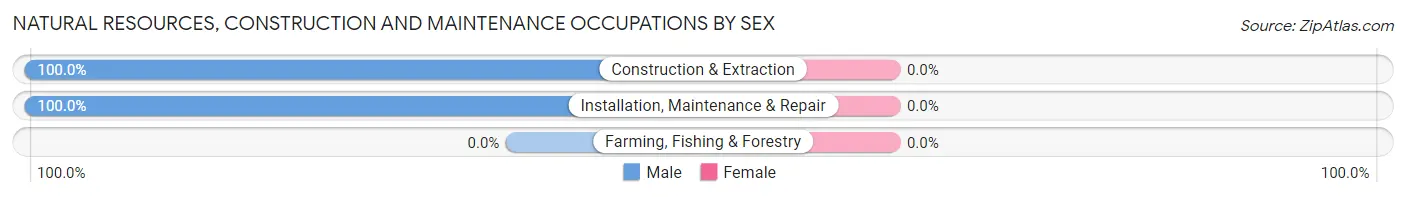
| Occupation | Male | Female |
| Farming, Fishing & Forestry | 0 (0.0%) | 0 (0.0%) |
| Construction & Extraction | 62 (100.0%) | 0 (0.0%) |
| Installation, Maintenance & Repair | 71 (100.0%) | 0 (0.0%) |
| Total (Category) | 133 (100.0%) | 0 (0.0%) |
| Total (Overall) | 378 (57.7%) | 277 (42.3%) |
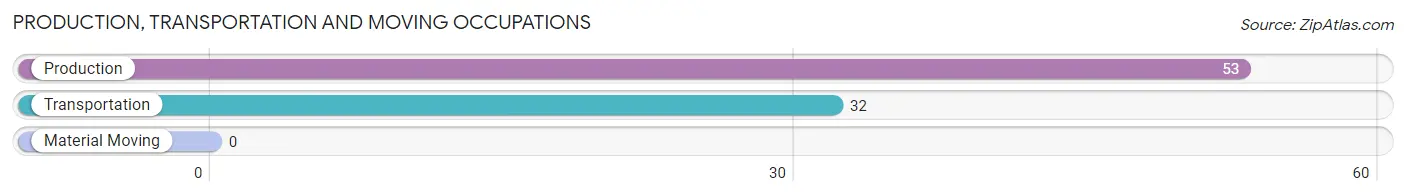
Production, Transportation and Moving Occupations
The most common Production, Transportation and Moving occupations in Sun Prairie are Production (53 | 8.1%), and Transportation (32 | 4.9%).
Production, Transportation and Moving Occupations by Sex
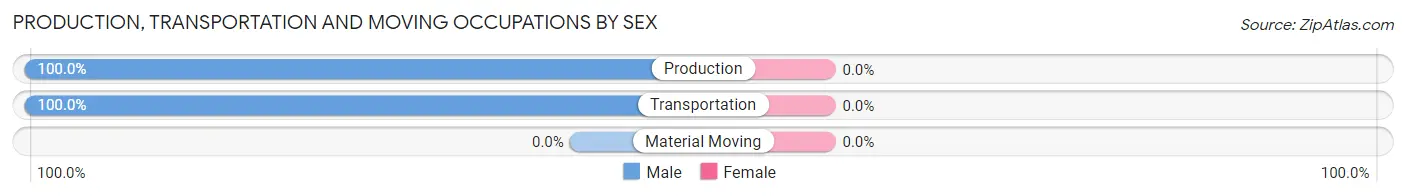
| Occupation | Male | Female |
| Production | 53 (100.0%) | 0 (0.0%) |
| Transportation | 32 (100.0%) | 0 (0.0%) |
| Material Moving | 0 (0.0%) | 0 (0.0%) |
| Total (Category) | 85 (100.0%) | 0 (0.0%) |
| Total (Overall) | 378 (57.7%) | 277 (42.3%) |
Employment Industries by Sex in Sun Prairie
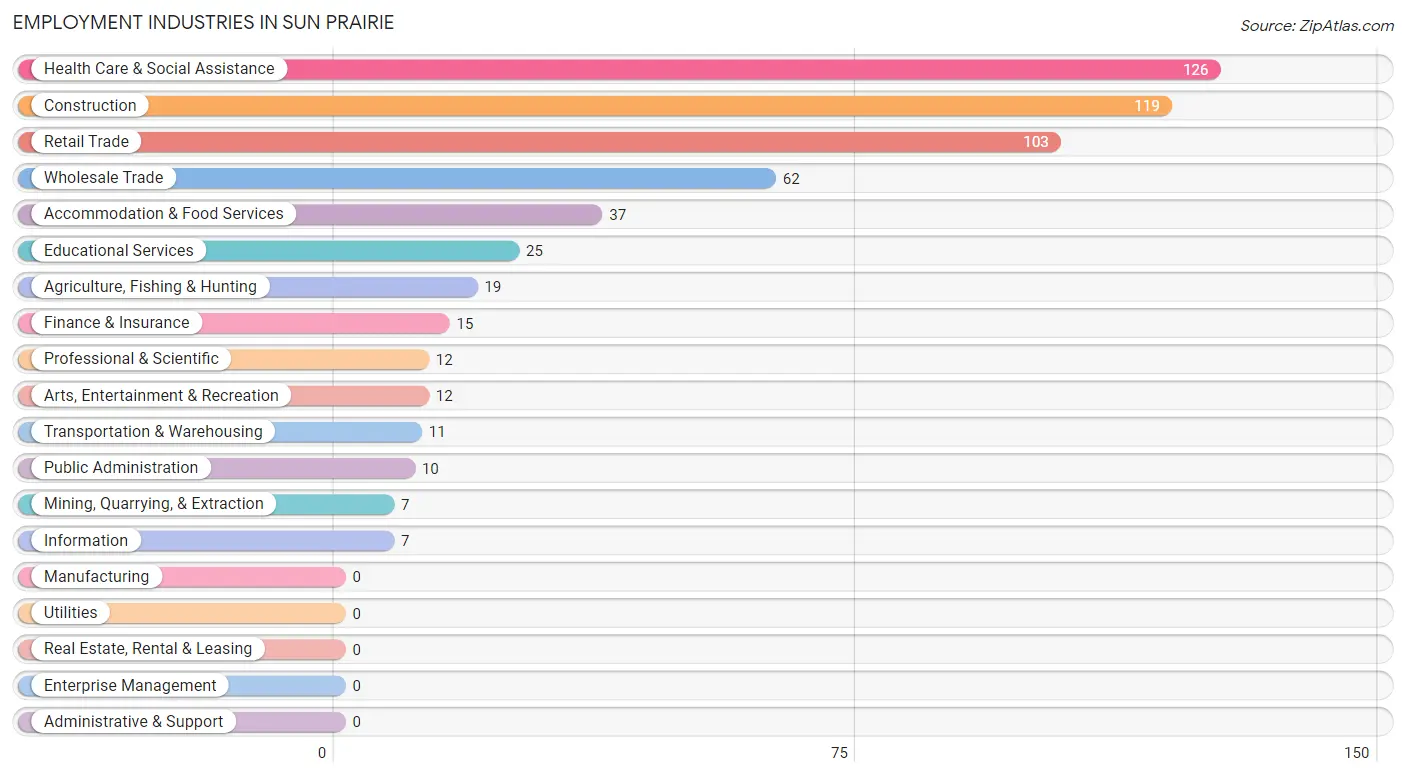
Employment Industries in Sun Prairie
The major employment industries in Sun Prairie include Health Care & Social Assistance (126 | 19.2%), Construction (119 | 18.2%), Retail Trade (103 | 15.7%), Wholesale Trade (62 | 9.5%), and Accommodation & Food Services (37 | 5.7%).
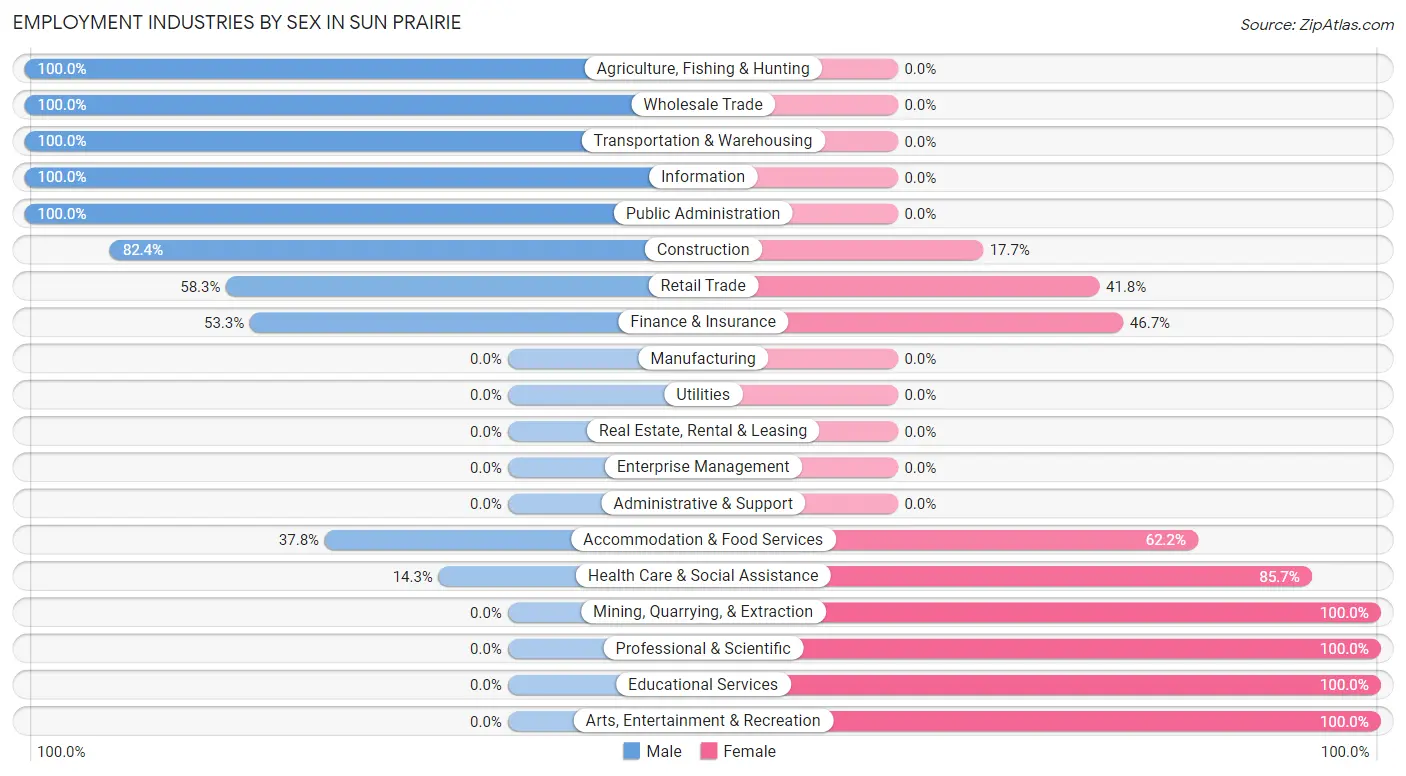
Employment Industries by Sex in Sun Prairie
The Sun Prairie industries that see more men than women are Agriculture, Fishing & Hunting (100.0%), Wholesale Trade (100.0%), and Transportation & Warehousing (100.0%), whereas the industries that tend to have a higher number of women are Mining, Quarrying, & Extraction (100.0%), Professional & Scientific (100.0%), and Educational Services (100.0%).
| Industry | Male | Female |
| Agriculture, Fishing & Hunting | 19 (100.0%) | 0 (0.0%) |
| Mining, Quarrying, & Extraction | 0 (0.0%) | 7 (100.0%) |
| Construction | 98 (82.4%) | 21 (17.6%) |
| Manufacturing | 0 (0.0%) | 0 (0.0%) |
| Wholesale Trade | 62 (100.0%) | 0 (0.0%) |
| Retail Trade | 60 (58.3%) | 43 (41.7%) |
| Transportation & Warehousing | 11 (100.0%) | 0 (0.0%) |
| Utilities | 0 (0.0%) | 0 (0.0%) |
| Information | 7 (100.0%) | 0 (0.0%) |
| Finance & Insurance | 8 (53.3%) | 7 (46.7%) |
| Real Estate, Rental & Leasing | 0 (0.0%) | 0 (0.0%) |
| Professional & Scientific | 0 (0.0%) | 12 (100.0%) |
| Enterprise Management | 0 (0.0%) | 0 (0.0%) |
| Administrative & Support | 0 (0.0%) | 0 (0.0%) |
| Educational Services | 0 (0.0%) | 25 (100.0%) |
| Health Care & Social Assistance | 18 (14.3%) | 108 (85.7%) |
| Arts, Entertainment & Recreation | 0 (0.0%) | 12 (100.0%) |
| Accommodation & Food Services | 14 (37.8%) | 23 (62.2%) |
| Public Administration | 10 (100.0%) | 0 (0.0%) |
| Total | 378 (57.7%) | 277 (42.3%) |
Education in Sun Prairie
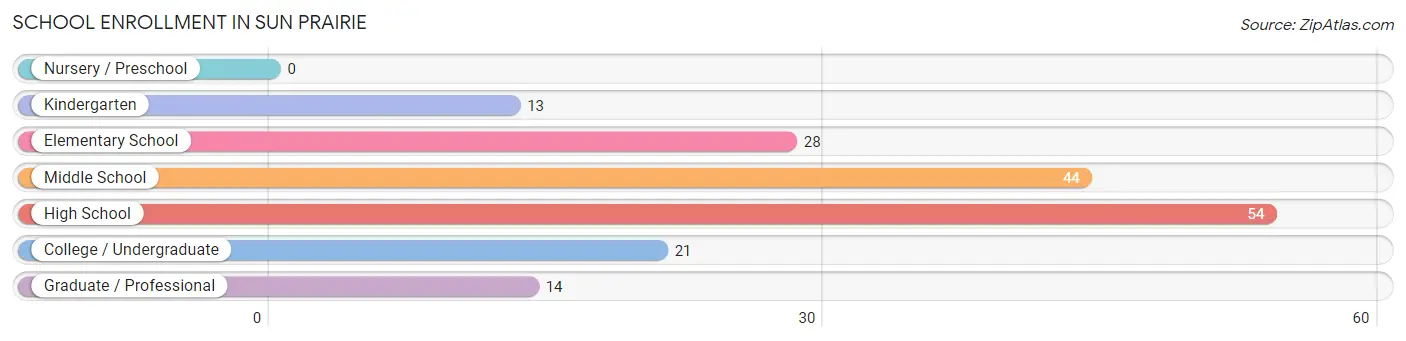
School Enrollment in Sun Prairie
The most common levels of schooling among the 174 students in Sun Prairie are high school (54 | 31.0%), middle school (44 | 25.3%), and elementary school (28 | 16.1%).
| School Level | # Students | % Students |
| Nursery / Preschool | 0 | 0.0% |
| Kindergarten | 13 | 7.5% |
| Elementary School | 28 | 16.1% |
| Middle School | 44 | 25.3% |
| High School | 54 | 31.0% |
| College / Undergraduate | 21 | 12.1% |
| Graduate / Professional | 14 | 8.1% |
| Total | 174 | 100.0% |
School Enrollment by Age by Funding Source in Sun Prairie
Out of a total of 174 students who are enrolled in schools in Sun Prairie, 66 (37.9%) attend a private institution, while the remaining 108 (62.1%) are enrolled in public schools. The age group of 25 to 34 year olds has the highest likelihood of being enrolled in private schools, with 25 (100.0% in the age bracket) enrolled. Conversely, the age group of 5 to 9 year old has the lowest likelihood of being enrolled in a private school, with 41 (100.0% in the age bracket) attending a public institution.
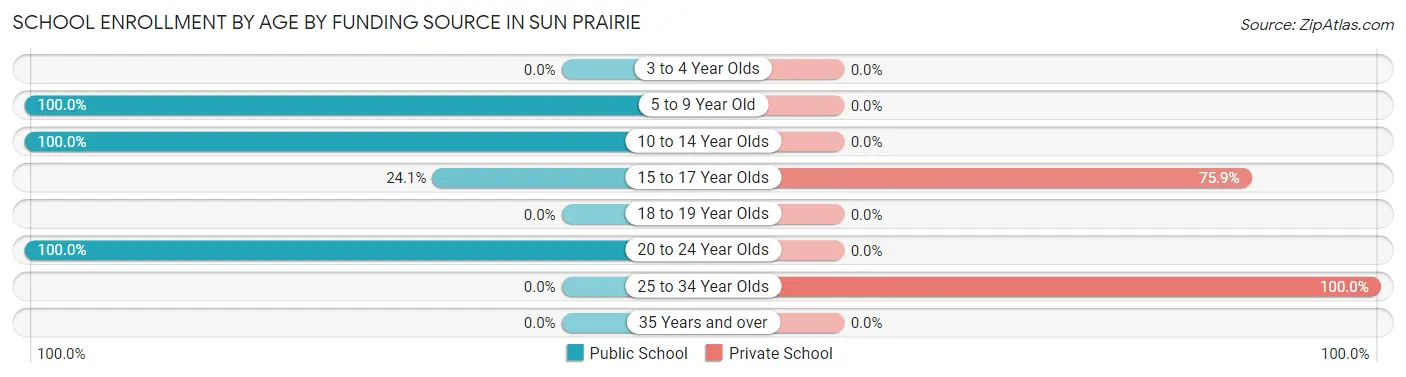
| Age Bracket | Public School | Private School |
| 3 to 4 Year Olds | 0 (0.0%) | 0 (0.0%) |
| 5 to 9 Year Old | 41 (100.0%) | 0 (0.0%) |
| 10 to 14 Year Olds | 44 (100.0%) | 0 (0.0%) |
| 15 to 17 Year Olds | 13 (24.1%) | 41 (75.9%) |
| 18 to 19 Year Olds | 0 (0.0%) | 0 (0.0%) |
| 20 to 24 Year Olds | 10 (100.0%) | 0 (0.0%) |
| 25 to 34 Year Olds | 0 (0.0%) | 25 (100.0%) |
| 35 Years and over | 0 (0.0%) | 0 (0.0%) |
| Total | 108 (62.1%) | 66 (37.9%) |
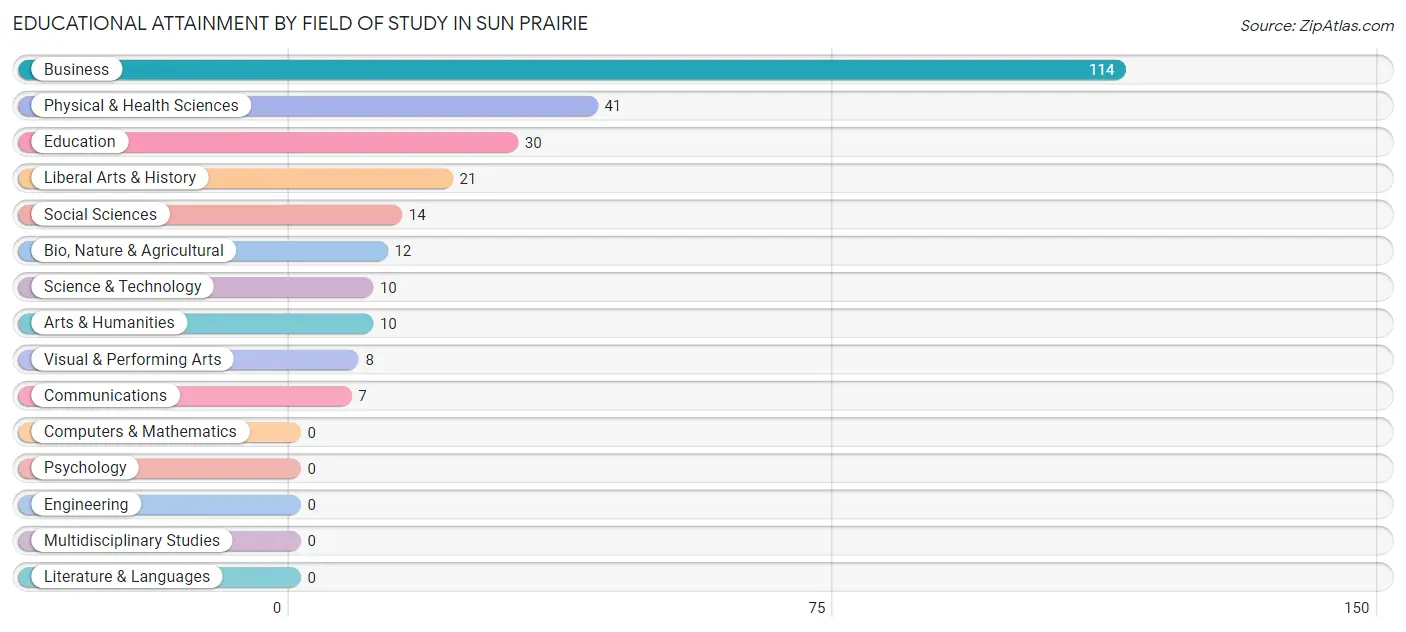
Educational Attainment by Field of Study in Sun Prairie
Business (114 | 42.7%), physical & health sciences (41 | 15.4%), education (30 | 11.2%), liberal arts & history (21 | 7.9%), and social sciences (14 | 5.2%) are the most common fields of study among 267 individuals in Sun Prairie who have obtained a bachelor's degree or higher.
| Field of Study | # Graduates | % Graduates |
| Computers & Mathematics | 0 | 0.0% |
| Bio, Nature & Agricultural | 12 | 4.5% |
| Physical & Health Sciences | 41 | 15.4% |
| Psychology | 0 | 0.0% |
| Social Sciences | 14 | 5.2% |
| Engineering | 0 | 0.0% |
| Multidisciplinary Studies | 0 | 0.0% |
| Science & Technology | 10 | 3.7% |
| Business | 114 | 42.7% |
| Education | 30 | 11.2% |
| Literature & Languages | 0 | 0.0% |
| Liberal Arts & History | 21 | 7.9% |
| Visual & Performing Arts | 8 | 3.0% |
| Communications | 7 | 2.6% |
| Arts & Humanities | 10 | 3.7% |
| Total | 267 | 100.0% |
Transportation & Commute in Sun Prairie
Vehicle Availability by Sex in Sun Prairie
The most prevalent vehicle ownership categories in Sun Prairie are males with 2 vehicles (154, accounting for 39.7%) and females with 2 vehicles (43, making up 53.7%).
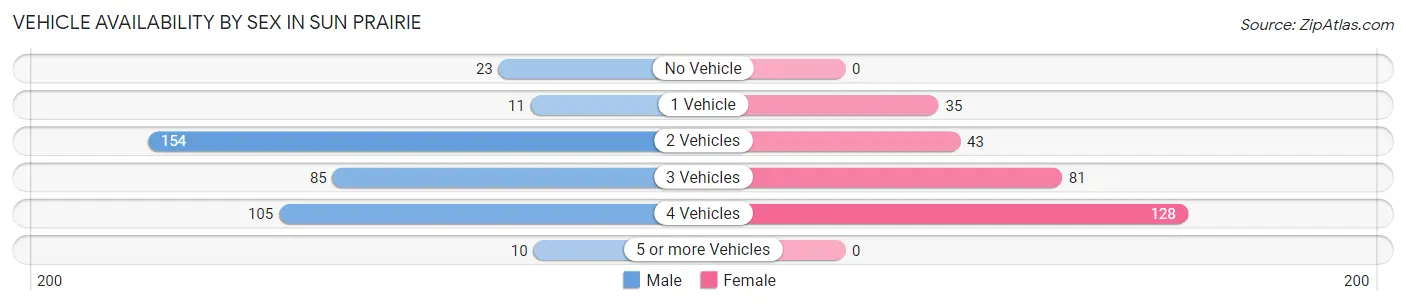
| Vehicles Available | Male | Female |
| No Vehicle | 23 (5.9%) | 0 (0.0%) |
| 1 Vehicle | 11 (2.8%) | 35 (12.2%) |
| 2 Vehicles | 154 (39.7%) | 43 (15.0%) |
| 3 Vehicles | 85 (21.9%) | 81 (28.2%) |
| 4 Vehicles | 105 (27.1%) | 128 (44.6%) |
| 5 or more Vehicles | 10 (2.6%) | 0 (0.0%) |
| Total | 388 (100.0%) | 287 (100.0%) |
Commute Time in Sun Prairie
The most frequently occuring commute durations in Sun Prairie are 25 to 29 minutes (153 commuters, 25.6%), 15 to 19 minutes (118 commuters, 19.8%), and 20 to 24 minutes (107 commuters, 17.9%).
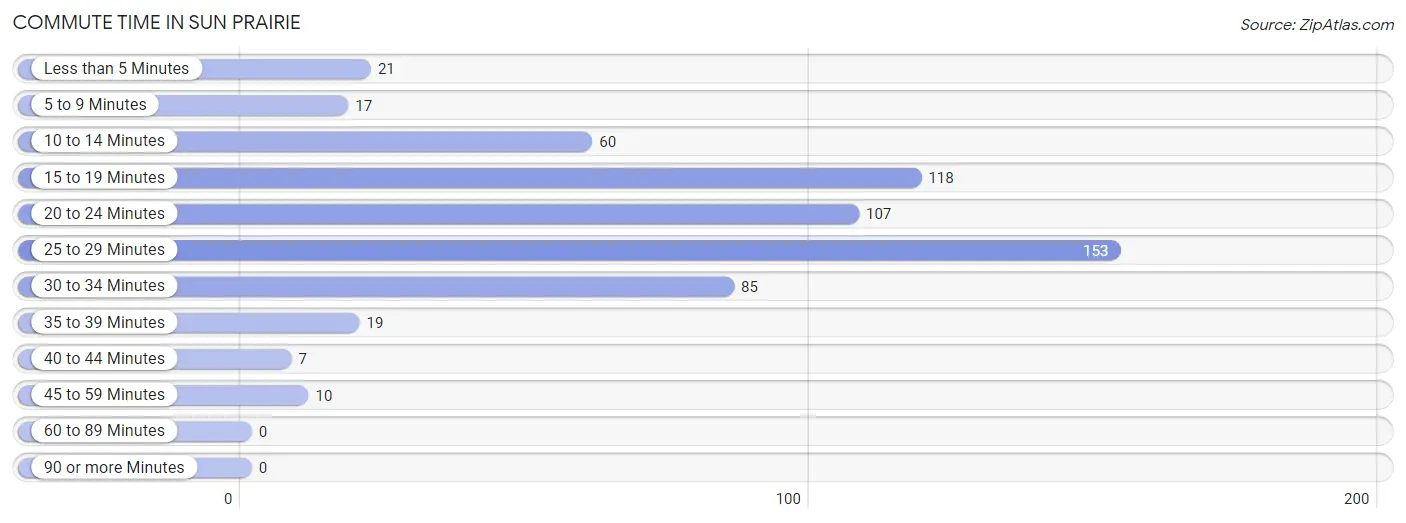
| Commute Time | # Commuters | % Commuters |
| Less than 5 Minutes | 21 | 3.5% |
| 5 to 9 Minutes | 17 | 2.9% |
| 10 to 14 Minutes | 60 | 10.1% |
| 15 to 19 Minutes | 118 | 19.8% |
| 20 to 24 Minutes | 107 | 17.9% |
| 25 to 29 Minutes | 153 | 25.6% |
| 30 to 34 Minutes | 85 | 14.2% |
| 35 to 39 Minutes | 19 | 3.2% |
| 40 to 44 Minutes | 7 | 1.2% |
| 45 to 59 Minutes | 10 | 1.7% |
| 60 to 89 Minutes | 0 | 0.0% |
| 90 or more Minutes | 0 | 0.0% |
Commute Time by Sex in Sun Prairie
The most common commute times in Sun Prairie are 15 to 19 minutes (101 commuters, 32.6%) for males and 20 to 24 minutes (89 commuters, 31.0%) for females.
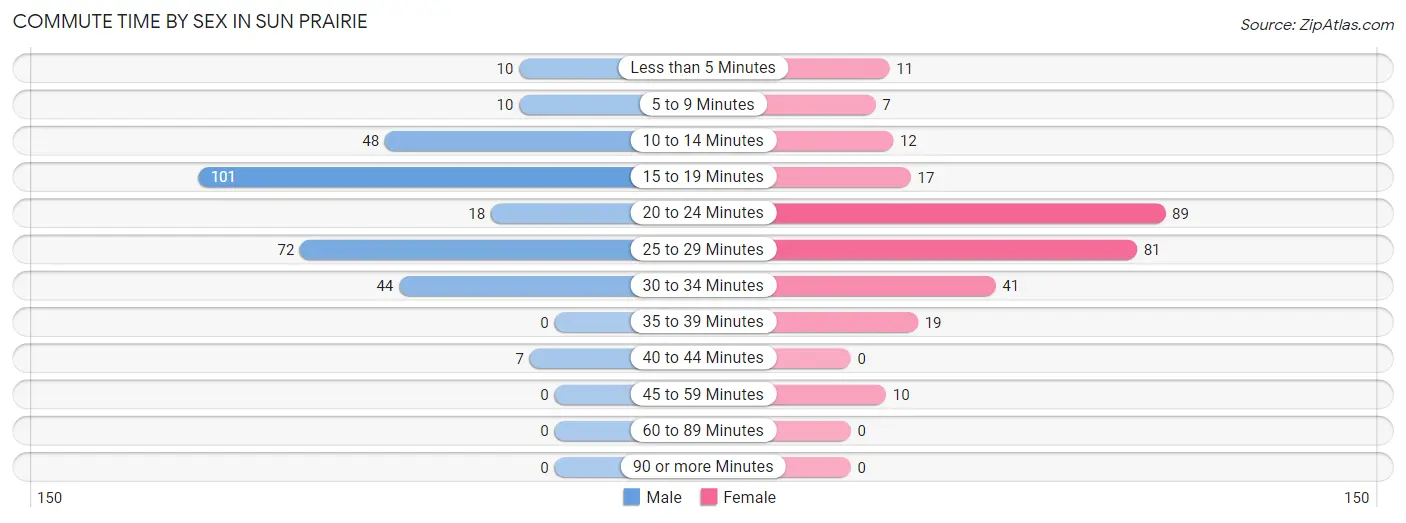
| Commute Time | Male | Female |
| Less than 5 Minutes | 10 (3.2%) | 11 (3.8%) |
| 5 to 9 Minutes | 10 (3.2%) | 7 (2.4%) |
| 10 to 14 Minutes | 48 (15.5%) | 12 (4.2%) |
| 15 to 19 Minutes | 101 (32.6%) | 17 (5.9%) |
| 20 to 24 Minutes | 18 (5.8%) | 89 (31.0%) |
| 25 to 29 Minutes | 72 (23.2%) | 81 (28.2%) |
| 30 to 34 Minutes | 44 (14.2%) | 41 (14.3%) |
| 35 to 39 Minutes | 0 (0.0%) | 19 (6.6%) |
| 40 to 44 Minutes | 7 (2.3%) | 0 (0.0%) |
| 45 to 59 Minutes | 0 (0.0%) | 10 (3.5%) |
| 60 to 89 Minutes | 0 (0.0%) | 0 (0.0%) |
| 90 or more Minutes | 0 (0.0%) | 0 (0.0%) |
Time of Departure to Work by Sex in Sun Prairie
The most frequent times of departure to work in Sun Prairie are 9:00 AM to 9:59 AM (74, 23.9%) for males and 4:00 PM to 11:59 PM (109, 38.0%) for females.
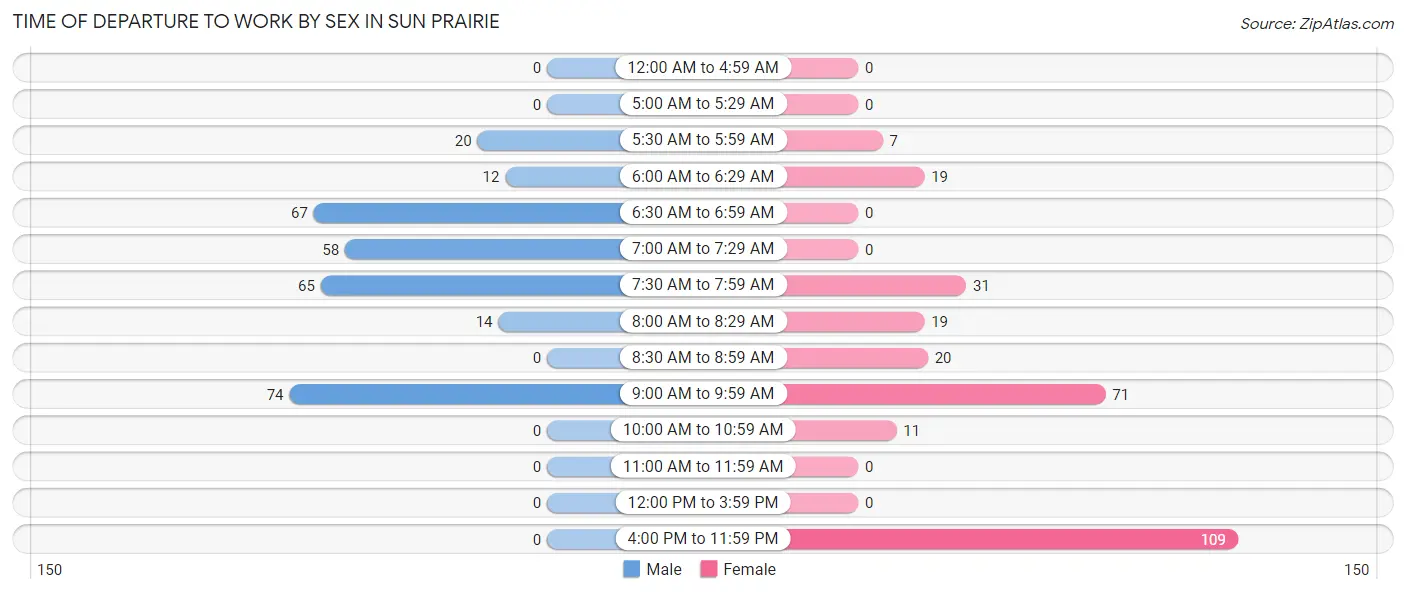
| Time of Departure | Male | Female |
| 12:00 AM to 4:59 AM | 0 (0.0%) | 0 (0.0%) |
| 5:00 AM to 5:29 AM | 0 (0.0%) | 0 (0.0%) |
| 5:30 AM to 5:59 AM | 20 (6.5%) | 7 (2.4%) |
| 6:00 AM to 6:29 AM | 12 (3.9%) | 19 (6.6%) |
| 6:30 AM to 6:59 AM | 67 (21.6%) | 0 (0.0%) |
| 7:00 AM to 7:29 AM | 58 (18.7%) | 0 (0.0%) |
| 7:30 AM to 7:59 AM | 65 (21.0%) | 31 (10.8%) |
| 8:00 AM to 8:29 AM | 14 (4.5%) | 19 (6.6%) |
| 8:30 AM to 8:59 AM | 0 (0.0%) | 20 (7.0%) |
| 9:00 AM to 9:59 AM | 74 (23.9%) | 71 (24.7%) |
| 10:00 AM to 10:59 AM | 0 (0.0%) | 11 (3.8%) |
| 11:00 AM to 11:59 AM | 0 (0.0%) | 0 (0.0%) |
| 12:00 PM to 3:59 PM | 0 (0.0%) | 0 (0.0%) |
| 4:00 PM to 11:59 PM | 0 (0.0%) | 109 (38.0%) |
| Total | 310 (100.0%) | 287 (100.0%) |
Housing Occupancy in Sun Prairie
Occupancy by Ownership in Sun Prairie
Of the total 590 dwellings in Sun Prairie, owner-occupied units account for 581 (98.5%), while renter-occupied units make up 9 (1.5%).
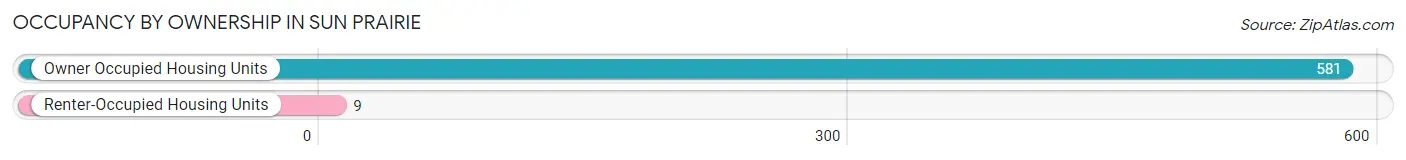
| Occupancy | # Housing Units | % Housing Units |
| Owner Occupied Housing Units | 581 | 98.5% |
| Renter-Occupied Housing Units | 9 | 1.5% |
| Total Occupied Housing Units | 590 | 100.0% |
Occupancy by Household Size in Sun Prairie
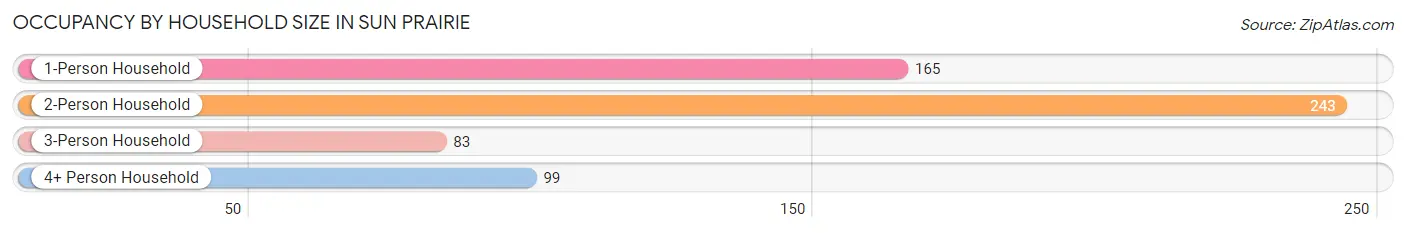
| Household Size | # Housing Units | % Housing Units |
| 1-Person Household | 165 | 28.0% |
| 2-Person Household | 243 | 41.2% |
| 3-Person Household | 83 | 14.1% |
| 4+ Person Household | 99 | 16.8% |
| Total Housing Units | 590 | 100.0% |
Occupancy by Ownership by Household Size in Sun Prairie
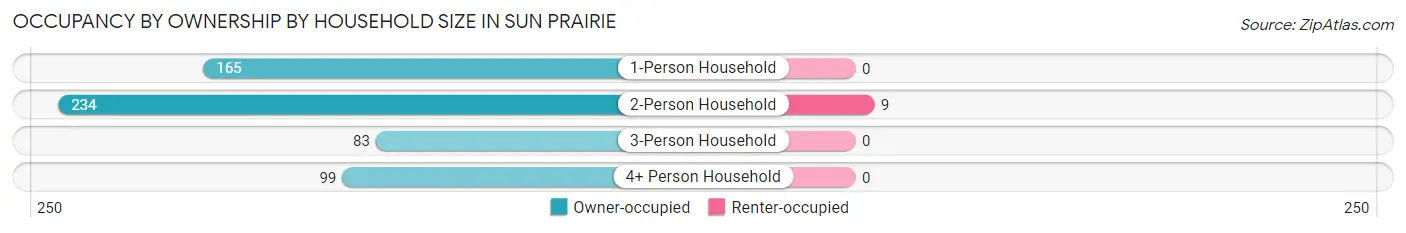
| Household Size | Owner-occupied | Renter-occupied |
| 1-Person Household | 165 (100.0%) | 0 (0.0%) |
| 2-Person Household | 234 (96.3%) | 9 (3.7%) |
| 3-Person Household | 83 (100.0%) | 0 (0.0%) |
| 4+ Person Household | 99 (100.0%) | 0 (0.0%) |
| Total Housing Units | 581 (98.5%) | 9 (1.5%) |
Occupancy by Educational Attainment in Sun Prairie
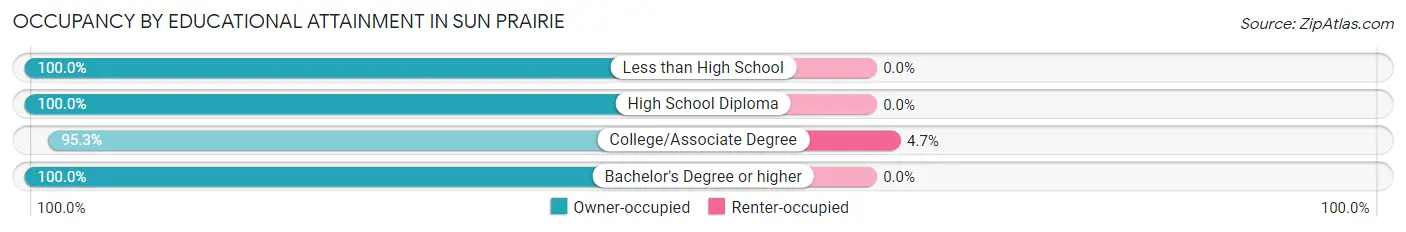
| Household Size | Owner-occupied | Renter-occupied |
| Less than High School | 69 (100.0%) | 0 (0.0%) |
| High School Diploma | 168 (100.0%) | 0 (0.0%) |
| College/Associate Degree | 181 (95.3%) | 9 (4.7%) |
| Bachelor's Degree or higher | 163 (100.0%) | 0 (0.0%) |
Occupancy by Age of Householder in Sun Prairie
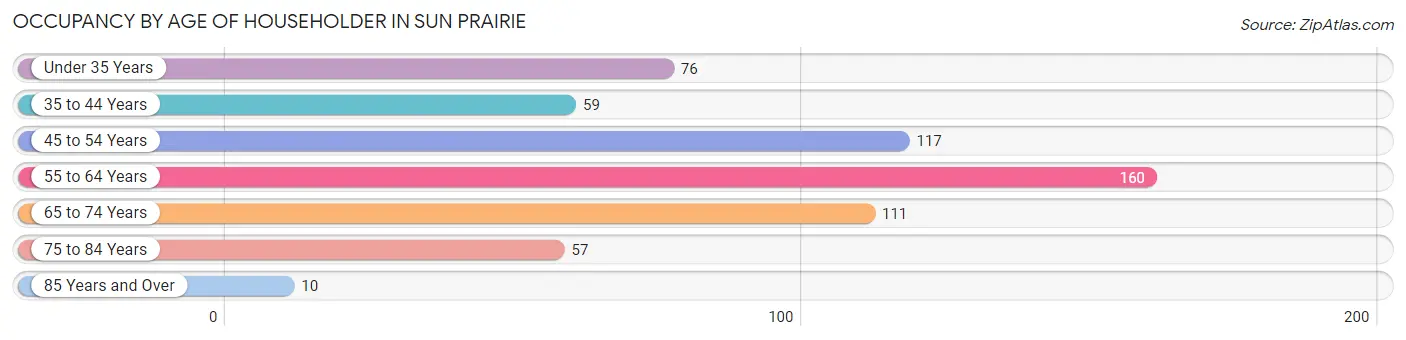
| Age Bracket | # Households | % Households |
| Under 35 Years | 76 | 12.9% |
| 35 to 44 Years | 59 | 10.0% |
| 45 to 54 Years | 117 | 19.8% |
| 55 to 64 Years | 160 | 27.1% |
| 65 to 74 Years | 111 | 18.8% |
| 75 to 84 Years | 57 | 9.7% |
| 85 Years and Over | 10 | 1.7% |
| Total | 590 | 100.0% |
Housing Finances in Sun Prairie
Median Income by Occupancy in Sun Prairie
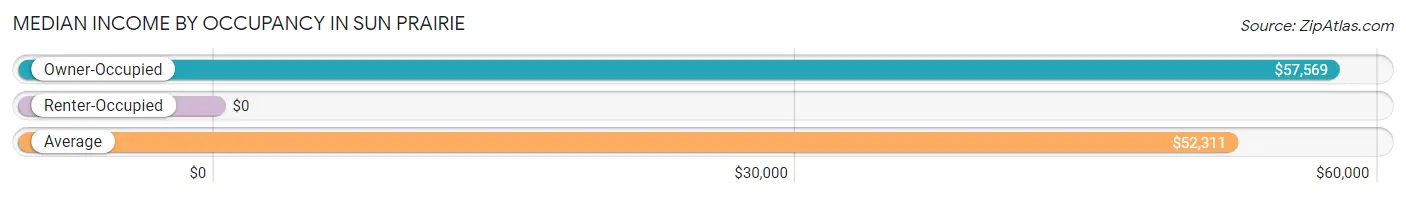
| Occupancy Type | # Households | Median Income |
| Owner-Occupied | 581 (98.5%) | $57,569 |
| Renter-Occupied | 9 (1.5%) | $0 |
| Average | 590 (100.0%) | $52,311 |
Occupancy by Householder Income Bracket in Sun Prairie
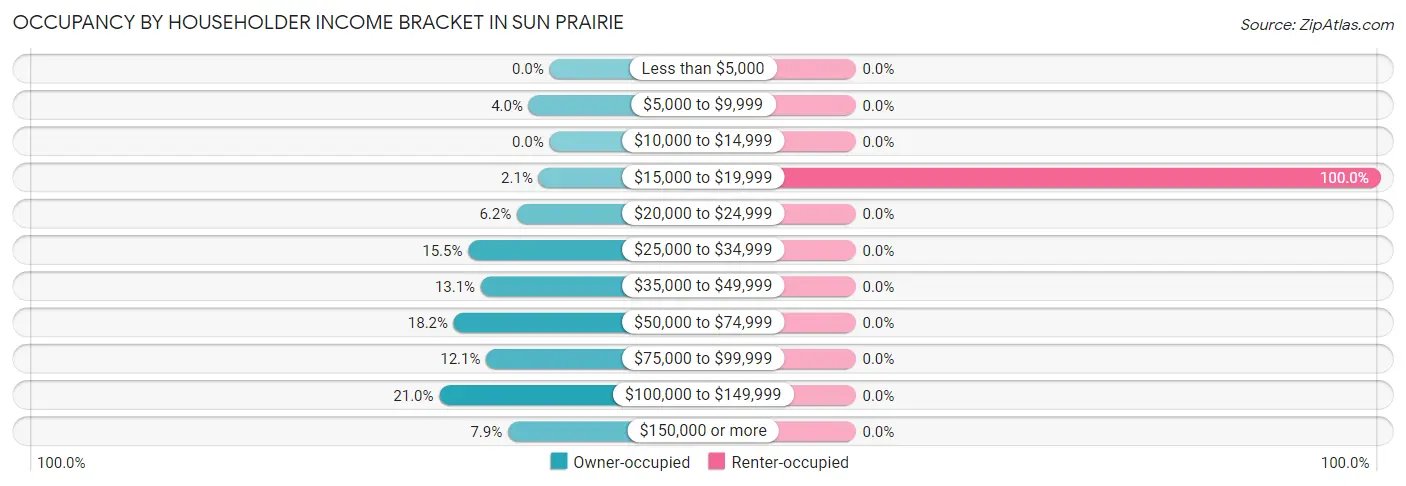
| Income Bracket | Owner-occupied | Renter-occupied |
| Less than $5,000 | 0 (0.0%) | 0 (0.0%) |
| $5,000 to $9,999 | 23 (4.0%) | 0 (0.0%) |
| $10,000 to $14,999 | 0 (0.0%) | 0 (0.0%) |
| $15,000 to $19,999 | 12 (2.1%) | 9 (100.0%) |
| $20,000 to $24,999 | 36 (6.2%) | 0 (0.0%) |
| $25,000 to $34,999 | 90 (15.5%) | 0 (0.0%) |
| $35,000 to $49,999 | 76 (13.1%) | 0 (0.0%) |
| $50,000 to $74,999 | 106 (18.2%) | 0 (0.0%) |
| $75,000 to $99,999 | 70 (12.0%) | 0 (0.0%) |
| $100,000 to $149,999 | 122 (21.0%) | 0 (0.0%) |
| $150,000 or more | 46 (7.9%) | 0 (0.0%) |
| Total | 581 (100.0%) | 9 (100.0%) |
Monthly Housing Cost Tiers in Sun Prairie
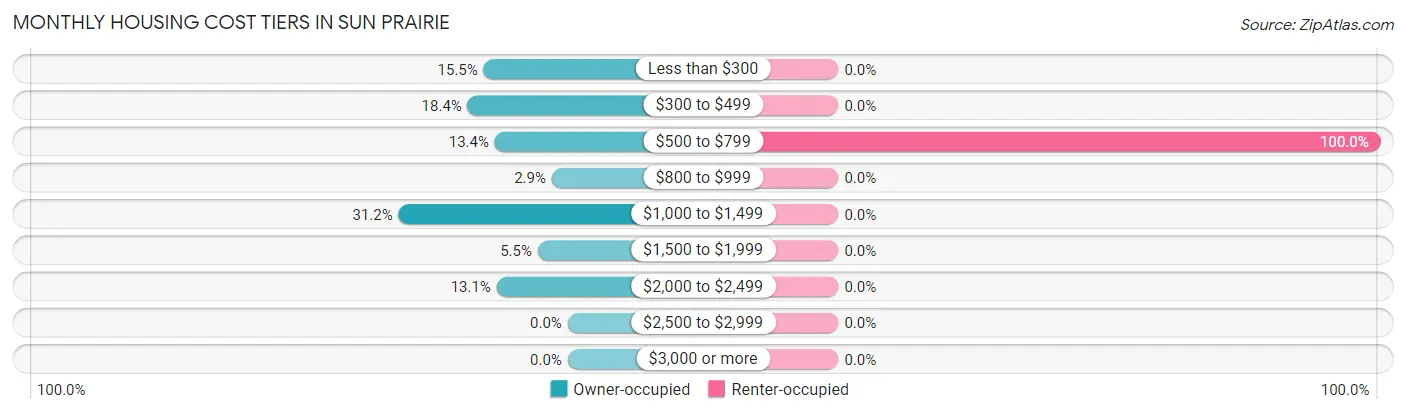
| Monthly Cost | Owner-occupied | Renter-occupied |
| Less than $300 | 90 (15.5%) | 0 (0.0%) |
| $300 to $499 | 107 (18.4%) | 0 (0.0%) |
| $500 to $799 | 78 (13.4%) | 9 (100.0%) |
| $800 to $999 | 17 (2.9%) | 0 (0.0%) |
| $1,000 to $1,499 | 181 (31.1%) | 0 (0.0%) |
| $1,500 to $1,999 | 32 (5.5%) | 0 (0.0%) |
| $2,000 to $2,499 | 76 (13.1%) | 0 (0.0%) |
| $2,500 to $2,999 | 0 (0.0%) | 0 (0.0%) |
| $3,000 or more | 0 (0.0%) | 0 (0.0%) |
| Total | 581 (100.0%) | 9 (100.0%) |
Physical Housing Characteristics in Sun Prairie
Housing Structures in Sun Prairie
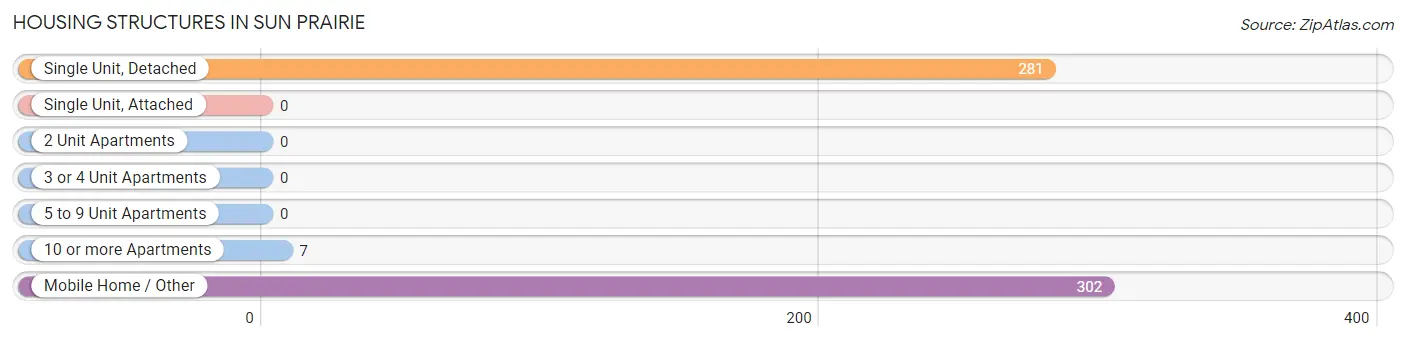
| Structure Type | # Housing Units | % Housing Units |
| Single Unit, Detached | 281 | 47.6% |
| Single Unit, Attached | 0 | 0.0% |
| 2 Unit Apartments | 0 | 0.0% |
| 3 or 4 Unit Apartments | 0 | 0.0% |
| 5 to 9 Unit Apartments | 0 | 0.0% |
| 10 or more Apartments | 7 | 1.2% |
| Mobile Home / Other | 302 | 51.2% |
| Total | 590 | 100.0% |
Housing Structures by Occupancy in Sun Prairie
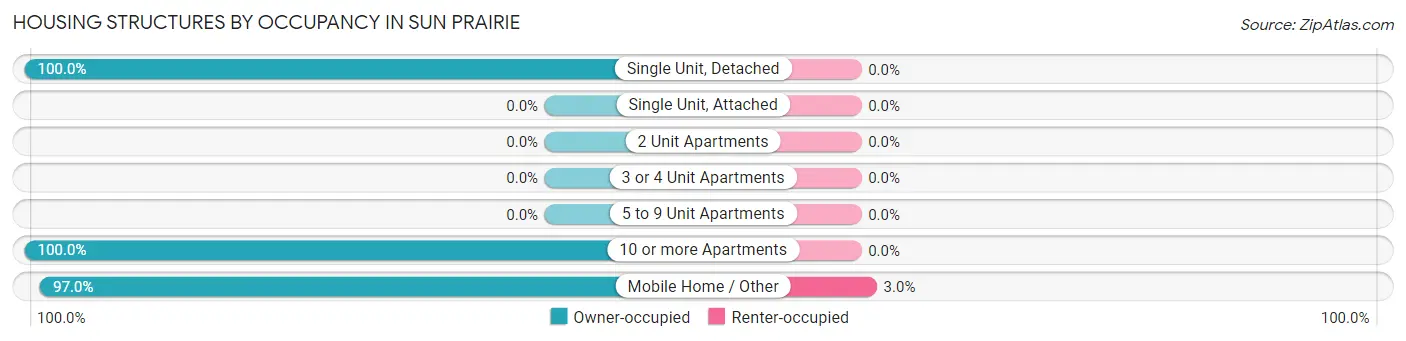
| Structure Type | Owner-occupied | Renter-occupied |
| Single Unit, Detached | 281 (100.0%) | 0 (0.0%) |
| Single Unit, Attached | 0 (0.0%) | 0 (0.0%) |
| 2 Unit Apartments | 0 (0.0%) | 0 (0.0%) |
| 3 or 4 Unit Apartments | 0 (0.0%) | 0 (0.0%) |
| 5 to 9 Unit Apartments | 0 (0.0%) | 0 (0.0%) |
| 10 or more Apartments | 7 (100.0%) | 0 (0.0%) |
| Mobile Home / Other | 293 (97.0%) | 9 (3.0%) |
| Total | 581 (98.5%) | 9 (1.5%) |
Housing Structures by Number of Rooms in Sun Prairie
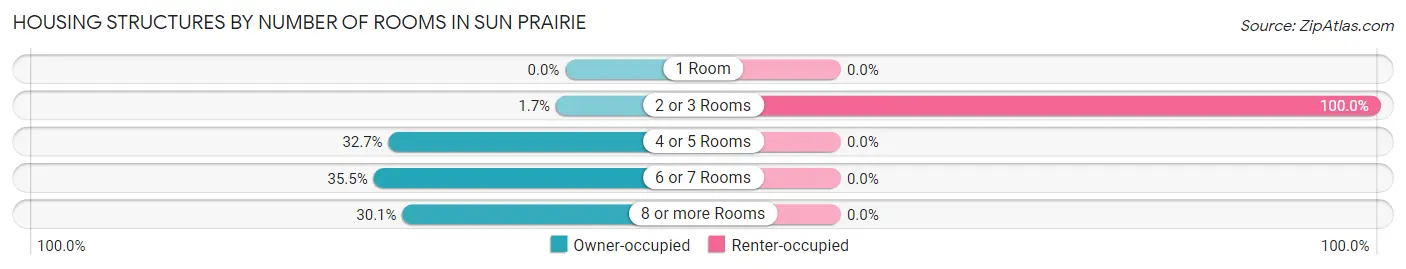
| Number of Rooms | Owner-occupied | Renter-occupied |
| 1 Room | 0 (0.0%) | 0 (0.0%) |
| 2 or 3 Rooms | 10 (1.7%) | 9 (100.0%) |
| 4 or 5 Rooms | 190 (32.7%) | 0 (0.0%) |
| 6 or 7 Rooms | 206 (35.5%) | 0 (0.0%) |
| 8 or more Rooms | 175 (30.1%) | 0 (0.0%) |
| Total | 581 (100.0%) | 9 (100.0%) |
Housing Structure by Heating Type in Sun Prairie
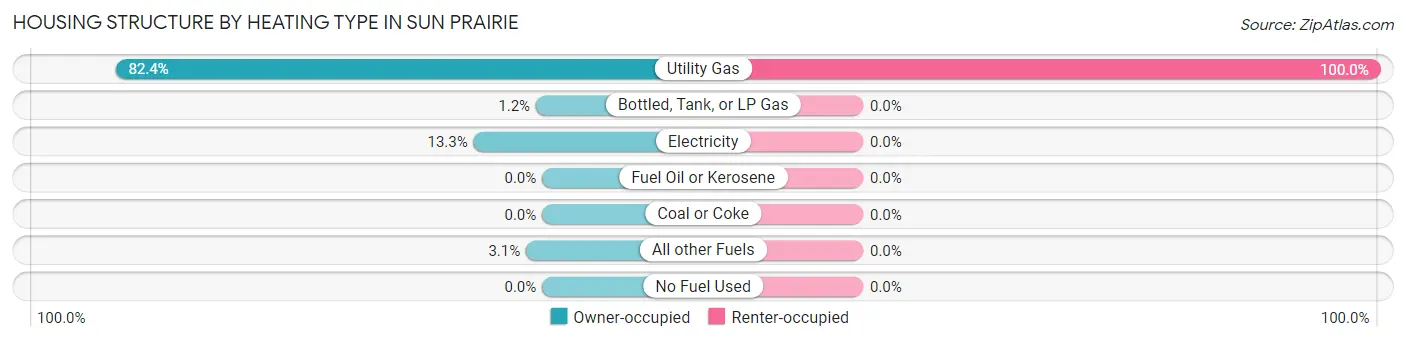
| Heating Type | Owner-occupied | Renter-occupied |
| Utility Gas | 479 (82.4%) | 9 (100.0%) |
| Bottled, Tank, or LP Gas | 7 (1.2%) | 0 (0.0%) |
| Electricity | 77 (13.3%) | 0 (0.0%) |
| Fuel Oil or Kerosene | 0 (0.0%) | 0 (0.0%) |
| Coal or Coke | 0 (0.0%) | 0 (0.0%) |
| All other Fuels | 18 (3.1%) | 0 (0.0%) |
| No Fuel Used | 0 (0.0%) | 0 (0.0%) |
| Total | 581 (100.0%) | 9 (100.0%) |
Household Vehicle Usage in Sun Prairie
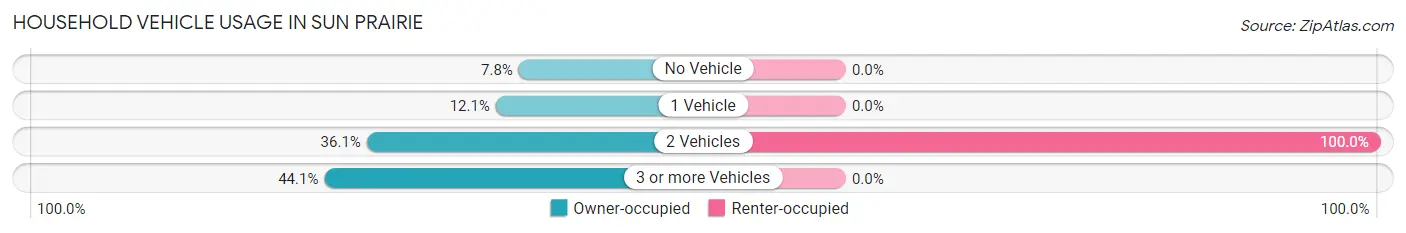
| Vehicles per Household | Owner-occupied | Renter-occupied |
| No Vehicle | 45 (7.7%) | 0 (0.0%) |
| 1 Vehicle | 70 (12.0%) | 0 (0.0%) |
| 2 Vehicles | 210 (36.1%) | 9 (100.0%) |
| 3 or more Vehicles | 256 (44.1%) | 0 (0.0%) |
| Total | 581 (100.0%) | 9 (100.0%) |
Real Estate & Mortgages in Sun Prairie
Real Estate and Mortgage Overview in Sun Prairie
| Characteristic | Without Mortgage | With Mortgage |
| Housing Units | 263 | 318 |
| Median Property Value | $69,600 | $175,000 |
| Median Household Income | $42,566 | $39 |
| Monthly Housing Costs | $383 | $0 |
| Real Estate Taxes | $553 | $0 |
Property Value by Mortgage Status in Sun Prairie
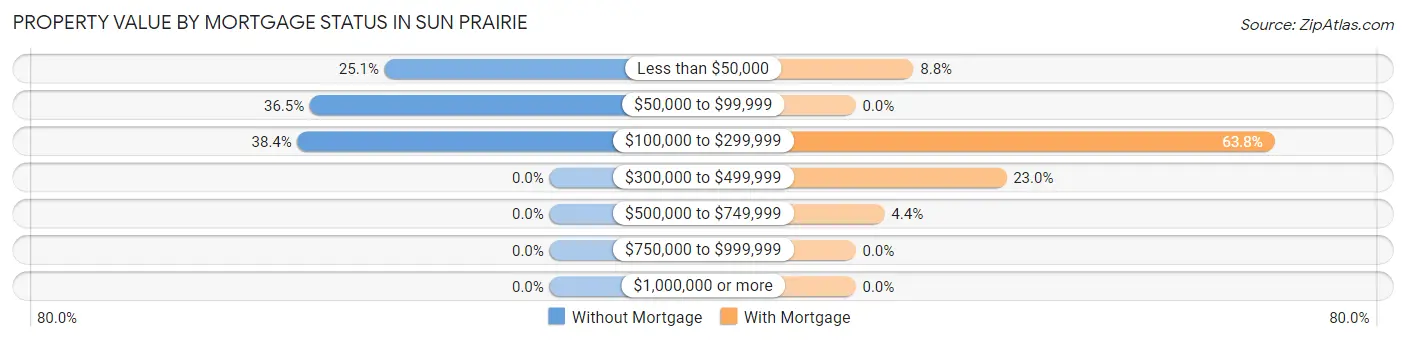
| Property Value | Without Mortgage | With Mortgage |
| Less than $50,000 | 66 (25.1%) | 28 (8.8%) |
| $50,000 to $99,999 | 96 (36.5%) | 0 (0.0%) |
| $100,000 to $299,999 | 101 (38.4%) | 203 (63.8%) |
| $300,000 to $499,999 | 0 (0.0%) | 73 (23.0%) |
| $500,000 to $749,999 | 0 (0.0%) | 14 (4.4%) |
| $750,000 to $999,999 | 0 (0.0%) | 0 (0.0%) |
| $1,000,000 or more | 0 (0.0%) | 0 (0.0%) |
| Total | 263 (100.0%) | 318 (100.0%) |
Household Income by Mortgage Status in Sun Prairie
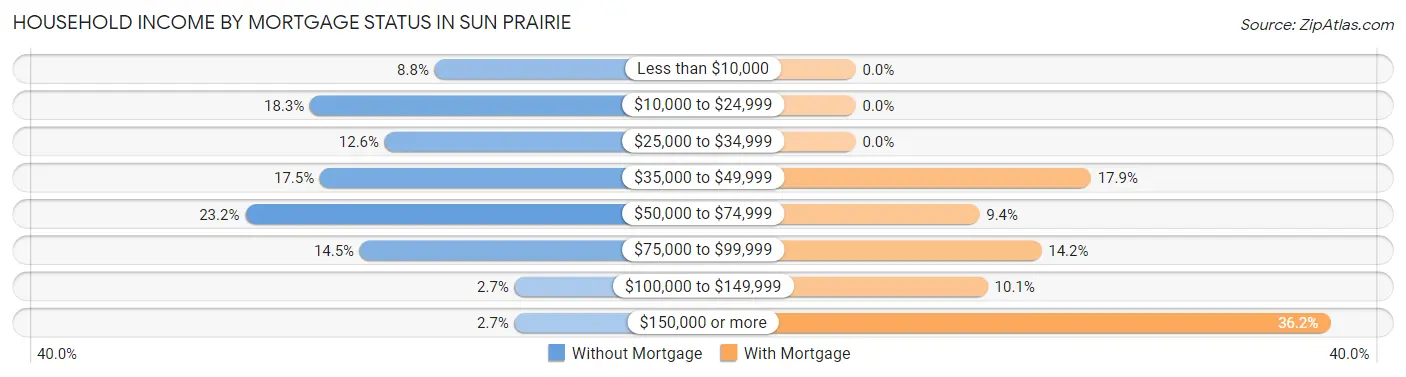
| Household Income | Without Mortgage | With Mortgage |
| Less than $10,000 | 23 (8.7%) | 0 (0.0%) |
| $10,000 to $24,999 | 48 (18.2%) | 0 (0.0%) |
| $25,000 to $34,999 | 33 (12.6%) | 0 (0.0%) |
| $35,000 to $49,999 | 46 (17.5%) | 57 (17.9%) |
| $50,000 to $74,999 | 61 (23.2%) | 30 (9.4%) |
| $75,000 to $99,999 | 38 (14.4%) | 45 (14.1%) |
| $100,000 to $149,999 | 7 (2.7%) | 32 (10.1%) |
| $150,000 or more | 7 (2.7%) | 115 (36.2%) |
| Total | 263 (100.0%) | 318 (100.0%) |
Property Value to Household Income Ratio in Sun Prairie
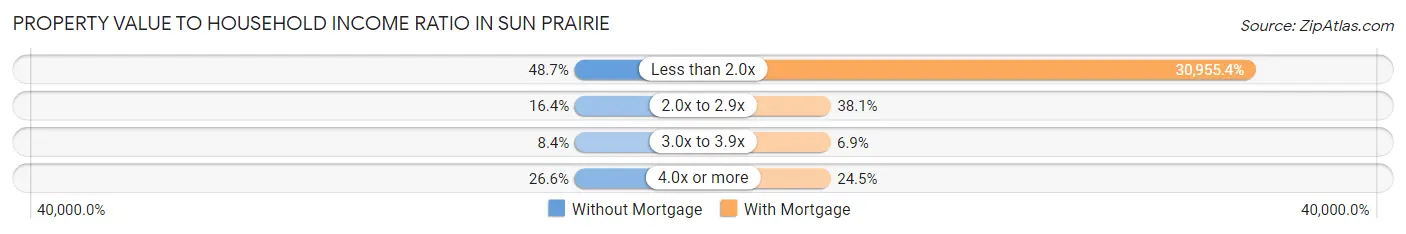
| Value-to-Income Ratio | Without Mortgage | With Mortgage |
| Less than 2.0x | 128 (48.7%) | 98,438 (30,955.3%) |
| 2.0x to 2.9x | 43 (16.4%) | 121 (38.1%) |
| 3.0x to 3.9x | 22 (8.4%) | 22 (6.9%) |
| 4.0x or more | 70 (26.6%) | 78 (24.5%) |
| Total | 263 (100.0%) | 318 (100.0%) |
Real Estate Taxes by Mortgage Status in Sun Prairie
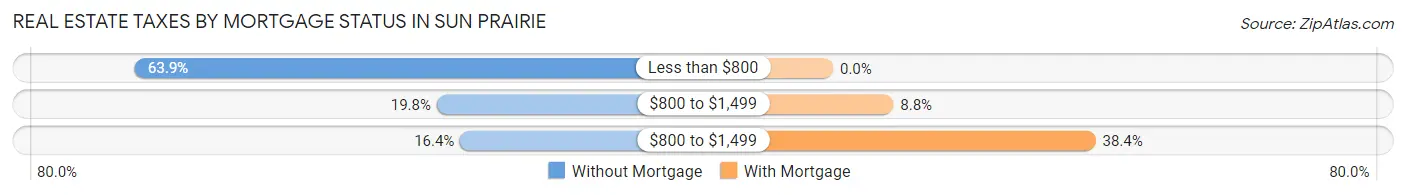
| Property Taxes | Without Mortgage | With Mortgage |
| Less than $800 | 168 (63.9%) | 0 (0.0%) |
| $800 to $1,499 | 52 (19.8%) | 28 (8.8%) |
| $800 to $1,499 | 43 (16.4%) | 122 (38.4%) |
| Total | 263 (100.0%) | 318 (100.0%) |
Health & Disability in Sun Prairie
Health Insurance Coverage by Age in Sun Prairie
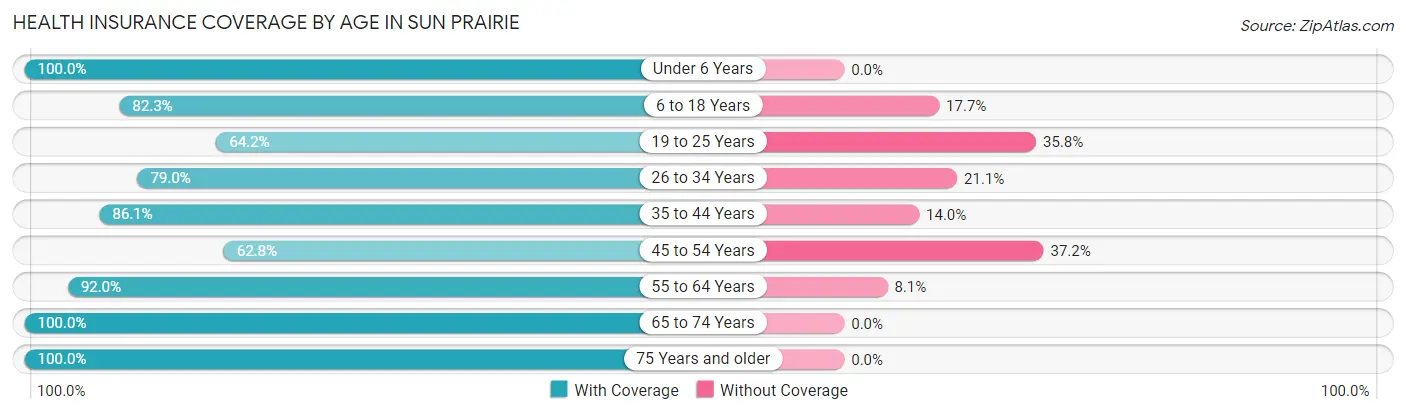
| Age Bracket | With Coverage | Without Coverage |
| Under 6 Years | 101 (100.0%) | 0 (0.0%) |
| 6 to 18 Years | 121 (82.3%) | 26 (17.7%) |
| 19 to 25 Years | 106 (64.2%) | 59 (35.8%) |
| 26 to 34 Years | 75 (78.9%) | 20 (21.0%) |
| 35 to 44 Years | 74 (86.1%) | 12 (14.0%) |
| 45 to 54 Years | 115 (62.8%) | 68 (37.2%) |
| 55 to 64 Years | 217 (91.9%) | 19 (8.1%) |
| 65 to 74 Years | 254 (100.0%) | 0 (0.0%) |
| 75 Years and older | 79 (100.0%) | 0 (0.0%) |
| Total | 1,142 (84.8%) | 204 (15.2%) |
Health Insurance Coverage by Citizenship Status in Sun Prairie
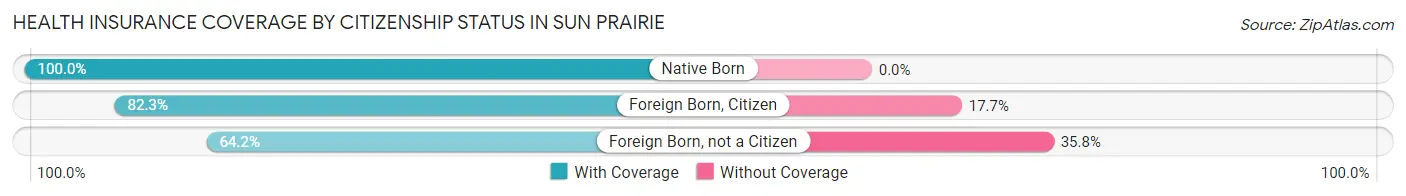
| Citizenship Status | With Coverage | Without Coverage |
| Native Born | 101 (100.0%) | 0 (0.0%) |
| Foreign Born, Citizen | 121 (82.3%) | 26 (17.7%) |
| Foreign Born, not a Citizen | 106 (64.2%) | 59 (35.8%) |
Health Insurance Coverage by Household Income in Sun Prairie
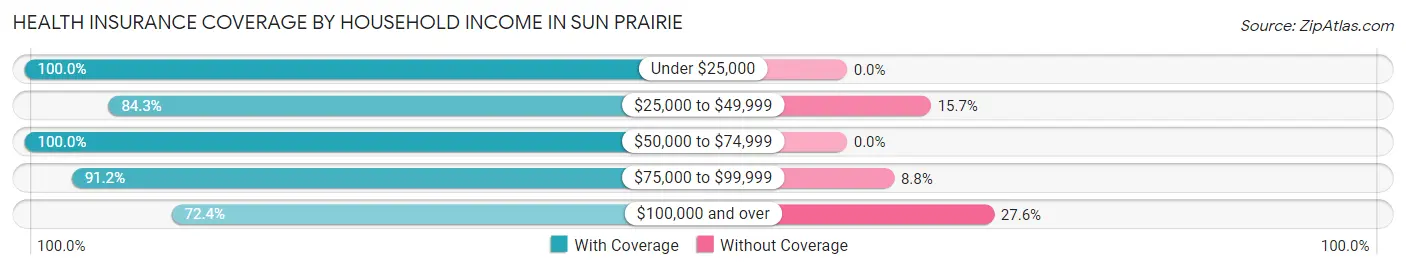
| Household Income | With Coverage | Without Coverage |
| Under $25,000 | 146 (100.0%) | 0 (0.0%) |
| $25,000 to $49,999 | 327 (84.3%) | 61 (15.7%) |
| $50,000 to $74,999 | 147 (100.0%) | 0 (0.0%) |
| $75,000 to $99,999 | 196 (91.2%) | 19 (8.8%) |
| $100,000 and over | 326 (72.4%) | 124 (27.6%) |
Public vs Private Health Insurance Coverage by Age in Sun Prairie
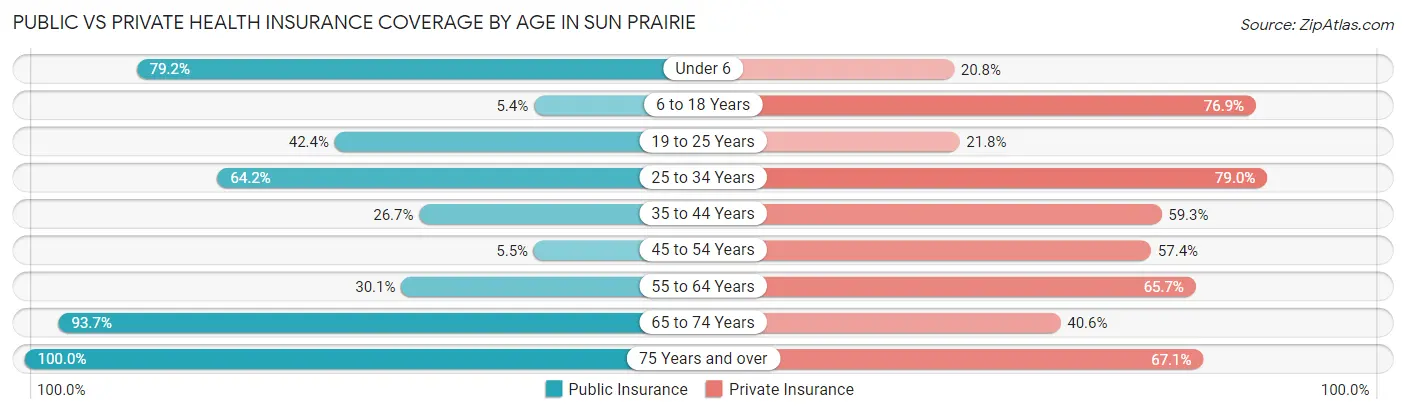
| Age Bracket | Public Insurance | Private Insurance |
| Under 6 | 80 (79.2%) | 21 (20.8%) |
| 6 to 18 Years | 8 (5.4%) | 113 (76.9%) |
| 19 to 25 Years | 70 (42.4%) | 36 (21.8%) |
| 25 to 34 Years | 61 (64.2%) | 75 (78.9%) |
| 35 to 44 Years | 23 (26.7%) | 51 (59.3%) |
| 45 to 54 Years | 10 (5.5%) | 105 (57.4%) |
| 55 to 64 Years | 71 (30.1%) | 155 (65.7%) |
| 65 to 74 Years | 238 (93.7%) | 103 (40.6%) |
| 75 Years and over | 79 (100.0%) | 53 (67.1%) |
| Total | 640 (47.5%) | 712 (52.9%) |
Disability Status by Sex by Age in Sun Prairie
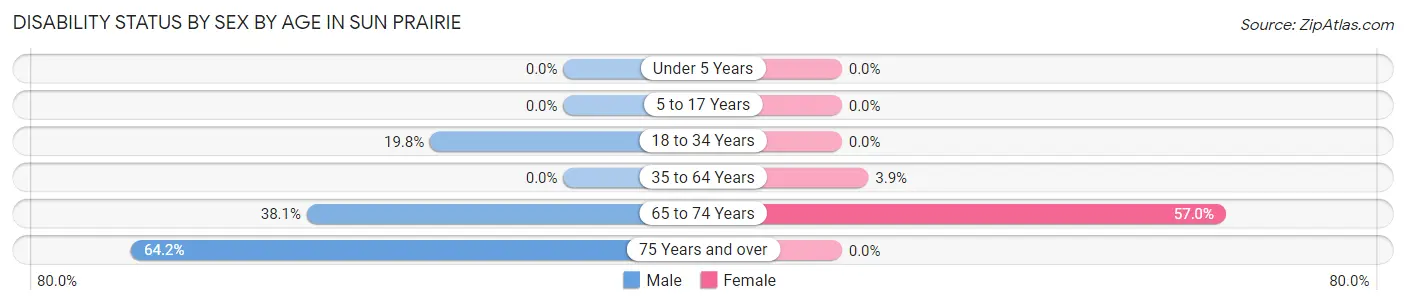
| Age Bracket | Male | Female |
| Under 5 Years | 0 (0.0%) | 0 (0.0%) |
| 5 to 17 Years | 0 (0.0%) | 0 (0.0%) |
| 18 to 34 Years | 19 (19.8%) | 0 (0.0%) |
| 35 to 64 Years | 0 (0.0%) | 8 (3.9%) |
| 65 to 74 Years | 48 (38.1%) | 73 (57.0%) |
| 75 Years and over | 43 (64.2%) | 0 (0.0%) |
Disability Class by Sex by Age in Sun Prairie
Disability Class: Hearing Difficulty
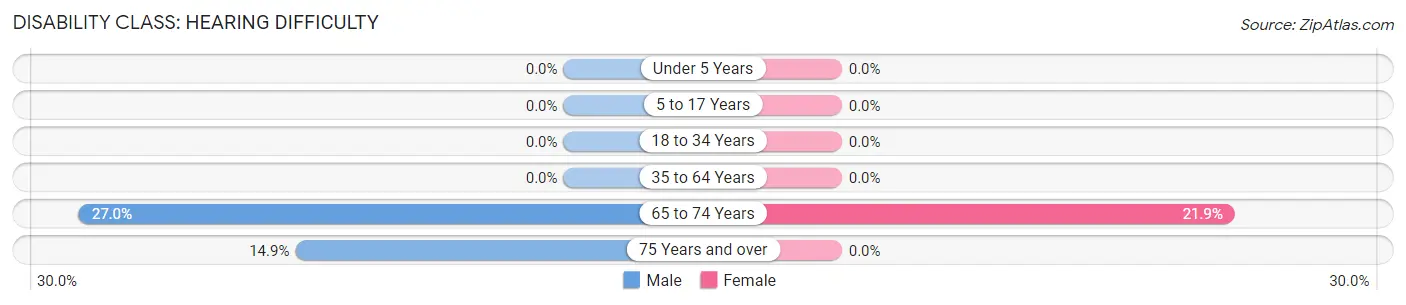
| Age Bracket | Male | Female |
| Under 5 Years | 0 (0.0%) | 0 (0.0%) |
| 5 to 17 Years | 0 (0.0%) | 0 (0.0%) |
| 18 to 34 Years | 0 (0.0%) | 0 (0.0%) |
| 35 to 64 Years | 0 (0.0%) | 0 (0.0%) |
| 65 to 74 Years | 34 (27.0%) | 28 (21.9%) |
| 75 Years and over | 10 (14.9%) | 0 (0.0%) |
Disability Class: Vision Difficulty
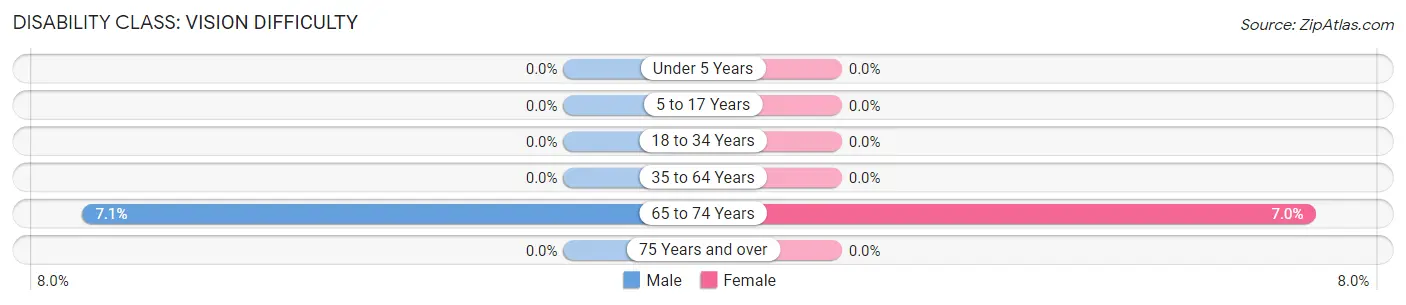
| Age Bracket | Male | Female |
| Under 5 Years | 0 (0.0%) | 0 (0.0%) |
| 5 to 17 Years | 0 (0.0%) | 0 (0.0%) |
| 18 to 34 Years | 0 (0.0%) | 0 (0.0%) |
| 35 to 64 Years | 0 (0.0%) | 0 (0.0%) |
| 65 to 74 Years | 9 (7.1%) | 9 (7.0%) |
| 75 Years and over | 0 (0.0%) | 0 (0.0%) |
Disability Class: Cognitive Difficulty
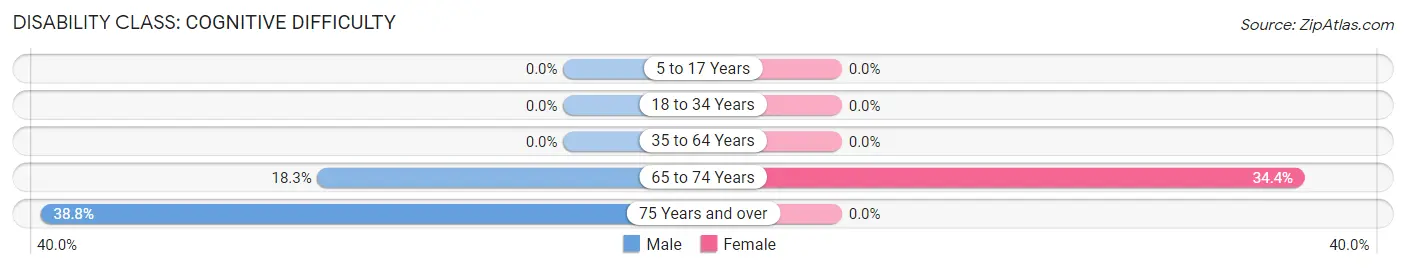
| Age Bracket | Male | Female |
| 5 to 17 Years | 0 (0.0%) | 0 (0.0%) |
| 18 to 34 Years | 0 (0.0%) | 0 (0.0%) |
| 35 to 64 Years | 0 (0.0%) | 0 (0.0%) |
| 65 to 74 Years | 23 (18.2%) | 44 (34.4%) |
| 75 Years and over | 26 (38.8%) | 0 (0.0%) |
Disability Class: Ambulatory Difficulty
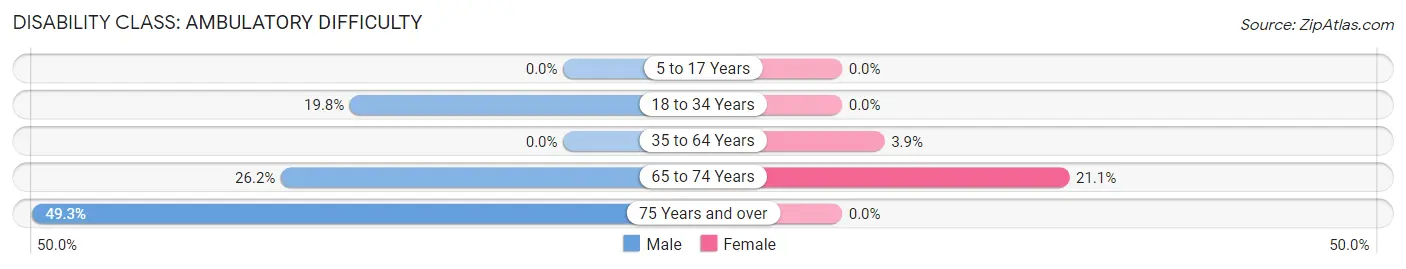
| Age Bracket | Male | Female |
| 5 to 17 Years | 0 (0.0%) | 0 (0.0%) |
| 18 to 34 Years | 19 (19.8%) | 0 (0.0%) |
| 35 to 64 Years | 0 (0.0%) | 8 (3.9%) |
| 65 to 74 Years | 33 (26.2%) | 27 (21.1%) |
| 75 Years and over | 33 (49.2%) | 0 (0.0%) |
Disability Class: Self-Care Difficulty
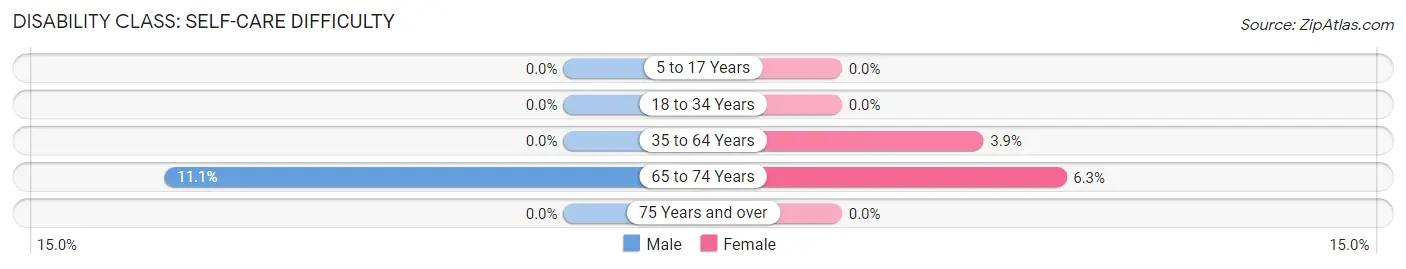
| Age Bracket | Male | Female |
| 5 to 17 Years | 0 (0.0%) | 0 (0.0%) |
| 18 to 34 Years | 0 (0.0%) | 0 (0.0%) |
| 35 to 64 Years | 0 (0.0%) | 8 (3.9%) |
| 65 to 74 Years | 14 (11.1%) | 8 (6.2%) |
| 75 Years and over | 0 (0.0%) | 0 (0.0%) |
Technology Access in Sun Prairie
Computing Device Access in Sun Prairie
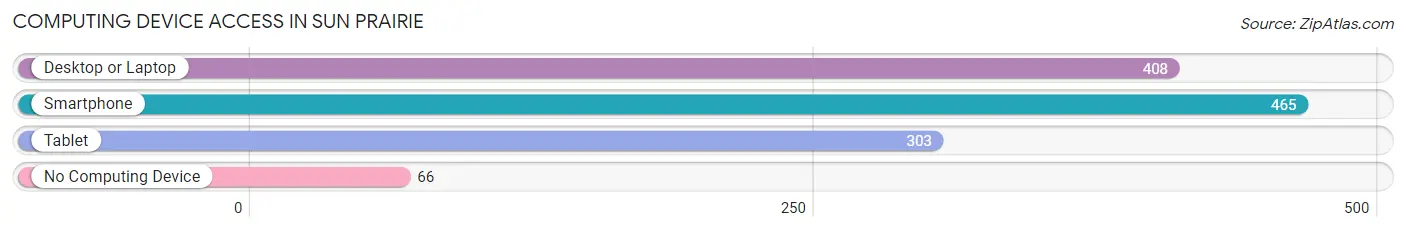
| Device Type | # Households | % Households |
| Desktop or Laptop | 408 | 69.2% |
| Smartphone | 465 | 78.8% |
| Tablet | 303 | 51.4% |
| No Computing Device | 66 | 11.2% |
| Total | 590 | 100.0% |
Internet Access in Sun Prairie
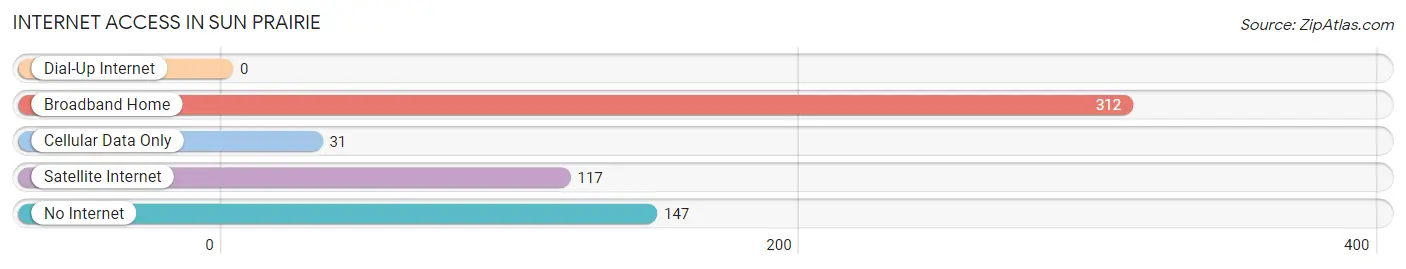
| Internet Type | # Households | % Households |
| Dial-Up Internet | 0 | 0.0% |
| Broadband Home | 312 | 52.9% |
| Cellular Data Only | 31 | 5.2% |
| Satellite Internet | 117 | 19.8% |
| No Internet | 147 | 24.9% |
| Total | 590 | 100.0% |
Sun Prairie Summary
History
The area now known as Sun Prairie, Montana was first inhabited by the Salish and Kootenai tribes. The first European settlers arrived in the area in the late 1800s, and the town was officially founded in 1891. The town was named after the nearby Sun Prairie Creek, which was named by a local rancher who noticed the sun reflecting off the creek.
The town quickly grew, and by the early 1900s, it had become a bustling agricultural center. The town was home to several grain elevators, a flour mill, and a creamery. The town also had a post office, a bank, a hotel, and several stores.
In the 1920s, the town began to experience a decline in population as many of the local farmers moved away. The Great Depression further exacerbated the decline, and by the 1940s, the town had become a virtual ghost town.
In the 1950s, the town began to experience a resurgence as the local economy began to diversify. The town was home to several small businesses, including a sawmill, a lumber yard, and a feed store. The town also had a gas station, a grocery store, and a cafe.
Geography
Sun Prairie is located in the western part of Montana, in the foothills of the Rocky Mountains. The town is situated at an elevation of 4,000 feet, and is surrounded by rolling hills and grasslands. The town is located near the Sun Prairie Creek, which is a tributary of the Bitterroot River.
The climate in Sun Prairie is semi-arid, with hot summers and cold winters. The average annual temperature is around 50 degrees Fahrenheit, and the average annual precipitation is around 15 inches.
Economy
The economy of Sun Prairie is largely based on agriculture and tourism. The town is home to several small farms, which produce a variety of crops, including wheat, barley, oats, and hay. The town is also home to several small businesses, including a sawmill, a lumber yard, and a feed store.
The town is also a popular tourist destination, as it is located near several popular outdoor recreation areas, including the Bitterroot National Forest and the Sun Prairie Creek. The town is also home to several restaurants, cafes, and bars, as well as several bed and breakfasts.
Demographics
As of the 2010 census, the population of Sun Prairie was 1,092. The town is predominantly white, with a small Hispanic population. The median household income is around $35,000, and the median home value is around $150,000. The town has a low unemployment rate, and the majority of the population is employed in the agricultural and tourism industries.
Common Questions
What is Per Capita Income in Sun Prairie?
Per Capita income in Sun Prairie is $31,587.
What is the Median Family Income in Sun Prairie?
Median Family Income in Sun Prairie is $78,661.
What is the Median Household income in Sun Prairie?
Median Household Income in Sun Prairie is $52,311.
What is Income or Wage Gap in Sun Prairie?
Income or Wage Gap in Sun Prairie is 29.9%.
Women in Sun Prairie earn 70.1 cents for every dollar earned by a man.
What is Inequality or Gini Index in Sun Prairie?
Inequality or Gini Index in Sun Prairie is 0.38.
What is the Total Population of Sun Prairie?
Total Population of Sun Prairie is 1,366.
What is the Total Male Population of Sun Prairie?
Total Male Population of Sun Prairie is 694.
What is the Total Female Population of Sun Prairie?
Total Female Population of Sun Prairie is 672.
What is the Ratio of Males per 100 Females in Sun Prairie?
There are 103.27 Males per 100 Females in Sun Prairie.
What is the Ratio of Females per 100 Males in Sun Prairie?
There are 96.83 Females per 100 Males in Sun Prairie.
What is the Median Population Age in Sun Prairie?
Median Population Age in Sun Prairie is 50.0 Years.
What is the Average Family Size in Sun Prairie
Average Family Size in Sun Prairie is 2.7 People.
What is the Average Household Size in Sun Prairie
Average Household Size in Sun Prairie is 2.3 People.
How Large is the Labor Force in Sun Prairie?
There are 675 People in the Labor Forcein in Sun Prairie.
What is the Percentage of People in the Labor Force in Sun Prairie?
59.3% of People are in the Labor Force in Sun Prairie.