Zip Codes with the Highest Percentage of Population with a Degree in Communications in Kansas
RELATED REPORTS & OPTIONS
Communications
Kansas
Compare Zip Codes
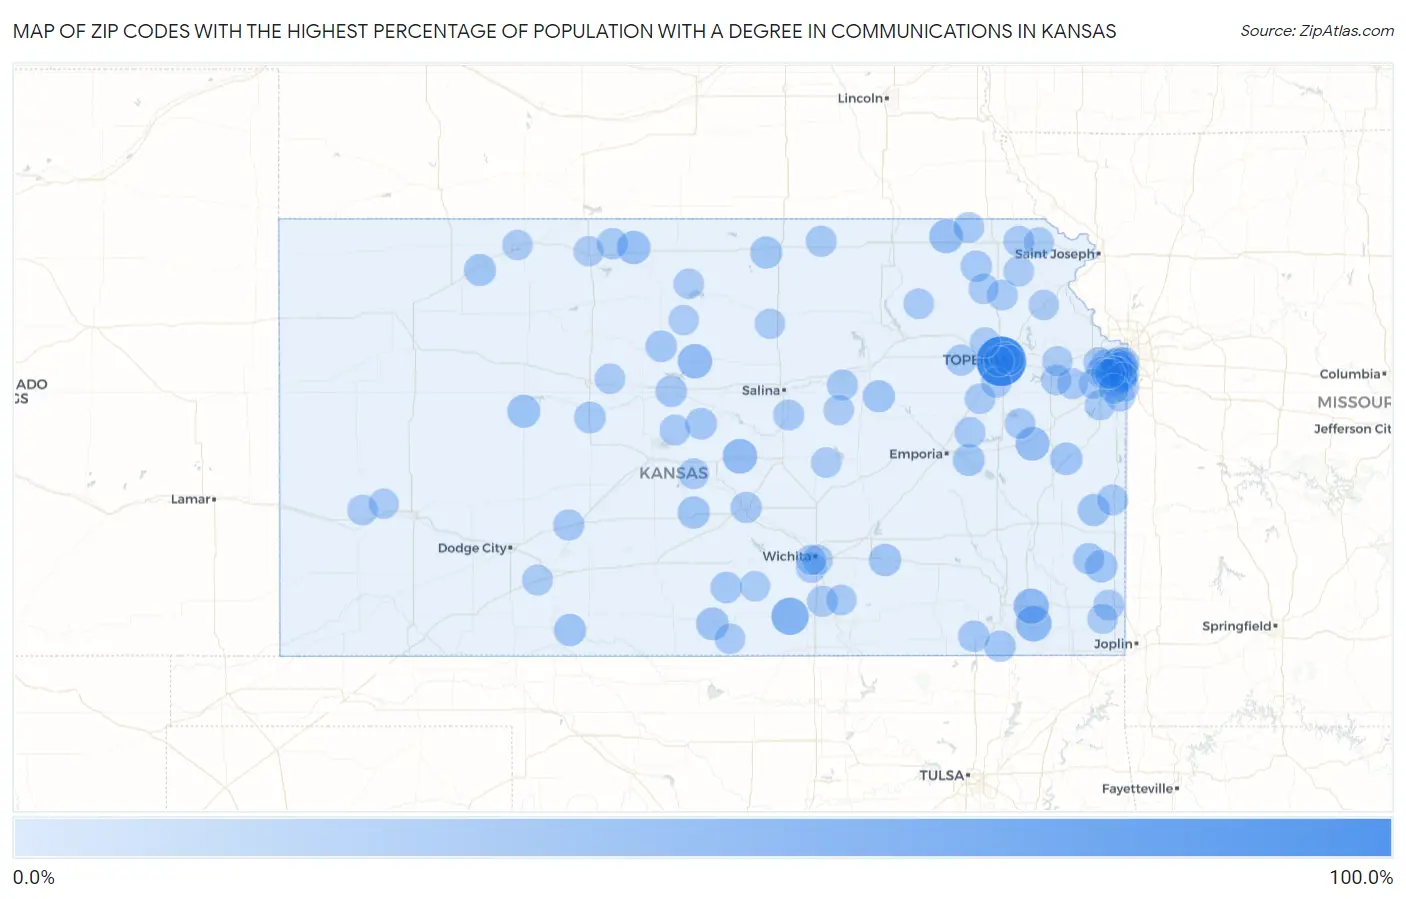
Map of Zip Codes with the Highest Percentage of Population with a Degree in Communications in Kansas
0.0%
100.0%
Zip Codes with the Highest Percentage of Population with a Degree in Communications in Kansas
| Zip Code | % Graduates | vs State | vs National | |
| 1. | 66621 | 100.0% | 4.1%(+95.9)#1 | 4.1%(+95.9)#2 |
| 2. | 67103 | 38.7% | 4.1%(+34.6)#2 | 4.1%(+34.6)#86 |
| 3. | 67354 | 30.4% | 4.1%(+26.3)#3 | 4.1%(+26.3)#151 |
| 4. | 67341 | 29.0% | 4.1%(+24.9)#4 | 4.1%(+24.9)#165 |
| 5. | 67457 | 25.5% | 4.1%(+21.4)#5 | 4.1%(+21.4)#202 |
| 6. | 67481 | 25.4% | 4.1%(+21.2)#6 | 4.1%(+21.2)#204 |
| 7. | 66095 | 22.2% | 4.1%(+18.1)#7 | 4.1%(+18.1)#264 |
| 8. | 66404 | 21.8% | 4.1%(+17.7)#8 | 4.1%(+17.7)#279 |
| 9. | 66932 | 20.0% | 4.1%(+15.9)#9 | 4.1%(+15.9)#333 |
| 10. | 67572 | 17.7% | 4.1%(+13.6)#10 | 4.1%(+13.6)#409 |
| 11. | 67009 | 16.9% | 4.1%(+12.8)#11 | 4.1%(+12.8)#446 |
| 12. | 67074 | 15.4% | 4.1%(+11.2)#12 | 4.1%(+11.2)#530 |
| 13. | 66033 | 15.2% | 4.1%(+11.1)#13 | 4.1%(+11.1)#536 |
| 14. | 66734 | 15.0% | 4.1%(+10.8)#14 | 4.1%(+10.8)#555 |
| 15. | 67581 | 14.3% | 4.1%(+10.1)#15 | 4.1%(+10.2)#604 |
| 16. | 67127 | 14.2% | 4.1%(+10.0)#16 | 4.1%(+10.0)#615 |
| 17. | 66966 | 13.7% | 4.1%(+9.53)#17 | 4.1%(+9.53)#640 |
| 18. | 66754 | 13.6% | 4.1%(+9.50)#18 | 4.1%(+9.50)#643 |
| 19. | 67643 | 13.5% | 4.1%(+9.38)#19 | 4.1%(+9.38)#660 |
| 20. | 66872 | 13.3% | 4.1%(+9.20)#20 | 4.1%(+9.20)#670 |
| 21. | 66207 | 12.9% | 4.1%(+8.79)#21 | 4.1%(+8.79)#713 |
| 22. | 66864 | 12.8% | 4.1%(+8.68)#22 | 4.1%(+8.69)#725 |
| 23. | 67553 | 11.8% | 4.1%(+7.63)#23 | 4.1%(+7.63)#858 |
| 24. | 67459 | 11.5% | 4.1%(+7.40)#24 | 4.1%(+7.40)#888 |
| 25. | 67649 | 11.3% | 4.1%(+7.13)#25 | 4.1%(+7.13)#932 |
| 26. | 67634 | 10.9% | 4.1%(+6.73)#26 | 4.1%(+6.73)#1,000 |
| 27. | 66746 | 10.5% | 4.1%(+6.39)#27 | 4.1%(+6.39)#1,056 |
| 28. | 67142 | 10.3% | 4.1%(+6.21)#28 | 4.1%(+6.21)#1,079 |
| 29. | 67347 | 10.3% | 4.1%(+6.14)#29 | 4.1%(+6.15)#1,091 |
| 30. | 67340 | 10.0% | 4.1%(+5.86)#30 | 4.1%(+5.86)#1,144 |
| 31. | 66428 | 9.8% | 4.1%(+5.67)#31 | 4.1%(+5.67)#1,194 |
| 32. | 66217 | 9.7% | 4.1%(+5.52)#32 | 4.1%(+5.52)#1,226 |
| 33. | 67621 | 9.6% | 4.1%(+5.48)#33 | 4.1%(+5.48)#1,236 |
| 34. | 66202 | 9.6% | 4.1%(+5.48)#34 | 4.1%(+5.48)#1,238 |
| 35. | 67505 | 9.2% | 4.1%(+5.10)#35 | 4.1%(+5.11)#1,343 |
| 36. | 66507 | 9.1% | 4.1%(+4.95)#36 | 4.1%(+4.96)#1,401 |
| 37. | 67547 | 9.0% | 4.1%(+4.84)#37 | 4.1%(+4.84)#1,444 |
| 38. | 66206 | 8.9% | 4.1%(+4.81)#38 | 4.1%(+4.81)#1,458 |
| 39. | 66203 | 8.9% | 4.1%(+4.78)#39 | 4.1%(+4.78)#1,468 |
| 40. | 67441 | 8.3% | 4.1%(+4.20)#40 | 4.1%(+4.20)#1,708 |
| 41. | 66767 | 8.3% | 4.1%(+4.20)#41 | 4.1%(+4.20)#1,715 |
| 42. | 66944 | 8.1% | 4.1%(+3.93)#42 | 4.1%(+3.93)#1,846 |
| 43. | 67013 | 8.0% | 4.1%(+3.89)#43 | 4.1%(+3.89)#1,866 |
| 44. | 66224 | 8.0% | 4.1%(+3.89)#44 | 4.1%(+3.89)#1,867 |
| 45. | 66868 | 8.0% | 4.1%(+3.83)#45 | 4.1%(+3.84)#1,900 |
| 46. | 66204 | 7.8% | 4.1%(+3.68)#46 | 4.1%(+3.68)#2,002 |
| 47. | 67416 | 7.7% | 4.1%(+3.59)#47 | 4.1%(+3.60)#2,039 |
| 48. | 66025 | 7.7% | 4.1%(+3.55)#48 | 4.1%(+3.55)#2,074 |
| 49. | 67842 | 7.6% | 4.1%(+3.44)#49 | 4.1%(+3.44)#2,149 |
| 50. | 66408 | 7.5% | 4.1%(+3.41)#50 | 4.1%(+3.41)#2,161 |
| 51. | 66208 | 7.5% | 4.1%(+3.34)#51 | 4.1%(+3.34)#2,208 |
| 52. | 66762 | 7.5% | 4.1%(+3.33)#52 | 4.1%(+3.34)#2,216 |
| 53. | 66436 | 7.5% | 4.1%(+3.31)#53 | 4.1%(+3.32)#2,235 |
| 54. | 67525 | 7.4% | 4.1%(+3.25)#54 | 4.1%(+3.26)#2,274 |
| 55. | 66205 | 7.3% | 4.1%(+3.19)#55 | 4.1%(+3.19)#2,325 |
| 56. | 66212 | 7.3% | 4.1%(+3.16)#56 | 4.1%(+3.16)#2,343 |
| 57. | 66220 | 7.0% | 4.1%(+2.91)#57 | 4.1%(+2.91)#2,566 |
| 58. | 66434 | 7.0% | 4.1%(+2.85)#58 | 4.1%(+2.85)#2,617 |
| 59. | 67573 | 6.8% | 4.1%(+2.68)#59 | 4.1%(+2.68)#2,781 |
| 60. | 66603 | 6.8% | 4.1%(+2.64)#60 | 4.1%(+2.64)#2,809 |
| 61. | 66413 | 6.7% | 4.1%(+2.59)#61 | 4.1%(+2.59)#2,887 |
| 62. | 67217 | 6.7% | 4.1%(+2.57)#62 | 4.1%(+2.57)#2,909 |
| 63. | 66213 | 6.7% | 4.1%(+2.57)#63 | 4.1%(+2.57)#2,910 |
| 64. | 67146 | 6.7% | 4.1%(+2.56)#64 | 4.1%(+2.56)#2,926 |
| 65. | 66528 | 6.6% | 4.1%(+2.49)#65 | 4.1%(+2.49)#2,995 |
| 66. | 66546 | 6.6% | 4.1%(+2.41)#66 | 4.1%(+2.42)#3,072 |
| 67. | 66226 | 6.4% | 4.1%(+2.30)#67 | 4.1%(+2.30)#3,198 |
| 68. | 66607 | 6.4% | 4.1%(+2.24)#68 | 4.1%(+2.24)#3,279 |
| 69. | 66549 | 6.3% | 4.1%(+2.19)#69 | 4.1%(+2.19)#3,338 |
| 70. | 66214 | 6.2% | 4.1%(+2.08)#70 | 4.1%(+2.09)#3,463 |
| 71. | 66046 | 6.2% | 4.1%(+2.05)#71 | 4.1%(+2.05)#3,493 |
| 72. | 66416 | 6.2% | 4.1%(+2.05)#72 | 4.1%(+2.05)#3,499 |
| 73. | 67671 | 6.2% | 4.1%(+2.04)#73 | 4.1%(+2.04)#3,510 |
| 74. | 67003 | 6.2% | 4.1%(+2.03)#74 | 4.1%(+2.03)#3,528 |
| 75. | 67118 | 6.1% | 4.1%(+1.96)#75 | 4.1%(+1.96)#3,635 |
| 76. | 67063 | 6.1% | 4.1%(+1.93)#76 | 4.1%(+1.93)#3,678 |
| 77. | 66604 | 5.9% | 4.1%(+1.81)#77 | 4.1%(+1.81)#3,865 |
| 78. | 66083 | 5.9% | 4.1%(+1.77)#78 | 4.1%(+1.77)#3,930 |
| 79. | 67860 | 5.9% | 4.1%(+1.75)#79 | 4.1%(+1.75)#3,964 |
| 80. | 67451 | 5.9% | 4.1%(+1.75)#80 | 4.1%(+1.75)#3,972 |
| 81. | 67430 | 5.7% | 4.1%(+1.54)#81 | 4.1%(+1.55)#4,312 |
| 82. | 66773 | 5.6% | 4.1%(+1.50)#82 | 4.1%(+1.50)#4,389 |
| 83. | 66060 | 5.6% | 4.1%(+1.46)#83 | 4.1%(+1.46)#4,452 |
| 84. | 66211 | 5.6% | 4.1%(+1.44)#84 | 4.1%(+1.44)#4,497 |
| 85. | 66439 | 5.6% | 4.1%(+1.42)#85 | 4.1%(+1.42)#4,536 |
| 86. | 67211 | 5.5% | 4.1%(+1.41)#86 | 4.1%(+1.41)#4,571 |
| 87. | 66085 | 5.5% | 4.1%(+1.39)#87 | 4.1%(+1.39)#4,593 |
| 88. | 66061 | 5.5% | 4.1%(+1.35)#88 | 4.1%(+1.35)#4,667 |
| 89. | 67436 | 5.5% | 4.1%(+1.34)#89 | 4.1%(+1.34)#4,679 |
| 90. | 66044 | 5.5% | 4.1%(+1.33)#90 | 4.1%(+1.34)#4,696 |
| 91. | 66539 | 5.5% | 4.1%(+1.33)#91 | 4.1%(+1.34)#4,698 |
| 92. | 67485 | 5.5% | 4.1%(+1.32)#92 | 4.1%(+1.32)#4,729 |
| 93. | 67213 | 5.4% | 4.1%(+1.31)#93 | 4.1%(+1.31)#4,743 |
| 94. | 66532 | 5.4% | 4.1%(+1.31)#94 | 4.1%(+1.31)#4,755 |
| 95. | 67654 | 5.4% | 4.1%(+1.28)#95 | 4.1%(+1.28)#4,810 |
| 96. | 66219 | 5.4% | 4.1%(+1.27)#96 | 4.1%(+1.28)#4,818 |
| 97. | 67661 | 5.4% | 4.1%(+1.23)#97 | 4.1%(+1.23)#4,909 |
| 98. | 67838 | 5.4% | 4.1%(+1.22)#98 | 4.1%(+1.22)#4,932 |
| 99. | 66221 | 5.2% | 4.1%(+1.09)#99 | 4.1%(+1.09)#5,195 |
| 100. | 66215 | 5.2% | 4.1%(+1.07)#100 | 4.1%(+1.07)#5,236 |
Common Questions
What are the Top 10 Zip Codes with the Highest Percentage of Population with a Degree in Communications in Kansas?
Top 10 Zip Codes with the Highest Percentage of Population with a Degree in Communications in Kansas are:
What zip code has the Highest Percentage of Population with a Degree in Communications in Kansas?
66621 has the Highest Percentage of Population with a Degree in Communications in Kansas with 100.0%.
What is the Percentage of Population with a Degree in Communications in the State of Kansas?
Percentage of Population with a Degree in Communications in Kansas is 4.1%.
What is the Percentage of Population with a Degree in Communications in the United States?
Percentage of Population with a Degree in Communications in the United States is 4.1%.