Zip Codes with the Highest Percentage of Households with Income Below $10,000 in Caldwell, ID
RELATED REPORTS & OPTIONS
Household Income | $0-10k
Caldwell
Compare Zip Codes
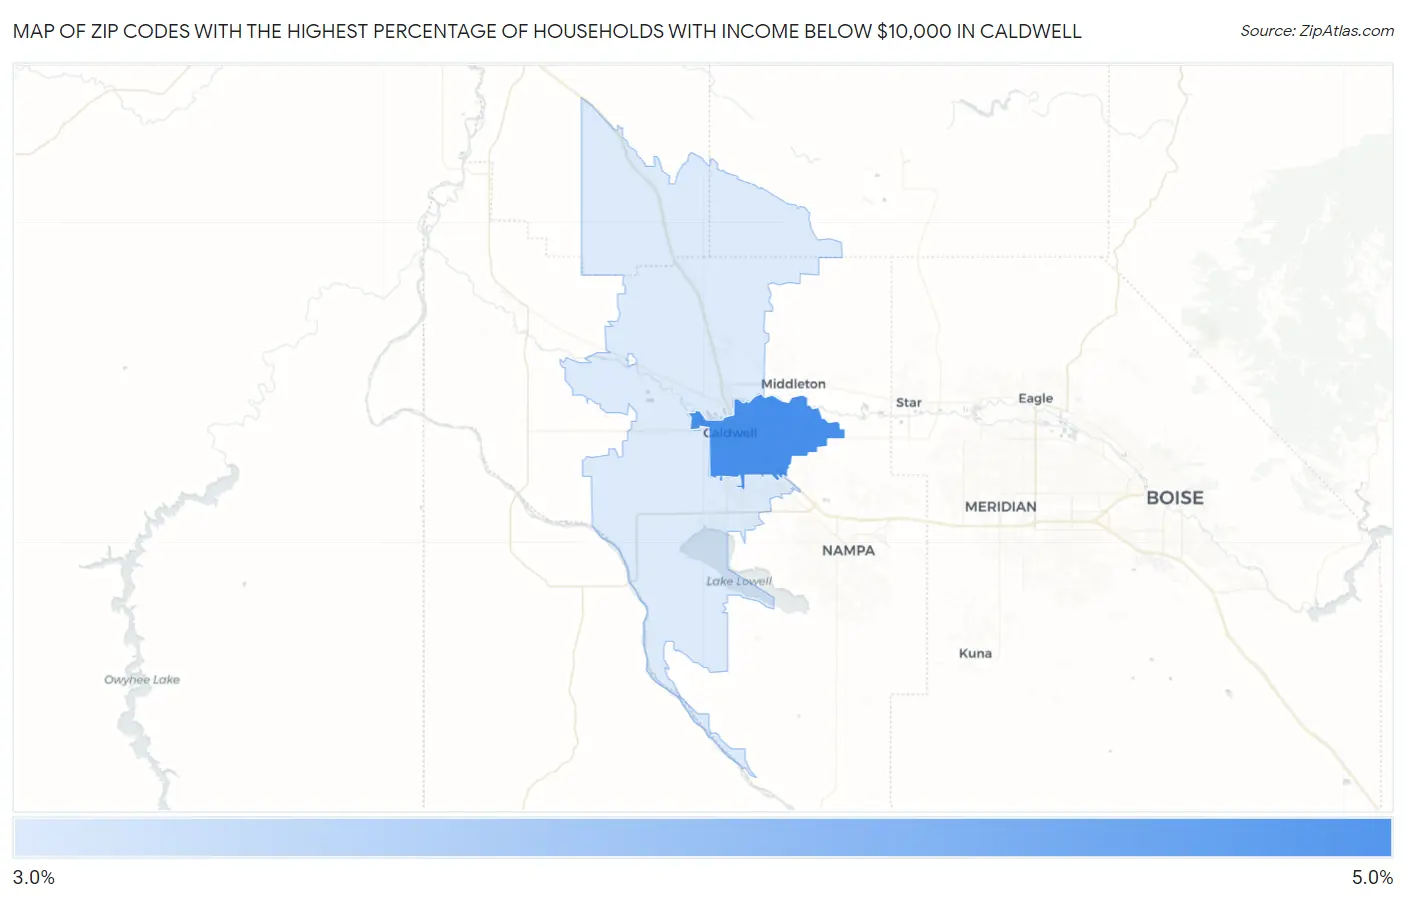
Map of Zip Codes with the Highest Percentage of Households with Income Below $10,000 in Caldwell
3.9%
4.6%
Zip Codes with the Highest Percentage of Households with Income Below $10,000 in Caldwell, ID
| Zip Code | Households with Income < $10k | vs State | vs National | |
| 1. | 83605 | 4.6% | 3.7%(+0.900)#75 | 4.9%(-0.300)#12,992 |
| 2. | 83607 | 3.9% | 3.7%(+0.200)#96 | 4.9%(-1.00)#15,617 |
1
Common Questions
What are the Top Zip Codes with the Highest Percentage of Households with Income Below $10,000 in Caldwell, ID?
Top Zip Codes with the Highest Percentage of Households with Income Below $10,000 in Caldwell, ID are:
What zip code has the Highest Percentage of Households with Income Below $10,000 in Caldwell, ID?
83605 has the Highest Percentage of Households with Income Below $10,000 in Caldwell, ID with 4.6%.
What is the Percentage of Households with Income Below $10,000 in Caldwell, ID?
Percentage of Households with Income Below $10,000 in Caldwell is 4.3%.
What is the Percentage of Households with Income Below $10,000 in Idaho?
Percentage of Households with Income Below $10,000 in Idaho is 3.7%.
What is the Percentage of Households with Income Below $10,000 in the United States?
Percentage of Households with Income Below $10,000 in the United States is 4.9%.