Zip Codes with the Highest Percentage of Households with Income Below $10,000 in Idaho
RELATED REPORTS & OPTIONS
Household Income | $0-10k
Idaho
Compare Zip Codes
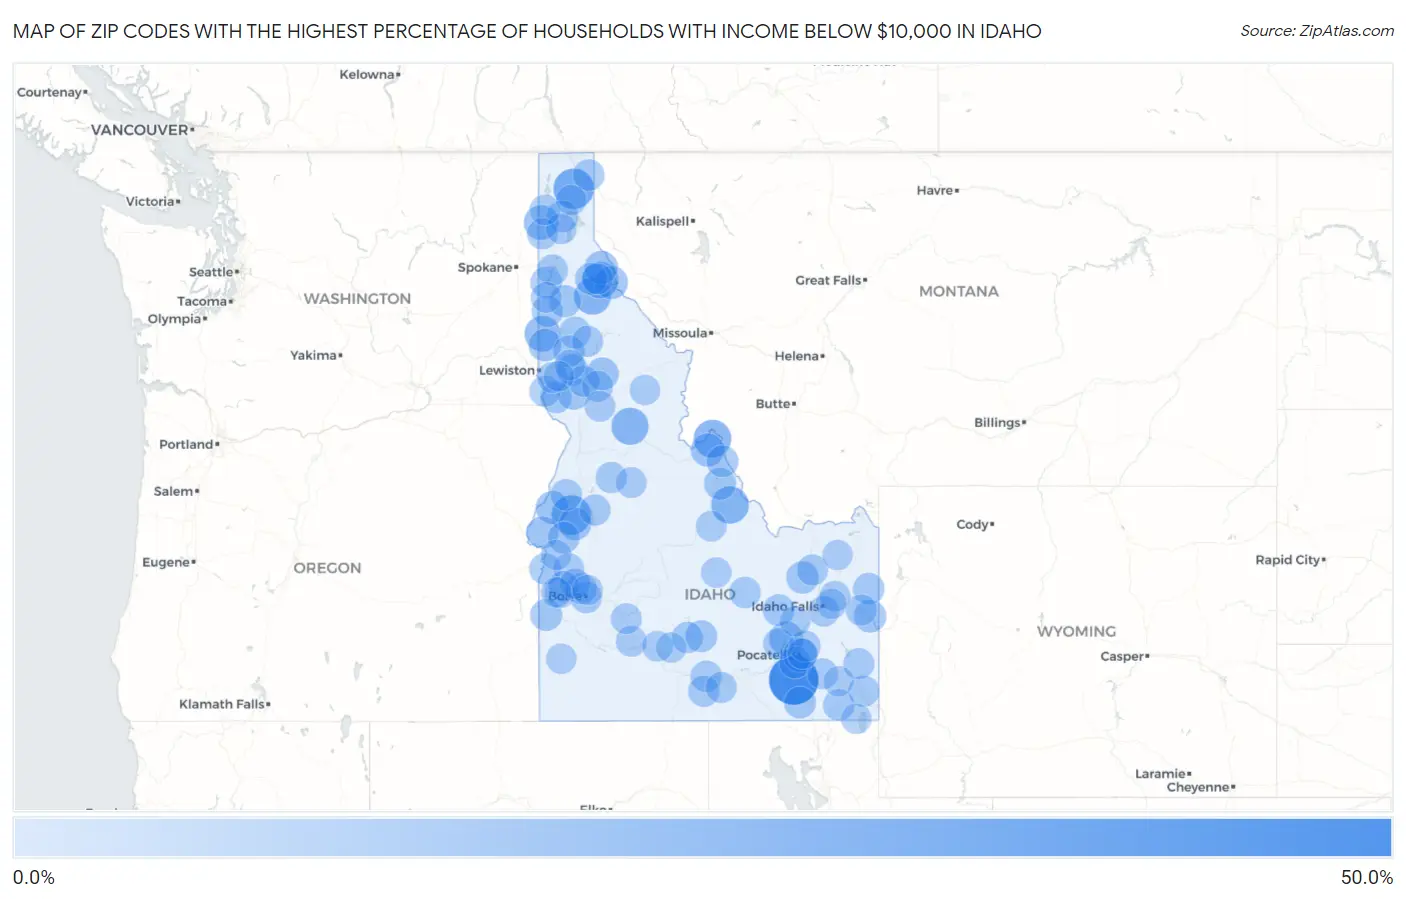
Map of Zip Codes with the Highest Percentage of Households with Income Below $10,000 in Idaho
0.0%
50.0%
Zip Codes with the Highest Percentage of Households with Income Below $10,000 in Idaho
| Zip Code | Households with Income < $10k | vs State | vs National | |
| 1. | 83212 | 43.8% | 3.7%(+40.1)#1 | 4.9%(+38.9)#144 |
| 2. | 83847 | 24.5% | 3.7%(+20.8)#2 | 4.9%(+19.6)#508 |
| 3. | 83643 | 22.4% | 3.7%(+18.7)#3 | 4.9%(+17.5)#615 |
| 4. | 83463 | 18.9% | 3.7%(+15.2)#4 | 4.9%(+14.0)#917 |
| 5. | 83465 | 18.5% | 3.7%(+14.8)#5 | 4.9%(+13.6)#955 |
| 6. | 83525 | 17.7% | 3.7%(+14.0)#6 | 4.9%(+12.8)#1,064 |
| 7. | 83808 | 17.1% | 3.7%(+13.4)#7 | 4.9%(+12.2)#1,154 |
| 8. | 83867 | 16.8% | 3.7%(+13.1)#8 | 4.9%(+11.9)#1,197 |
| 9. | 83872 | 14.9% | 3.7%(+11.2)#9 | 4.9%(+10.00)#1,551 |
| 10. | 83822 | 12.8% | 3.7%(+9.10)#10 | 4.9%(+7.90)#2,172 |
| 11. | 83277 | 11.7% | 3.7%(+8.00)#11 | 4.9%(+6.80)#2,617 |
| 12. | 83209 | 11.1% | 3.7%(+7.40)#12 | 4.9%(+6.20)#2,916 |
| 13. | 83846 | 9.8% | 3.7%(+6.10)#13 | 4.9%(+4.90)#3,778 |
| 14. | 83466 | 9.8% | 3.7%(+6.10)#14 | 4.9%(+4.90)#3,794 |
| 15. | 83873 | 9.6% | 3.7%(+5.90)#15 | 4.9%(+4.70)#3,915 |
| 16. | 83610 | 9.3% | 3.7%(+5.60)#16 | 4.9%(+4.40)#4,166 |
| 17. | 83632 | 8.7% | 3.7%(+5.00)#17 | 4.9%(+3.80)#4,798 |
| 18. | 83843 | 8.3% | 3.7%(+4.60)#18 | 4.9%(+3.40)#5,169 |
| 19. | 83553 | 8.3% | 3.7%(+4.60)#19 | 4.9%(+3.40)#5,250 |
| 20. | 83450 | 8.2% | 3.7%(+4.50)#20 | 4.9%(+3.30)#5,368 |
| 21. | 83428 | 8.2% | 3.7%(+4.50)#21 | 4.9%(+3.30)#5,383 |
| 22. | 83672 | 7.5% | 3.7%(+3.80)#22 | 4.9%(+2.60)#6,244 |
| 23. | 83861 | 7.3% | 3.7%(+3.60)#23 | 4.9%(+2.40)#6,538 |
| 24. | 83837 | 7.2% | 3.7%(+3.50)#24 | 4.9%(+2.30)#6,707 |
| 25. | 83467 | 7.1% | 3.7%(+3.40)#25 | 4.9%(+2.20)#6,837 |
| 26. | 83252 | 6.9% | 3.7%(+3.20)#26 | 4.9%(+2.00)#7,188 |
| 27. | 83462 | 6.9% | 3.7%(+3.20)#27 | 4.9%(+2.00)#7,276 |
| 28. | 83526 | 6.9% | 3.7%(+3.20)#28 | 4.9%(+2.00)#7,279 |
| 29. | 83204 | 6.8% | 3.7%(+3.10)#29 | 4.9%(+1.90)#7,351 |
| 30. | 83639 | 6.8% | 3.7%(+3.10)#30 | 4.9%(+1.90)#7,419 |
| 31. | 83645 | 6.8% | 3.7%(+3.10)#31 | 4.9%(+1.90)#7,478 |
| 32. | 83349 | 6.7% | 3.7%(+3.00)#32 | 4.9%(+1.80)#7,655 |
| 33. | 83806 | 6.5% | 3.7%(+2.80)#33 | 4.9%(+1.60)#8,078 |
| 34. | 83422 | 6.4% | 3.7%(+2.70)#34 | 4.9%(+1.50)#8,206 |
| 35. | 83545 | 6.4% | 3.7%(+2.70)#35 | 4.9%(+1.50)#8,276 |
| 36. | 83876 | 6.3% | 3.7%(+2.60)#36 | 4.9%(+1.40)#8,436 |
| 37. | 83537 | 6.3% | 3.7%(+2.60)#37 | 4.9%(+1.40)#8,456 |
| 38. | 83215 | 6.3% | 3.7%(+2.60)#38 | 4.9%(+1.40)#8,506 |
| 39. | 83612 | 6.2% | 3.7%(+2.50)#39 | 4.9%(+1.30)#8,648 |
| 40. | 83706 | 6.1% | 3.7%(+2.40)#40 | 4.9%(+1.20)#8,734 |
| 41. | 83263 | 6.1% | 3.7%(+2.40)#41 | 4.9%(+1.20)#8,820 |
| 42. | 83543 | 6.1% | 3.7%(+2.40)#42 | 4.9%(+1.20)#8,925 |
| 43. | 83870 | 6.1% | 3.7%(+2.40)#43 | 4.9%(+1.20)#8,937 |
| 44. | 83619 | 6.0% | 3.7%(+2.30)#44 | 4.9%(+1.10)#9,052 |
| 45. | 83845 | 6.0% | 3.7%(+2.30)#45 | 4.9%(+1.10)#9,114 |
| 46. | 83825 | 6.0% | 3.7%(+2.30)#46 | 4.9%(+1.10)#9,175 |
| 47. | 83352 | 5.9% | 3.7%(+2.20)#47 | 4.9%(+1.00)#9,325 |
| 48. | 83555 | 5.9% | 3.7%(+2.20)#48 | 4.9%(+1.00)#9,413 |
| 49. | 83213 | 5.8% | 3.7%(+2.10)#49 | 4.9%(+0.900)#9,626 |
| 50. | 83254 | 5.7% | 3.7%(+2.00)#50 | 4.9%(+0.800)#9,835 |
| 51. | 83335 | 5.7% | 3.7%(+2.00)#51 | 4.9%(+0.800)#9,850 |
| 52. | 83638 | 5.6% | 3.7%(+1.90)#52 | 4.9%(+0.700)#10,041 |
| 53. | 83344 | 5.6% | 3.7%(+1.90)#53 | 4.9%(+0.700)#10,124 |
| 54. | 83827 | 5.6% | 3.7%(+1.90)#54 | 4.9%(+0.700)#10,174 |
| 55. | 83202 | 5.5% | 3.7%(+1.80)#55 | 4.9%(+0.600)#10,241 |
| 56. | 83210 | 5.5% | 3.7%(+1.80)#56 | 4.9%(+0.600)#10,327 |
| 57. | 83501 | 5.4% | 3.7%(+1.70)#57 | 4.9%(+0.500)#10,450 |
| 58. | 83714 | 5.3% | 3.7%(+1.60)#58 | 4.9%(+0.400)#10,769 |
| 59. | 83318 | 5.3% | 3.7%(+1.60)#59 | 4.9%(+0.400)#10,790 |
| 60. | 83276 | 5.3% | 3.7%(+1.60)#60 | 4.9%(+0.400)#10,889 |
| 61. | 83849 | 5.3% | 3.7%(+1.60)#61 | 4.9%(+0.400)#10,931 |
| 62. | 83536 | 5.2% | 3.7%(+1.50)#62 | 4.9%(+0.300)#11,185 |
| 63. | 83615 | 5.2% | 3.7%(+1.50)#63 | 4.9%(+0.300)#11,262 |
| 64. | 83425 | 5.2% | 3.7%(+1.50)#64 | 4.9%(+0.300)#11,291 |
| 65. | 83449 | 5.2% | 3.7%(+1.50)#65 | 4.9%(+0.300)#11,312 |
| 66. | 83814 | 5.1% | 3.7%(+1.40)#66 | 4.9%(+0.200)#11,375 |
| 67. | 83804 | 5.1% | 3.7%(+1.40)#67 | 4.9%(+0.200)#11,555 |
| 68. | 83404 | 5.0% | 3.7%(+1.30)#68 | 4.9%(+0.100)#11,702 |
| 69. | 83246 | 5.0% | 3.7%(+1.30)#69 | 4.9%(+0.100)#11,900 |
| 70. | 83851 | 4.9% | 3.7%(+1.20)#70 | 4.9%(=0.000)#12,182 |
| 71. | 83623 | 4.9% | 3.7%(+1.20)#71 | 4.9%(=0.000)#12,203 |
| 72. | 83647 | 4.7% | 3.7%(+1.000)#72 | 4.9%(-0.200)#12,688 |
| 73. | 83617 | 4.7% | 3.7%(+1.000)#73 | 4.9%(-0.200)#12,708 |
| 74. | 83611 | 4.7% | 3.7%(+1.000)#74 | 4.9%(-0.200)#12,817 |
| 75. | 83605 | 4.6% | 3.7%(+0.900)#75 | 4.9%(-0.300)#12,992 |
| 76. | 83644 | 4.6% | 3.7%(+0.900)#76 | 4.9%(-0.300)#13,076 |
| 77. | 83540 | 4.6% | 3.7%(+0.900)#77 | 4.9%(-0.300)#13,203 |
| 78. | 83813 | 4.6% | 3.7%(+0.900)#78 | 4.9%(-0.300)#13,258 |
| 79. | 83552 | 4.6% | 3.7%(+0.900)#79 | 4.9%(-0.300)#13,269 |
| 80. | 83616 | 4.5% | 3.7%(+0.800)#80 | 4.9%(-0.400)#13,358 |
| 81. | 83442 | 4.4% | 3.7%(+0.700)#81 | 4.9%(-0.500)#13,728 |
| 82. | 83226 | 4.4% | 3.7%(+0.700)#82 | 4.9%(-0.500)#13,898 |
| 83. | 83314 | 4.4% | 3.7%(+0.700)#83 | 4.9%(-0.500)#13,964 |
| 84. | 83856 | 4.3% | 3.7%(+0.600)#84 | 4.9%(-0.600)#14,212 |
| 85. | 83541 | 4.3% | 3.7%(+0.600)#85 | 4.9%(-0.600)#14,359 |
| 86. | 83401 | 4.2% | 3.7%(+0.500)#86 | 4.9%(-0.700)#14,452 |
| 87. | 83201 | 4.2% | 3.7%(+0.500)#87 | 4.9%(-0.700)#14,461 |
| 88. | 83524 | 4.1% | 3.7%(+0.400)#88 | 4.9%(-0.800)#15,136 |
| 89. | 83287 | 4.1% | 3.7%(+0.400)#89 | 4.9%(-0.800)#15,174 |
| 90. | 83702 | 4.0% | 3.7%(+0.300)#90 | 4.9%(-0.900)#15,280 |
| 91. | 83864 | 4.0% | 3.7%(+0.300)#91 | 4.9%(-0.900)#15,296 |
| 92. | 83661 | 4.0% | 3.7%(+0.300)#92 | 4.9%(-0.900)#15,348 |
| 93. | 83241 | 4.0% | 3.7%(+0.300)#93 | 4.9%(-0.900)#15,447 |
| 94. | 83251 | 4.0% | 3.7%(+0.300)#94 | 4.9%(-0.900)#15,489 |
| 95. | 83650 | 4.0% | 3.7%(+0.300)#95 | 4.9%(-0.900)#15,542 |
| 96. | 83607 | 3.9% | 3.7%(+0.200)#96 | 4.9%(-1.00)#15,617 |
| 97. | 83221 | 3.9% | 3.7%(+0.200)#97 | 4.9%(-1.00)#15,639 |
| 98. | 83445 | 3.9% | 3.7%(+0.200)#98 | 4.9%(-1.00)#15,757 |
| 99. | 83330 | 3.9% | 3.7%(+0.200)#99 | 4.9%(-1.00)#15,761 |
| 100. | 83539 | 3.9% | 3.7%(+0.200)#100 | 4.9%(-1.00)#15,845 |
Common Questions
What are the Top 10 Zip Codes with the Highest Percentage of Households with Income Below $10,000 in Idaho?
Top 10 Zip Codes with the Highest Percentage of Households with Income Below $10,000 in Idaho are:
What zip code has the Highest Percentage of Households with Income Below $10,000 in Idaho?
83212 has the Highest Percentage of Households with Income Below $10,000 in Idaho with 43.8%.
What is the Percentage of Households with Income Below $10,000 in the State of Idaho?
Percentage of Households with Income Below $10,000 in Idaho is 3.7%.
What is the Percentage of Households with Income Below $10,000 in the United States?
Percentage of Households with Income Below $10,000 in the United States is 4.9%.