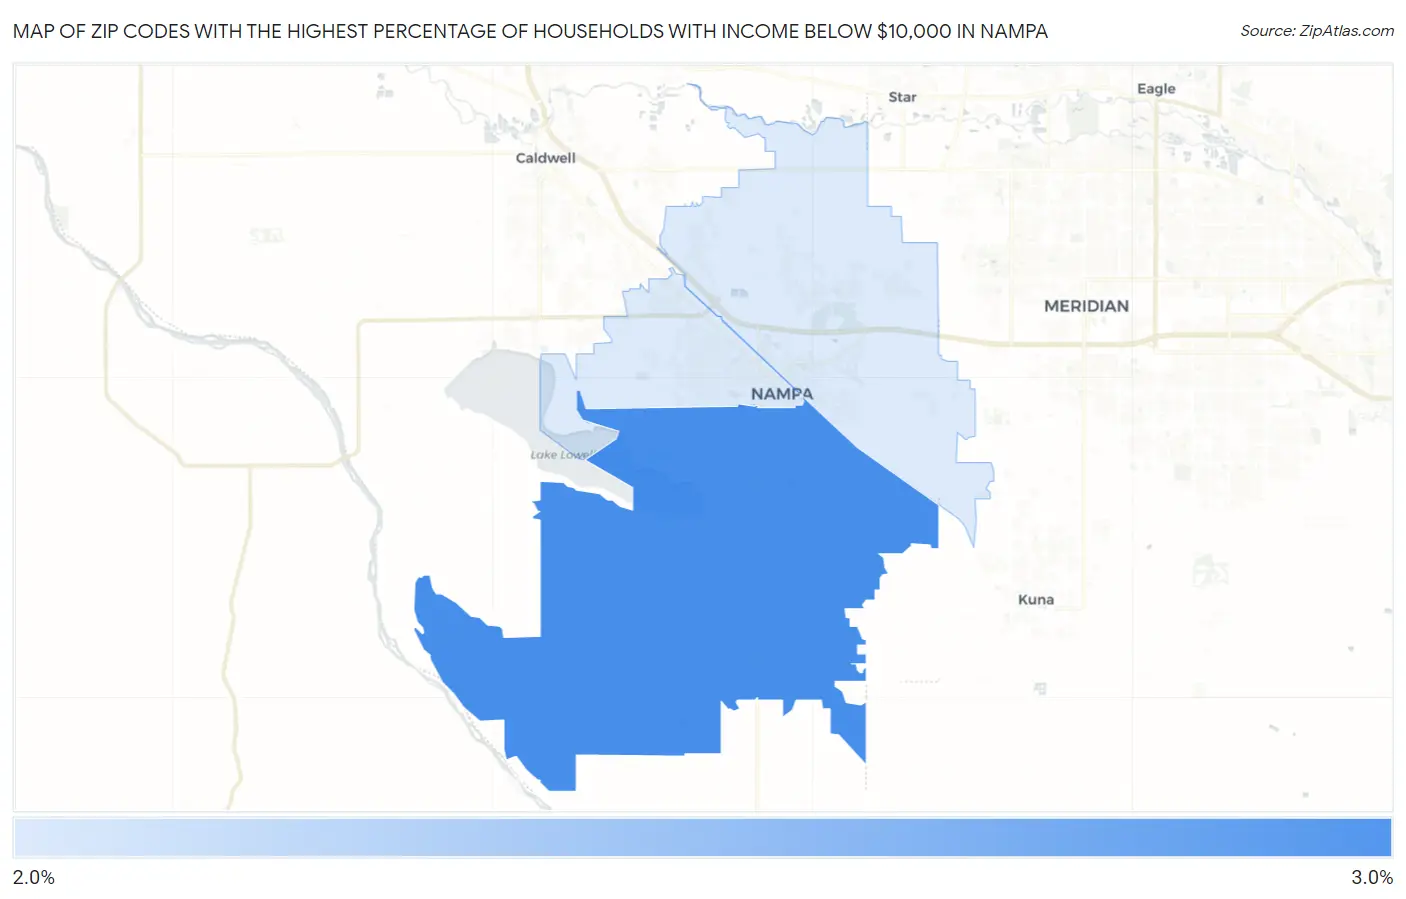
Zip Codes with the Highest Percentage of Households with Income Below $10,000 in Nampa, ID
RELATED REPORTS & OPTIONS
Household Income | $0-10k
Nampa
Compare Zip Codes
Map of Zip Codes with the Highest Percentage of Households with Income Below $10,000 in Nampa
2.5%
2.6%
Zip Codes with the Highest Percentage of Households with Income Below $10,000 in Nampa, ID
| Zip Code | Households with Income < $10k | vs State | vs National | |
| 1. | 83686 | 2.6% | 3.7%(-1.10)#148 | 4.9%(-2.30)#21,048 |
| 2. | 83687 | 2.5% | 3.7%(-1.20)#154 | 4.9%(-2.40)#21,556 |
| 3. | 83651 | 2.5% | 3.7%(-1.20)#155 | 4.9%(-2.40)#21,557 |
1
Common Questions
What are the Top Zip Codes with the Highest Percentage of Households with Income Below $10,000 in Nampa, ID?
Top Zip Codes with the Highest Percentage of Households with Income Below $10,000 in Nampa, ID are:
What zip code has the Highest Percentage of Households with Income Below $10,000 in Nampa, ID?
83686 has the Highest Percentage of Households with Income Below $10,000 in Nampa, ID with 2.6%.
What is the Percentage of Households with Income Below $10,000 in Nampa, ID?
Percentage of Households with Income Below $10,000 in Nampa is 2.9%.
What is the Percentage of Households with Income Below $10,000 in Idaho?
Percentage of Households with Income Below $10,000 in Idaho is 3.7%.
What is the Percentage of Households with Income Below $10,000 in the United States?
Percentage of Households with Income Below $10,000 in the United States is 4.9%.