Scandinavian vs Dutch Disability Age 5 to 17
COMPARE
Scandinavian
Dutch
Disability Age 5 to 17
Disability Age 5 to 17 Comparison
Scandinavians
Dutch
5.9%
DISABILITY AGE 5 TO 17
1.4/ 100
METRIC RATING
253rd/ 347
METRIC RANK
6.0%
DISABILITY AGE 5 TO 17
0.2/ 100
METRIC RATING
275th/ 347
METRIC RANK
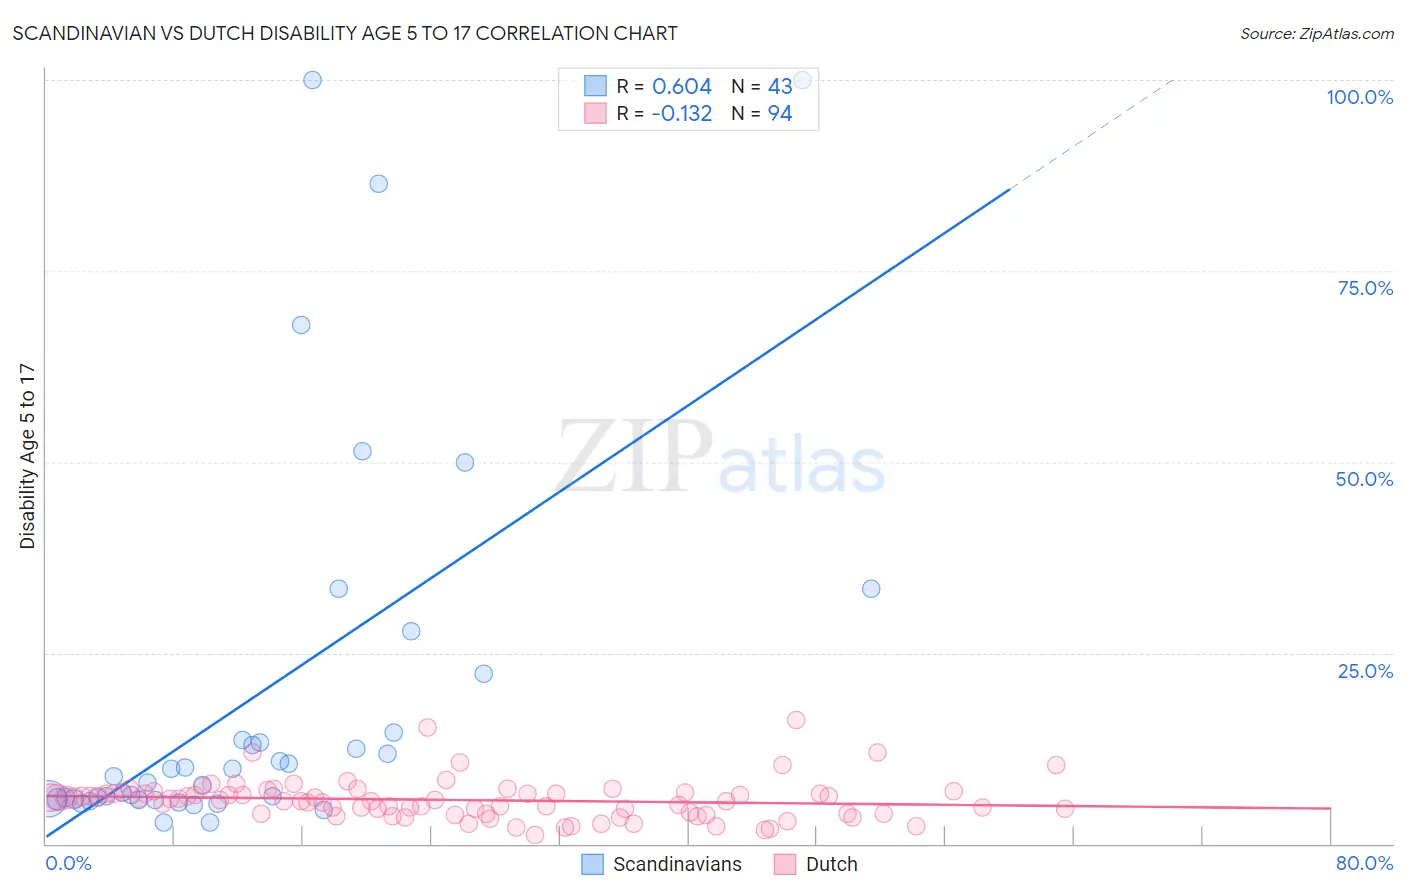
Scandinavian vs Dutch Disability Age 5 to 17 Correlation Chart
The statistical analysis conducted on geographies consisting of 465,927,365 people shows a significant positive correlation between the proportion of Scandinavians and percentage of population with a disability between the ages 5 and 17 in the United States with a correlation coefficient (R) of 0.604 and weighted average of 5.9%. Similarly, the statistical analysis conducted on geographies consisting of 542,324,990 people shows a poor negative correlation between the proportion of Dutch and percentage of population with a disability between the ages 5 and 17 in the United States with a correlation coefficient (R) of -0.132 and weighted average of 6.0%, a difference of 2.6%.
Disability Age 5 to 17 Correlation Summary
| Measurement | Scandinavian | Dutch |
| Minimum | 2.7% | 1.1% |
| Maximum | 100.0% | 16.2% |
| Range | 97.3% | 15.1% |
| Mean | 19.3% | 5.7% |
| Median | 8.8% | 5.7% |
| Interquartile 25% (IQ1) | 5.8% | 3.9% |
| Interquartile 75% (IQ3) | 14.5% | 6.6% |
| Interquartile Range (IQR) | 8.7% | 2.7% |
| Standard Deviation (Sample) | 25.4% | 2.6% |
| Standard Deviation (Population) | 25.1% | 2.6% |
Similar Demographics by Disability Age 5 to 17
Demographics Similar to Scandinavians by Disability Age 5 to 17
In terms of disability age 5 to 17, the demographic groups most similar to Scandinavians are Honduran (5.9%, a difference of 0.070%), Immigrants from Cambodia (5.9%, a difference of 0.090%), Barbadian (5.9%, a difference of 0.10%), Polish (5.9%, a difference of 0.11%), and Italian (5.9%, a difference of 0.17%).
| Demographics | Rating | Rank | Disability Age 5 to 17 |
| Tlingit-Haida | 1.9 /100 | #246 | Tragic 5.9% |
| Immigrants | Honduras | 1.8 /100 | #247 | Tragic 5.9% |
| British | 1.7 /100 | #248 | Tragic 5.9% |
| Immigrants | Ghana | 1.7 /100 | #249 | Tragic 5.9% |
| Poles | 1.5 /100 | #250 | Tragic 5.9% |
| Immigrants | Cambodia | 1.5 /100 | #251 | Tragic 5.9% |
| Hondurans | 1.5 /100 | #252 | Tragic 5.9% |
| Scandinavians | 1.4 /100 | #253 | Tragic 5.9% |
| Barbadians | 1.3 /100 | #254 | Tragic 5.9% |
| Italians | 1.2 /100 | #255 | Tragic 5.9% |
| Hopi | 1.0 /100 | #256 | Tragic 5.9% |
| Hispanics or Latinos | 1.0 /100 | #257 | Tragic 5.9% |
| Brazilians | 0.9 /100 | #258 | Tragic 5.9% |
| Slavs | 0.9 /100 | #259 | Tragic 5.9% |
| Somalis | 0.8 /100 | #260 | Tragic 5.9% |
Demographics Similar to Dutch by Disability Age 5 to 17
In terms of disability age 5 to 17, the demographic groups most similar to Dutch are Cheyenne (6.0%, a difference of 0.11%), Japanese (6.1%, a difference of 0.11%), Alaska Native (6.0%, a difference of 0.22%), Finnish (6.0%, a difference of 0.27%), and Immigrants from Zaire (6.0%, a difference of 0.30%).
| Demographics | Rating | Rank | Disability Age 5 to 17 |
| Sioux | 0.4 /100 | #268 | Tragic 6.0% |
| Liberians | 0.4 /100 | #269 | Tragic 6.0% |
| Immigrants | Somalia | 0.4 /100 | #270 | Tragic 6.0% |
| Immigrants | Zaire | 0.2 /100 | #271 | Tragic 6.0% |
| Finns | 0.2 /100 | #272 | Tragic 6.0% |
| Alaska Natives | 0.2 /100 | #273 | Tragic 6.0% |
| Cheyenne | 0.2 /100 | #274 | Tragic 6.0% |
| Dutch | 0.2 /100 | #275 | Tragic 6.0% |
| Japanese | 0.1 /100 | #276 | Tragic 6.1% |
| Puget Sound Salish | 0.1 /100 | #277 | Tragic 6.1% |
| Immigrants | Liberia | 0.1 /100 | #278 | Tragic 6.1% |
| Immigrants | Jamaica | 0.1 /100 | #279 | Tragic 6.1% |
| Portuguese | 0.1 /100 | #280 | Tragic 6.1% |
| Scottish | 0.0 /100 | #281 | Tragic 6.1% |
| Germans | 0.0 /100 | #282 | Tragic 6.1% |