Scandinavian vs Israeli Disability Age 5 to 17
COMPARE
Scandinavian
Israeli
Disability Age 5 to 17
Disability Age 5 to 17 Comparison
Scandinavians
Israelis
5.9%
DISABILITY AGE 5 TO 17
1.4/ 100
METRIC RATING
253rd/ 347
METRIC RANK
5.0%
DISABILITY AGE 5 TO 17
100.0/ 100
METRIC RATING
34th/ 347
METRIC RANK
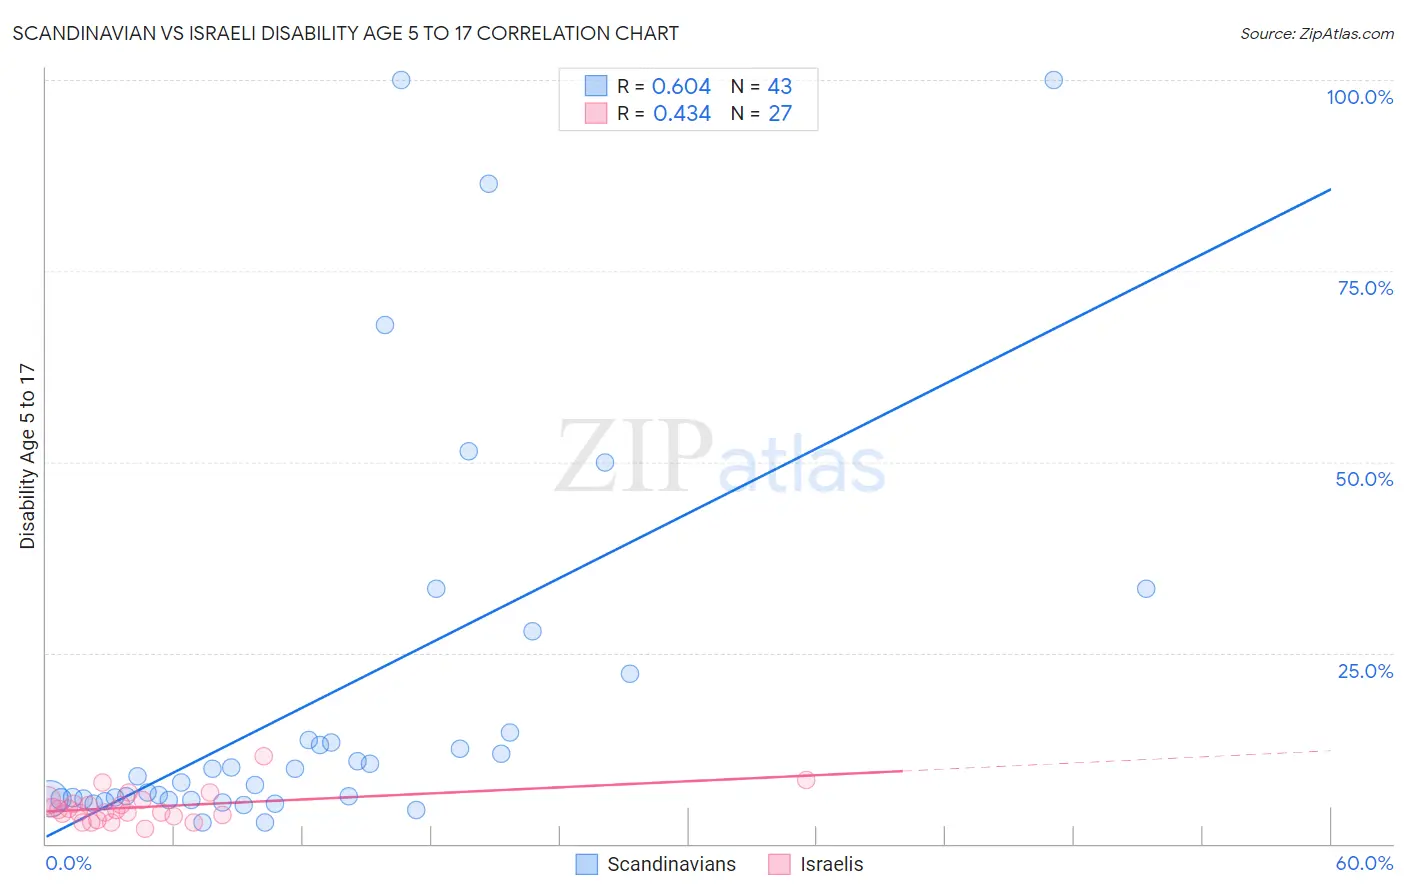
Scandinavian vs Israeli Disability Age 5 to 17 Correlation Chart
The statistical analysis conducted on geographies consisting of 465,927,365 people shows a significant positive correlation between the proportion of Scandinavians and percentage of population with a disability between the ages 5 and 17 in the United States with a correlation coefficient (R) of 0.604 and weighted average of 5.9%. Similarly, the statistical analysis conducted on geographies consisting of 209,817,716 people shows a moderate positive correlation between the proportion of Israelis and percentage of population with a disability between the ages 5 and 17 in the United States with a correlation coefficient (R) of 0.434 and weighted average of 5.0%, a difference of 18.0%.
Disability Age 5 to 17 Correlation Summary
| Measurement | Scandinavian | Israeli |
| Minimum | 2.7% | 2.0% |
| Maximum | 100.0% | 11.4% |
| Range | 97.3% | 9.5% |
| Mean | 19.3% | 4.8% |
| Median | 8.8% | 4.5% |
| Interquartile 25% (IQ1) | 5.8% | 3.5% |
| Interquartile 75% (IQ3) | 14.5% | 5.7% |
| Interquartile Range (IQR) | 8.7% | 2.1% |
| Standard Deviation (Sample) | 25.4% | 2.0% |
| Standard Deviation (Population) | 25.1% | 2.0% |
Similar Demographics by Disability Age 5 to 17
Demographics Similar to Scandinavians by Disability Age 5 to 17
In terms of disability age 5 to 17, the demographic groups most similar to Scandinavians are Honduran (5.9%, a difference of 0.070%), Immigrants from Cambodia (5.9%, a difference of 0.090%), Barbadian (5.9%, a difference of 0.10%), Polish (5.9%, a difference of 0.11%), and Italian (5.9%, a difference of 0.17%).
| Demographics | Rating | Rank | Disability Age 5 to 17 |
| Tlingit-Haida | 1.9 /100 | #246 | Tragic 5.9% |
| Immigrants | Honduras | 1.8 /100 | #247 | Tragic 5.9% |
| British | 1.7 /100 | #248 | Tragic 5.9% |
| Immigrants | Ghana | 1.7 /100 | #249 | Tragic 5.9% |
| Poles | 1.5 /100 | #250 | Tragic 5.9% |
| Immigrants | Cambodia | 1.5 /100 | #251 | Tragic 5.9% |
| Hondurans | 1.5 /100 | #252 | Tragic 5.9% |
| Scandinavians | 1.4 /100 | #253 | Tragic 5.9% |
| Barbadians | 1.3 /100 | #254 | Tragic 5.9% |
| Italians | 1.2 /100 | #255 | Tragic 5.9% |
| Hopi | 1.0 /100 | #256 | Tragic 5.9% |
| Hispanics or Latinos | 1.0 /100 | #257 | Tragic 5.9% |
| Brazilians | 0.9 /100 | #258 | Tragic 5.9% |
| Slavs | 0.9 /100 | #259 | Tragic 5.9% |
| Somalis | 0.8 /100 | #260 | Tragic 5.9% |
Demographics Similar to Israelis by Disability Age 5 to 17
In terms of disability age 5 to 17, the demographic groups most similar to Israelis are Immigrants from Indonesia (5.0%, a difference of 0.12%), Bolivian (5.0%, a difference of 0.19%), Immigrants from Egypt (5.0%, a difference of 0.23%), Immigrants from Belarus (5.0%, a difference of 0.26%), and Immigrants from Philippines (5.0%, a difference of 0.30%).
| Demographics | Rating | Rank | Disability Age 5 to 17 |
| Taiwanese | 100.0 /100 | #27 | Exceptional 4.9% |
| Immigrants | Japan | 100.0 /100 | #28 | Exceptional 4.9% |
| Immigrants | Serbia | 100.0 /100 | #29 | Exceptional 4.9% |
| Immigrants | Malaysia | 100.0 /100 | #30 | Exceptional 5.0% |
| Immigrants | Pakistan | 100.0 /100 | #31 | Exceptional 5.0% |
| Soviet Union | 100.0 /100 | #32 | Exceptional 5.0% |
| Immigrants | Indonesia | 100.0 /100 | #33 | Exceptional 5.0% |
| Israelis | 100.0 /100 | #34 | Exceptional 5.0% |
| Bolivians | 100.0 /100 | #35 | Exceptional 5.0% |
| Immigrants | Egypt | 100.0 /100 | #36 | Exceptional 5.0% |
| Immigrants | Belarus | 100.0 /100 | #37 | Exceptional 5.0% |
| Immigrants | Philippines | 100.0 /100 | #38 | Exceptional 5.0% |
| Immigrants | Argentina | 100.0 /100 | #39 | Exceptional 5.0% |
| Okinawans | 100.0 /100 | #40 | Exceptional 5.0% |
| Immigrants | Australia | 100.0 /100 | #41 | Exceptional 5.0% |