Irish vs Yup'ik Disability Age 5 to 17
COMPARE
Irish
Yup'ik
Disability Age 5 to 17
Disability Age 5 to 17 Comparison
Irish
Yup'ik
6.2%
DISABILITY AGE 5 TO 17
0.0/ 100
METRIC RATING
294th/ 347
METRIC RANK
4.8%
DISABILITY AGE 5 TO 17
100.0/ 100
METRIC RATING
21st/ 347
METRIC RANK
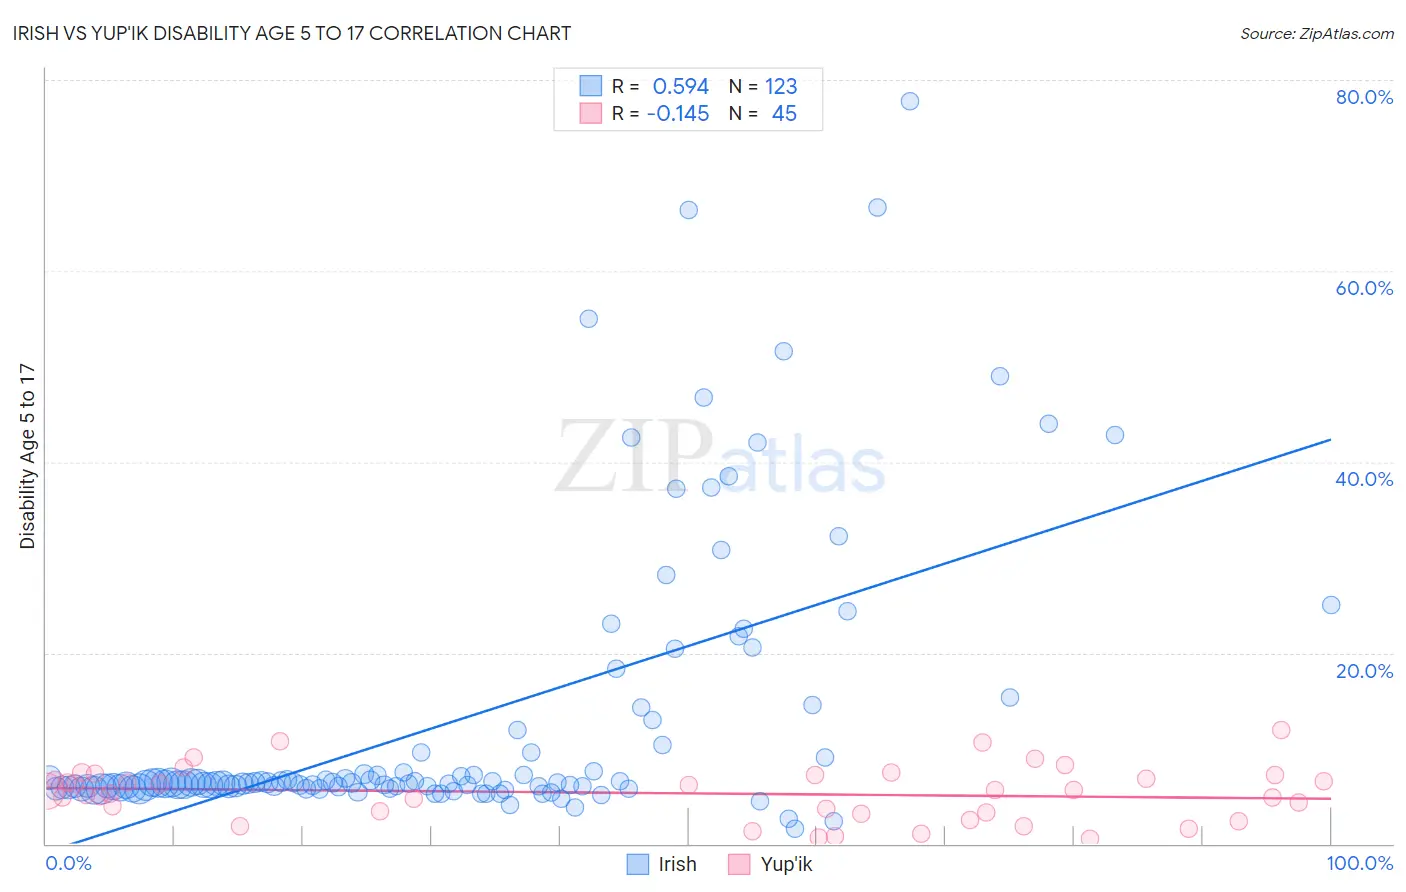
Irish vs Yup'ik Disability Age 5 to 17 Correlation Chart
The statistical analysis conducted on geographies consisting of 563,958,915 people shows a substantial positive correlation between the proportion of Irish and percentage of population with a disability between the ages 5 and 17 in the United States with a correlation coefficient (R) of 0.594 and weighted average of 6.2%. Similarly, the statistical analysis conducted on geographies consisting of 39,814,891 people shows a poor negative correlation between the proportion of Yup'ik and percentage of population with a disability between the ages 5 and 17 in the United States with a correlation coefficient (R) of -0.145 and weighted average of 4.8%, a difference of 29.8%.
Disability Age 5 to 17 Correlation Summary
| Measurement | Irish | Yup'ik |
| Minimum | 1.5% | 0.58% |
| Maximum | 77.8% | 11.9% |
| Range | 76.2% | 11.3% |
| Mean | 13.0% | 5.3% |
| Median | 6.4% | 5.6% |
| Interquartile 25% (IQ1) | 5.9% | 3.3% |
| Interquartile 75% (IQ3) | 10.3% | 7.2% |
| Interquartile Range (IQR) | 4.4% | 3.9% |
| Standard Deviation (Sample) | 14.9% | 2.8% |
| Standard Deviation (Population) | 14.9% | 2.8% |
Similar Demographics by Disability Age 5 to 17
Demographics Similar to Irish by Disability Age 5 to 17
In terms of disability age 5 to 17, the demographic groups most similar to Irish are Central American Indian (6.2%, a difference of 0.0%), Immigrants from Senegal (6.2%, a difference of 0.020%), White/Caucasian (6.2%, a difference of 0.26%), Cree (6.2%, a difference of 0.27%), and Spanish American (6.2%, a difference of 0.30%).
| Demographics | Rating | Rank | Disability Age 5 to 17 |
| Pima | 0.0 /100 | #287 | Tragic 6.2% |
| Jamaicans | 0.0 /100 | #288 | Tragic 6.2% |
| Yaqui | 0.0 /100 | #289 | Tragic 6.2% |
| Immigrants | Congo | 0.0 /100 | #290 | Tragic 6.2% |
| Whites/Caucasians | 0.0 /100 | #291 | Tragic 6.2% |
| Immigrants | Senegal | 0.0 /100 | #292 | Tragic 6.2% |
| Central American Indians | 0.0 /100 | #293 | Tragic 6.2% |
| Irish | 0.0 /100 | #294 | Tragic 6.2% |
| Cree | 0.0 /100 | #295 | Tragic 6.2% |
| Spanish Americans | 0.0 /100 | #296 | Tragic 6.2% |
| Immigrants | Bahamas | 0.0 /100 | #297 | Tragic 6.2% |
| Lumbee | 0.0 /100 | #298 | Tragic 6.2% |
| Welsh | 0.0 /100 | #299 | Tragic 6.3% |
| Carpatho Rusyns | 0.0 /100 | #300 | Tragic 6.3% |
| U.S. Virgin Islanders | 0.0 /100 | #301 | Tragic 6.3% |
Demographics Similar to Yup'ik by Disability Age 5 to 17
In terms of disability age 5 to 17, the demographic groups most similar to Yup'ik are Burmese (4.8%, a difference of 0.22%), Asian (4.8%, a difference of 0.34%), Immigrants from Uzbekistan (4.8%, a difference of 0.60%), Immigrants from Bolivia (4.8%, a difference of 1.0%), and Immigrants from South Central Asia (4.7%, a difference of 1.1%).
| Demographics | Rating | Rank | Disability Age 5 to 17 |
| Immigrants | Korea | 100.0 /100 | #14 | Exceptional 4.7% |
| Chinese | 100.0 /100 | #15 | Exceptional 4.7% |
| Immigrants | Singapore | 100.0 /100 | #16 | Exceptional 4.7% |
| Arapaho | 100.0 /100 | #17 | Exceptional 4.7% |
| Immigrants | South Central Asia | 100.0 /100 | #18 | Exceptional 4.7% |
| Immigrants | Uzbekistan | 100.0 /100 | #19 | Exceptional 4.8% |
| Burmese | 100.0 /100 | #20 | Exceptional 4.8% |
| Yup'ik | 100.0 /100 | #21 | Exceptional 4.8% |
| Asians | 100.0 /100 | #22 | Exceptional 4.8% |
| Immigrants | Bolivia | 100.0 /100 | #23 | Exceptional 4.8% |
| Immigrants | Lebanon | 100.0 /100 | #24 | Exceptional 4.8% |
| Immigrants | Asia | 100.0 /100 | #25 | Exceptional 4.8% |
| Bhutanese | 100.0 /100 | #26 | Exceptional 4.9% |
| Taiwanese | 100.0 /100 | #27 | Exceptional 4.9% |
| Immigrants | Japan | 100.0 /100 | #28 | Exceptional 4.9% |