Irish vs Immigrants from Western Asia Disability Age 5 to 17
COMPARE
Irish
Immigrants from Western Asia
Disability Age 5 to 17
Disability Age 5 to 17 Comparison
Irish
Immigrants from Western Asia
6.2%
DISABILITY AGE 5 TO 17
0.0/ 100
METRIC RATING
294th/ 347
METRIC RANK
5.1%
DISABILITY AGE 5 TO 17
100.0/ 100
METRIC RATING
49th/ 347
METRIC RANK
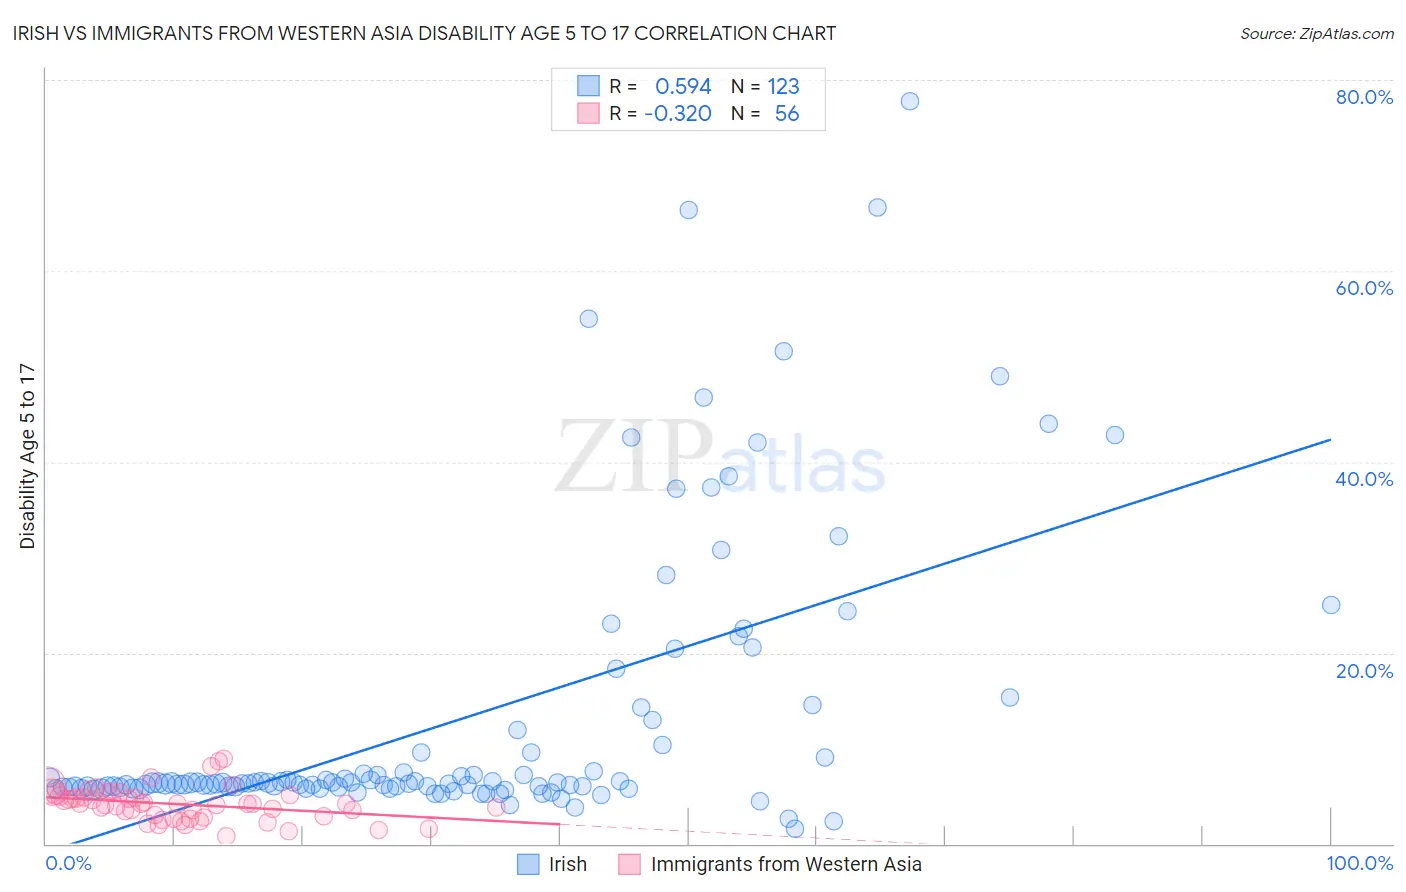
Irish vs Immigrants from Western Asia Disability Age 5 to 17 Correlation Chart
The statistical analysis conducted on geographies consisting of 563,958,915 people shows a substantial positive correlation between the proportion of Irish and percentage of population with a disability between the ages 5 and 17 in the United States with a correlation coefficient (R) of 0.594 and weighted average of 6.2%. Similarly, the statistical analysis conducted on geographies consisting of 400,987,262 people shows a mild negative correlation between the proportion of Immigrants from Western Asia and percentage of population with a disability between the ages 5 and 17 in the United States with a correlation coefficient (R) of -0.320 and weighted average of 5.1%, a difference of 22.7%.
Disability Age 5 to 17 Correlation Summary
| Measurement | Irish | Immigrants from Western Asia |
| Minimum | 1.5% | 0.84% |
| Maximum | 77.8% | 8.9% |
| Range | 76.2% | 8.1% |
| Mean | 13.0% | 4.2% |
| Median | 6.4% | 4.2% |
| Interquartile 25% (IQ1) | 5.9% | 2.8% |
| Interquartile 75% (IQ3) | 10.3% | 5.0% |
| Interquartile Range (IQR) | 4.4% | 2.2% |
| Standard Deviation (Sample) | 14.9% | 1.7% |
| Standard Deviation (Population) | 14.9% | 1.7% |
Similar Demographics by Disability Age 5 to 17
Demographics Similar to Irish by Disability Age 5 to 17
In terms of disability age 5 to 17, the demographic groups most similar to Irish are Central American Indian (6.2%, a difference of 0.0%), Immigrants from Senegal (6.2%, a difference of 0.020%), White/Caucasian (6.2%, a difference of 0.26%), Cree (6.2%, a difference of 0.27%), and Spanish American (6.2%, a difference of 0.30%).
| Demographics | Rating | Rank | Disability Age 5 to 17 |
| Pima | 0.0 /100 | #287 | Tragic 6.2% |
| Jamaicans | 0.0 /100 | #288 | Tragic 6.2% |
| Yaqui | 0.0 /100 | #289 | Tragic 6.2% |
| Immigrants | Congo | 0.0 /100 | #290 | Tragic 6.2% |
| Whites/Caucasians | 0.0 /100 | #291 | Tragic 6.2% |
| Immigrants | Senegal | 0.0 /100 | #292 | Tragic 6.2% |
| Central American Indians | 0.0 /100 | #293 | Tragic 6.2% |
| Irish | 0.0 /100 | #294 | Tragic 6.2% |
| Cree | 0.0 /100 | #295 | Tragic 6.2% |
| Spanish Americans | 0.0 /100 | #296 | Tragic 6.2% |
| Immigrants | Bahamas | 0.0 /100 | #297 | Tragic 6.2% |
| Lumbee | 0.0 /100 | #298 | Tragic 6.2% |
| Welsh | 0.0 /100 | #299 | Tragic 6.3% |
| Carpatho Rusyns | 0.0 /100 | #300 | Tragic 6.3% |
| U.S. Virgin Islanders | 0.0 /100 | #301 | Tragic 6.3% |
Demographics Similar to Immigrants from Western Asia by Disability Age 5 to 17
In terms of disability age 5 to 17, the demographic groups most similar to Immigrants from Western Asia are Korean (5.1%, a difference of 0.080%), Vietnamese (5.1%, a difference of 0.27%), Assyrian/Chaldean/Syriac (5.0%, a difference of 0.39%), Argentinean (5.1%, a difference of 0.41%), and Tongan (5.0%, a difference of 0.46%).
| Demographics | Rating | Rank | Disability Age 5 to 17 |
| Immigrants | Sri Lanka | 100.0 /100 | #42 | Exceptional 5.0% |
| Immigrants | Russia | 100.0 /100 | #43 | Exceptional 5.0% |
| Egyptians | 100.0 /100 | #44 | Exceptional 5.0% |
| Tongans | 100.0 /100 | #45 | Exceptional 5.0% |
| Assyrians/Chaldeans/Syriacs | 100.0 /100 | #46 | Exceptional 5.0% |
| Vietnamese | 100.0 /100 | #47 | Exceptional 5.1% |
| Koreans | 100.0 /100 | #48 | Exceptional 5.1% |
| Immigrants | Western Asia | 100.0 /100 | #49 | Exceptional 5.1% |
| Argentineans | 99.9 /100 | #50 | Exceptional 5.1% |
| Turks | 99.9 /100 | #51 | Exceptional 5.1% |
| Immigrants | Fiji | 99.9 /100 | #52 | Exceptional 5.1% |
| Immigrants | Lithuania | 99.9 /100 | #53 | Exceptional 5.1% |
| Paraguayans | 99.9 /100 | #54 | Exceptional 5.1% |
| Laotians | 99.9 /100 | #55 | Exceptional 5.1% |
| Immigrants | Turkey | 99.9 /100 | #56 | Exceptional 5.1% |