Irish vs Israeli Disability Age 5 to 17
COMPARE
Irish
Israeli
Disability Age 5 to 17
Disability Age 5 to 17 Comparison
Irish
Israelis
6.2%
DISABILITY AGE 5 TO 17
0.0/ 100
METRIC RATING
294th/ 347
METRIC RANK
5.0%
DISABILITY AGE 5 TO 17
100.0/ 100
METRIC RATING
34th/ 347
METRIC RANK
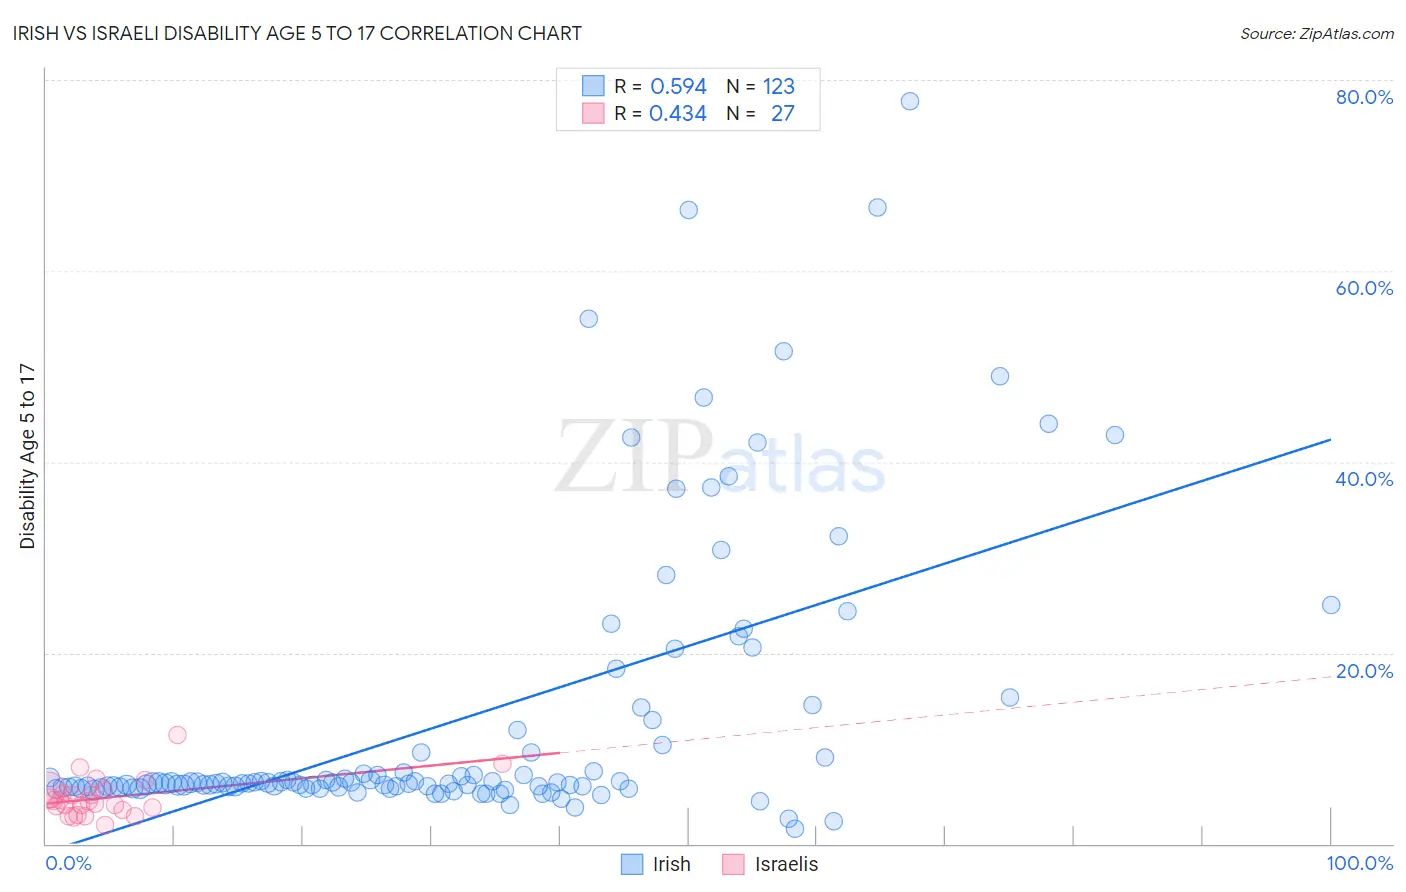
Irish vs Israeli Disability Age 5 to 17 Correlation Chart
The statistical analysis conducted on geographies consisting of 563,958,915 people shows a substantial positive correlation between the proportion of Irish and percentage of population with a disability between the ages 5 and 17 in the United States with a correlation coefficient (R) of 0.594 and weighted average of 6.2%. Similarly, the statistical analysis conducted on geographies consisting of 209,817,716 people shows a moderate positive correlation between the proportion of Israelis and percentage of population with a disability between the ages 5 and 17 in the United States with a correlation coefficient (R) of 0.434 and weighted average of 5.0%, a difference of 24.5%.
Disability Age 5 to 17 Correlation Summary
| Measurement | Irish | Israeli |
| Minimum | 1.5% | 2.0% |
| Maximum | 77.8% | 11.4% |
| Range | 76.2% | 9.5% |
| Mean | 13.0% | 4.8% |
| Median | 6.4% | 4.5% |
| Interquartile 25% (IQ1) | 5.9% | 3.5% |
| Interquartile 75% (IQ3) | 10.3% | 5.7% |
| Interquartile Range (IQR) | 4.4% | 2.1% |
| Standard Deviation (Sample) | 14.9% | 2.0% |
| Standard Deviation (Population) | 14.9% | 2.0% |
Similar Demographics by Disability Age 5 to 17
Demographics Similar to Irish by Disability Age 5 to 17
In terms of disability age 5 to 17, the demographic groups most similar to Irish are Central American Indian (6.2%, a difference of 0.0%), Immigrants from Senegal (6.2%, a difference of 0.020%), White/Caucasian (6.2%, a difference of 0.26%), Cree (6.2%, a difference of 0.27%), and Spanish American (6.2%, a difference of 0.30%).
| Demographics | Rating | Rank | Disability Age 5 to 17 |
| Pima | 0.0 /100 | #287 | Tragic 6.2% |
| Jamaicans | 0.0 /100 | #288 | Tragic 6.2% |
| Yaqui | 0.0 /100 | #289 | Tragic 6.2% |
| Immigrants | Congo | 0.0 /100 | #290 | Tragic 6.2% |
| Whites/Caucasians | 0.0 /100 | #291 | Tragic 6.2% |
| Immigrants | Senegal | 0.0 /100 | #292 | Tragic 6.2% |
| Central American Indians | 0.0 /100 | #293 | Tragic 6.2% |
| Irish | 0.0 /100 | #294 | Tragic 6.2% |
| Cree | 0.0 /100 | #295 | Tragic 6.2% |
| Spanish Americans | 0.0 /100 | #296 | Tragic 6.2% |
| Immigrants | Bahamas | 0.0 /100 | #297 | Tragic 6.2% |
| Lumbee | 0.0 /100 | #298 | Tragic 6.2% |
| Welsh | 0.0 /100 | #299 | Tragic 6.3% |
| Carpatho Rusyns | 0.0 /100 | #300 | Tragic 6.3% |
| U.S. Virgin Islanders | 0.0 /100 | #301 | Tragic 6.3% |
Demographics Similar to Israelis by Disability Age 5 to 17
In terms of disability age 5 to 17, the demographic groups most similar to Israelis are Immigrants from Indonesia (5.0%, a difference of 0.12%), Bolivian (5.0%, a difference of 0.19%), Immigrants from Egypt (5.0%, a difference of 0.23%), Immigrants from Belarus (5.0%, a difference of 0.26%), and Immigrants from Philippines (5.0%, a difference of 0.30%).
| Demographics | Rating | Rank | Disability Age 5 to 17 |
| Taiwanese | 100.0 /100 | #27 | Exceptional 4.9% |
| Immigrants | Japan | 100.0 /100 | #28 | Exceptional 4.9% |
| Immigrants | Serbia | 100.0 /100 | #29 | Exceptional 4.9% |
| Immigrants | Malaysia | 100.0 /100 | #30 | Exceptional 5.0% |
| Immigrants | Pakistan | 100.0 /100 | #31 | Exceptional 5.0% |
| Soviet Union | 100.0 /100 | #32 | Exceptional 5.0% |
| Immigrants | Indonesia | 100.0 /100 | #33 | Exceptional 5.0% |
| Israelis | 100.0 /100 | #34 | Exceptional 5.0% |
| Bolivians | 100.0 /100 | #35 | Exceptional 5.0% |
| Immigrants | Egypt | 100.0 /100 | #36 | Exceptional 5.0% |
| Immigrants | Belarus | 100.0 /100 | #37 | Exceptional 5.0% |
| Immigrants | Philippines | 100.0 /100 | #38 | Exceptional 5.0% |
| Immigrants | Argentina | 100.0 /100 | #39 | Exceptional 5.0% |
| Okinawans | 100.0 /100 | #40 | Exceptional 5.0% |
| Immigrants | Australia | 100.0 /100 | #41 | Exceptional 5.0% |