Irish vs Ottawa Disability Age 5 to 17
COMPARE
Irish
Ottawa
Disability Age 5 to 17
Disability Age 5 to 17 Comparison
Irish
Ottawa
6.2%
DISABILITY AGE 5 TO 17
0.0/ 100
METRIC RATING
294th/ 347
METRIC RANK
6.8%
DISABILITY AGE 5 TO 17
0.0/ 100
METRIC RATING
335th/ 347
METRIC RANK
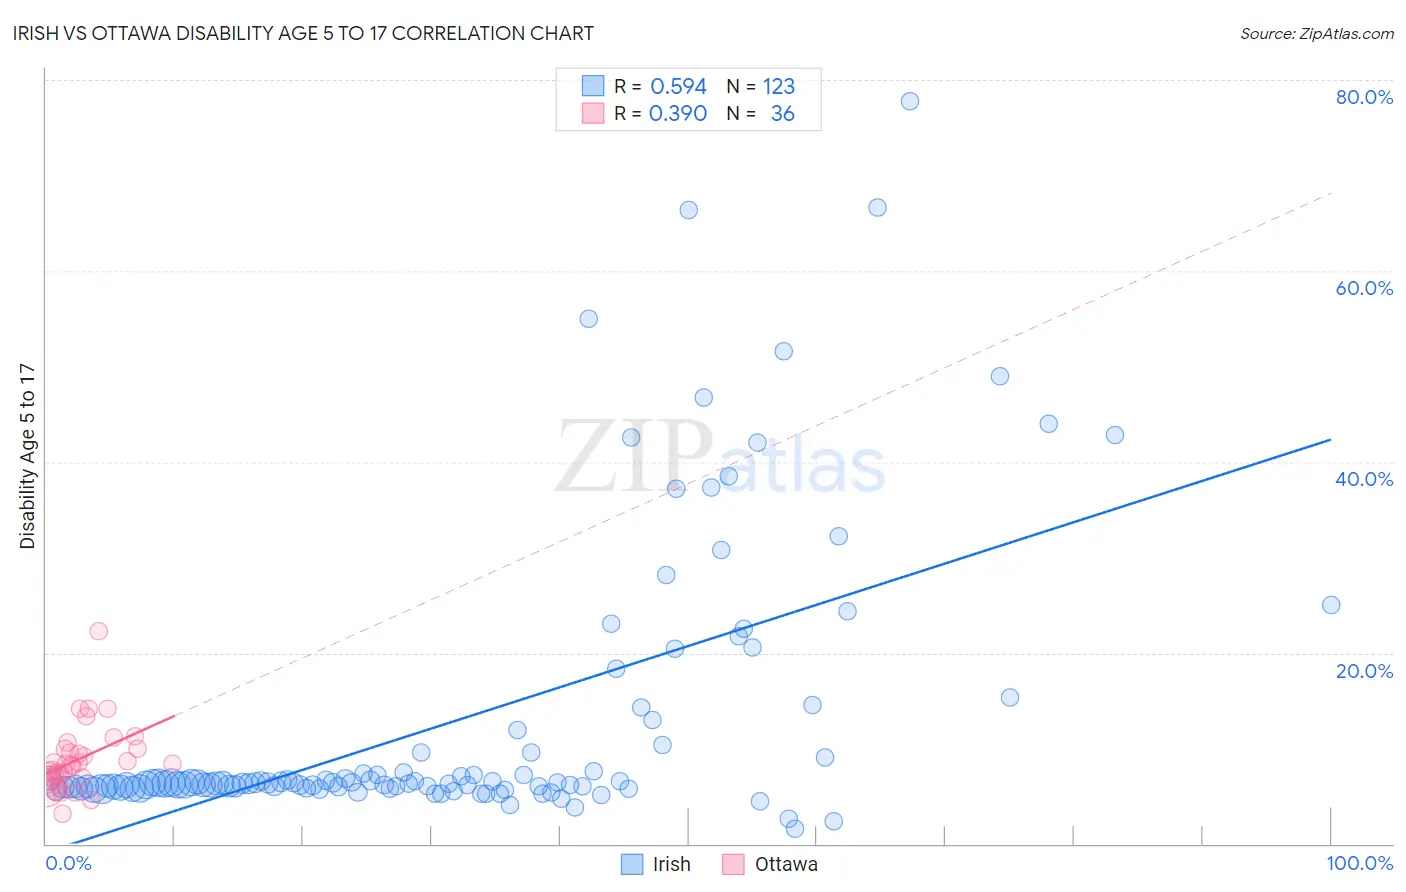
Irish vs Ottawa Disability Age 5 to 17 Correlation Chart
The statistical analysis conducted on geographies consisting of 563,958,915 people shows a substantial positive correlation between the proportion of Irish and percentage of population with a disability between the ages 5 and 17 in the United States with a correlation coefficient (R) of 0.594 and weighted average of 6.2%. Similarly, the statistical analysis conducted on geographies consisting of 49,831,425 people shows a mild positive correlation between the proportion of Ottawa and percentage of population with a disability between the ages 5 and 17 in the United States with a correlation coefficient (R) of 0.390 and weighted average of 6.8%, a difference of 9.5%.
Disability Age 5 to 17 Correlation Summary
| Measurement | Irish | Ottawa |
| Minimum | 1.5% | 3.1% |
| Maximum | 77.8% | 22.2% |
| Range | 76.2% | 19.1% |
| Mean | 13.0% | 8.8% |
| Median | 6.4% | 8.3% |
| Interquartile 25% (IQ1) | 5.9% | 6.9% |
| Interquartile 75% (IQ3) | 10.3% | 10.0% |
| Interquartile Range (IQR) | 4.4% | 3.1% |
| Standard Deviation (Sample) | 14.9% | 3.5% |
| Standard Deviation (Population) | 14.9% | 3.5% |
Similar Demographics by Disability Age 5 to 17
Demographics Similar to Irish by Disability Age 5 to 17
In terms of disability age 5 to 17, the demographic groups most similar to Irish are Central American Indian (6.2%, a difference of 0.0%), Immigrants from Senegal (6.2%, a difference of 0.020%), White/Caucasian (6.2%, a difference of 0.26%), Cree (6.2%, a difference of 0.27%), and Spanish American (6.2%, a difference of 0.30%).
| Demographics | Rating | Rank | Disability Age 5 to 17 |
| Pima | 0.0 /100 | #287 | Tragic 6.2% |
| Jamaicans | 0.0 /100 | #288 | Tragic 6.2% |
| Yaqui | 0.0 /100 | #289 | Tragic 6.2% |
| Immigrants | Congo | 0.0 /100 | #290 | Tragic 6.2% |
| Whites/Caucasians | 0.0 /100 | #291 | Tragic 6.2% |
| Immigrants | Senegal | 0.0 /100 | #292 | Tragic 6.2% |
| Central American Indians | 0.0 /100 | #293 | Tragic 6.2% |
| Irish | 0.0 /100 | #294 | Tragic 6.2% |
| Cree | 0.0 /100 | #295 | Tragic 6.2% |
| Spanish Americans | 0.0 /100 | #296 | Tragic 6.2% |
| Immigrants | Bahamas | 0.0 /100 | #297 | Tragic 6.2% |
| Lumbee | 0.0 /100 | #298 | Tragic 6.2% |
| Welsh | 0.0 /100 | #299 | Tragic 6.3% |
| Carpatho Rusyns | 0.0 /100 | #300 | Tragic 6.3% |
| U.S. Virgin Islanders | 0.0 /100 | #301 | Tragic 6.3% |
Demographics Similar to Ottawa by Disability Age 5 to 17
In terms of disability age 5 to 17, the demographic groups most similar to Ottawa are Chickasaw (6.8%, a difference of 0.50%), Seminole (6.8%, a difference of 0.70%), Black/African American (6.8%, a difference of 0.75%), Creek (6.9%, a difference of 0.93%), and Iroquois (6.9%, a difference of 1.2%).
| Demographics | Rating | Rank | Disability Age 5 to 17 |
| Pennsylvania Germans | 0.0 /100 | #328 | Tragic 6.6% |
| Blackfeet | 0.0 /100 | #329 | Tragic 6.6% |
| Dutch West Indians | 0.0 /100 | #330 | Tragic 6.7% |
| French Canadians | 0.0 /100 | #331 | Tragic 6.7% |
| Immigrants | Azores | 0.0 /100 | #332 | Tragic 6.7% |
| Blacks/African Americans | 0.0 /100 | #333 | Tragic 6.8% |
| Seminole | 0.0 /100 | #334 | Tragic 6.8% |
| Ottawa | 0.0 /100 | #335 | Tragic 6.8% |
| Chickasaw | 0.0 /100 | #336 | Tragic 6.8% |
| Creek | 0.0 /100 | #337 | Tragic 6.9% |
| Iroquois | 0.0 /100 | #338 | Tragic 6.9% |
| Choctaw | 0.0 /100 | #339 | Tragic 6.9% |
| Cherokee | 0.0 /100 | #340 | Tragic 6.9% |
| Cape Verdeans | 0.0 /100 | #341 | Tragic 7.0% |
| Chippewa | 0.0 /100 | #342 | Tragic 7.1% |