Irish vs Immigrants from Kuwait Disability Age 5 to 17
COMPARE
Irish
Immigrants from Kuwait
Disability Age 5 to 17
Disability Age 5 to 17 Comparison
Irish
Immigrants from Kuwait
6.2%
DISABILITY AGE 5 TO 17
0.0/ 100
METRIC RATING
294th/ 347
METRIC RANK
5.3%
DISABILITY AGE 5 TO 17
99.4/ 100
METRIC RATING
90th/ 347
METRIC RANK
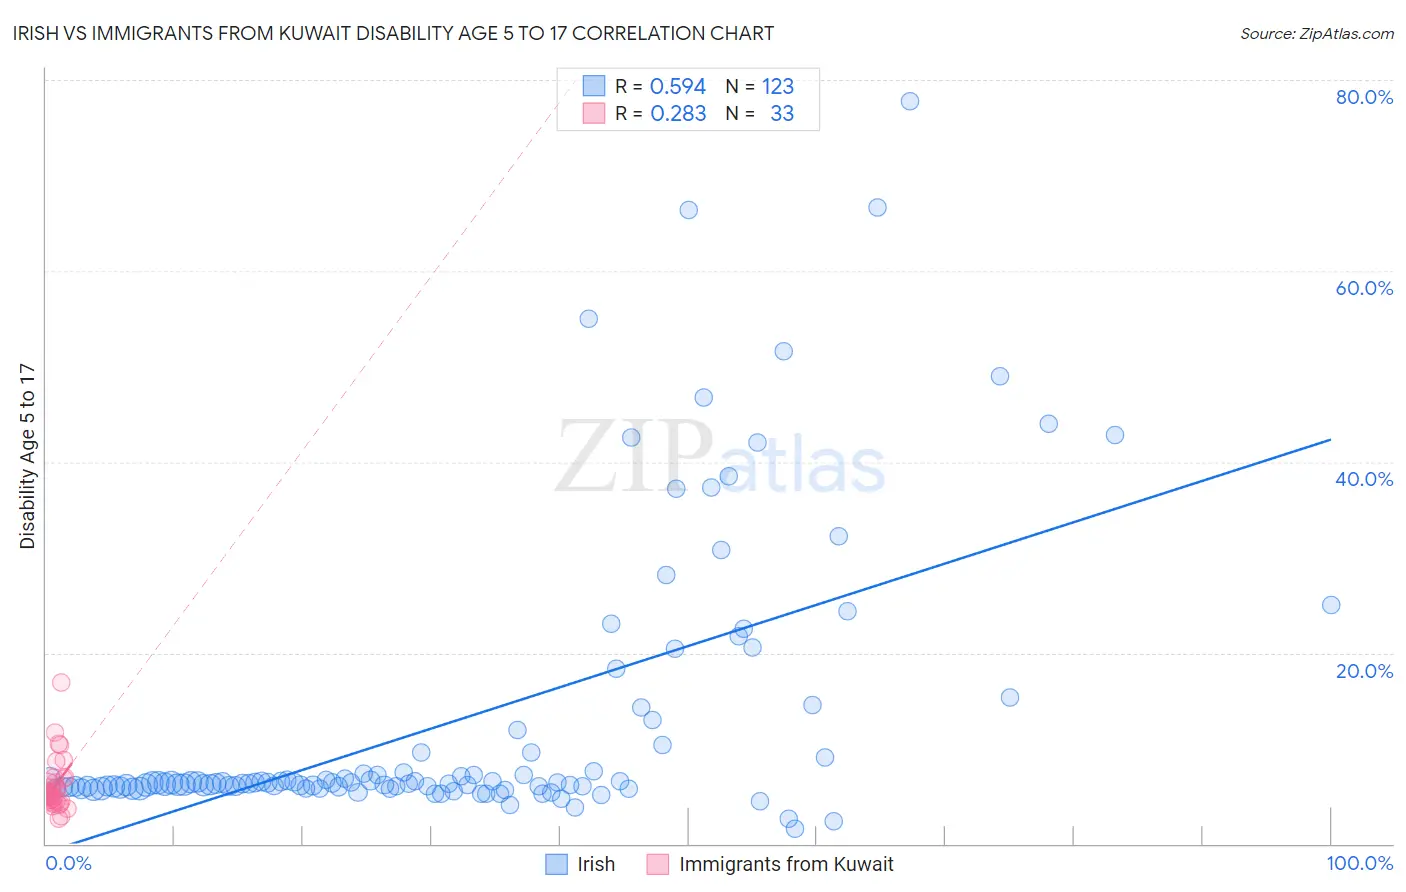
Irish vs Immigrants from Kuwait Disability Age 5 to 17 Correlation Chart
The statistical analysis conducted on geographies consisting of 563,958,915 people shows a substantial positive correlation between the proportion of Irish and percentage of population with a disability between the ages 5 and 17 in the United States with a correlation coefficient (R) of 0.594 and weighted average of 6.2%. Similarly, the statistical analysis conducted on geographies consisting of 136,559,233 people shows a weak positive correlation between the proportion of Immigrants from Kuwait and percentage of population with a disability between the ages 5 and 17 in the United States with a correlation coefficient (R) of 0.283 and weighted average of 5.3%, a difference of 18.4%.
Disability Age 5 to 17 Correlation Summary
| Measurement | Irish | Immigrants from Kuwait |
| Minimum | 1.5% | 2.7% |
| Maximum | 77.8% | 16.9% |
| Range | 76.2% | 14.3% |
| Mean | 13.0% | 6.1% |
| Median | 6.4% | 5.2% |
| Interquartile 25% (IQ1) | 5.9% | 4.4% |
| Interquartile 75% (IQ3) | 10.3% | 6.9% |
| Interquartile Range (IQR) | 4.4% | 2.5% |
| Standard Deviation (Sample) | 14.9% | 2.9% |
| Standard Deviation (Population) | 14.9% | 2.8% |
Similar Demographics by Disability Age 5 to 17
Demographics Similar to Irish by Disability Age 5 to 17
In terms of disability age 5 to 17, the demographic groups most similar to Irish are Central American Indian (6.2%, a difference of 0.0%), Immigrants from Senegal (6.2%, a difference of 0.020%), White/Caucasian (6.2%, a difference of 0.26%), Cree (6.2%, a difference of 0.27%), and Spanish American (6.2%, a difference of 0.30%).
| Demographics | Rating | Rank | Disability Age 5 to 17 |
| Pima | 0.0 /100 | #287 | Tragic 6.2% |
| Jamaicans | 0.0 /100 | #288 | Tragic 6.2% |
| Yaqui | 0.0 /100 | #289 | Tragic 6.2% |
| Immigrants | Congo | 0.0 /100 | #290 | Tragic 6.2% |
| Whites/Caucasians | 0.0 /100 | #291 | Tragic 6.2% |
| Immigrants | Senegal | 0.0 /100 | #292 | Tragic 6.2% |
| Central American Indians | 0.0 /100 | #293 | Tragic 6.2% |
| Irish | 0.0 /100 | #294 | Tragic 6.2% |
| Cree | 0.0 /100 | #295 | Tragic 6.2% |
| Spanish Americans | 0.0 /100 | #296 | Tragic 6.2% |
| Immigrants | Bahamas | 0.0 /100 | #297 | Tragic 6.2% |
| Lumbee | 0.0 /100 | #298 | Tragic 6.2% |
| Welsh | 0.0 /100 | #299 | Tragic 6.3% |
| Carpatho Rusyns | 0.0 /100 | #300 | Tragic 6.3% |
| U.S. Virgin Islanders | 0.0 /100 | #301 | Tragic 6.3% |
Demographics Similar to Immigrants from Kuwait by Disability Age 5 to 17
In terms of disability age 5 to 17, the demographic groups most similar to Immigrants from Kuwait are Immigrants from Croatia (5.2%, a difference of 0.050%), Immigrants from Spain (5.2%, a difference of 0.050%), Eastern European (5.2%, a difference of 0.080%), Immigrants from St. Vincent and the Grenadines (5.2%, a difference of 0.13%), and Bulgarian (5.2%, a difference of 0.17%).
| Demographics | Rating | Rank | Disability Age 5 to 17 |
| Immigrants | France | 99.5 /100 | #83 | Exceptional 5.2% |
| Immigrants | Nicaragua | 99.5 /100 | #84 | Exceptional 5.2% |
| Bulgarians | 99.4 /100 | #85 | Exceptional 5.2% |
| Immigrants | St. Vincent and the Grenadines | 99.4 /100 | #86 | Exceptional 5.2% |
| Eastern Europeans | 99.4 /100 | #87 | Exceptional 5.2% |
| Immigrants | Croatia | 99.4 /100 | #88 | Exceptional 5.2% |
| Immigrants | Spain | 99.4 /100 | #89 | Exceptional 5.2% |
| Immigrants | Kuwait | 99.4 /100 | #90 | Exceptional 5.3% |
| Mongolians | 99.2 /100 | #91 | Exceptional 5.3% |
| Luxembourgers | 99.2 /100 | #92 | Exceptional 5.3% |
| Immigrants | Peru | 99.1 /100 | #93 | Exceptional 5.3% |
| Immigrants | Jordan | 99.1 /100 | #94 | Exceptional 5.3% |
| Immigrants | Grenada | 99.1 /100 | #95 | Exceptional 5.3% |
| Immigrants | El Salvador | 99.0 /100 | #96 | Exceptional 5.3% |
| Immigrants | Europe | 99.0 /100 | #97 | Exceptional 5.3% |