Guamanian/Chamorro Self-Care Disability
COMPARE
Guamanian/Chamorro
Select to Compare
Self-Care Disability
Guamanian/Chamorro Self-Care Disability
2.6%
SELF-CARE DISABILITY
2.5/ 100
METRIC RATING
229th/ 347
METRIC RANK
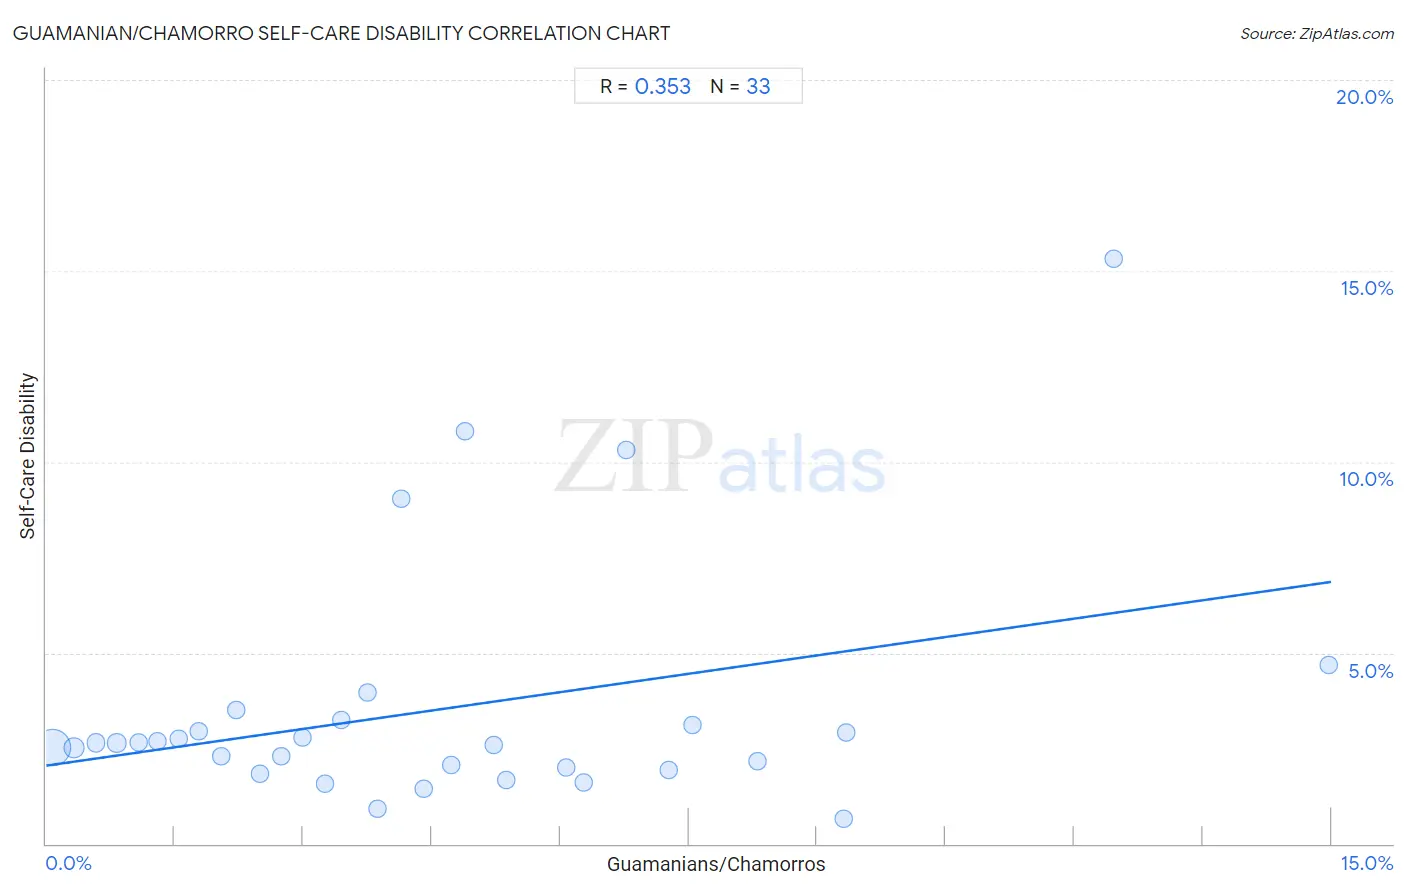
Guamanian/Chamorro Self-Care Disability Correlation Chart
The statistical analysis conducted on geographies consisting of 221,730,163 people shows a mild positive correlation between the proportion of Guamanians/Chamorros and percentage of population with self-care disability in the United States with a correlation coefficient (R) of 0.353 and weighted average of 2.6%. On average, for every 1% (one percent) increase in Guamanians/Chamorros within a typical geography, there is an increase of 0.32% in percentage of population with self-care disability.
It is essential to understand that the correlation between the percentage of Guamanians/Chamorros and percentage of population with self-care disability does not imply a direct cause-and-effect relationship. It remains uncertain whether the presence of Guamanians/Chamorros influences an upward or downward trend in the level of percentage of population with self-care disability within an area, or if Guamanians/Chamorros simply ended up residing in those areas with higher or lower levels of percentage of population with self-care disability due to other factors.
Demographics Similar to Guamanians/Chamorros by Self-Care Disability
In terms of self-care disability, the demographic groups most similar to Guamanians/Chamorros are Immigrants from Ecuador (2.6%, a difference of 0.010%), Guatemalan (2.6%, a difference of 0.070%), Immigrants from Philippines (2.6%, a difference of 0.080%), Immigrants from Guatemala (2.6%, a difference of 0.15%), and Chinese (2.6%, a difference of 0.16%).
| Demographics | Rating | Rank | Self-Care Disability |
| Spaniards | 3.8 /100 | #222 | Tragic 2.6% |
| French Canadians | 3.8 /100 | #223 | Tragic 2.6% |
| Osage | 3.6 /100 | #224 | Tragic 2.6% |
| Iraqis | 3.2 /100 | #225 | Tragic 2.6% |
| Chinese | 2.9 /100 | #226 | Tragic 2.6% |
| Immigrants from Philippines | 2.7 /100 | #227 | Tragic 2.6% |
| Guatemalans | 2.7 /100 | #228 | Tragic 2.6% |
| Guamanians/Chamorros | 2.5 /100 | #229 | Tragic 2.6% |
| Immigrants from Ecuador | 2.5 /100 | #230 | Tragic 2.6% |
| Immigrants from Guatemala | 2.2 /100 | #231 | Tragic 2.6% |
| Albanians | 2.2 /100 | #232 | Tragic 2.6% |
| Liberians | 2.1 /100 | #233 | Tragic 2.6% |
| Vietnamese | 2.1 /100 | #234 | Tragic 2.6% |
| Bahamians | 2.0 /100 | #235 | Tragic 2.6% |
| Bermudans | 1.9 /100 | #236 | Tragic 2.6% |
Guamanian/Chamorro Self-Care Disability Correlation Summary
| Measurement | Guamanian/Chamorro Data | Self-Care Disability Data |
| Minimum | 0.066% | 0.65% |
| Maximum | 15.0% | 15.3% |
| Range | 14.9% | 14.7% |
| Mean | 4.6% | 3.5% |
| Median | 3.9% | 2.6% |
| Interquartile 25% (IQ1) | 1.9% | 2.0% |
| Interquartile 75% (IQ3) | 6.5% | 3.2% |
| Interquartile Range (IQR) | 4.6% | 1.2% |
| Standard Deviation (Sample) | 3.5% | 3.2% |
| Standard Deviation (Population) | 3.4% | 3.1% |
Correlation Details
| Guamanian/Chamorro Percentile | Sample Size | Self-Care Disability |
[ 0.0% - 0.5% ] 0.066% | 190,814,290 | 2.5% |
[ 0.0% - 0.5% ] 0.33% | 20,019,406 | 2.5% |
[ 0.5% - 1.0% ] 0.58% | 5,581,976 | 2.6% |
[ 0.5% - 1.0% ] 0.82% | 2,545,791 | 2.6% |
[ 1.0% - 1.5% ] 1.08% | 1,251,150 | 2.7% |
[ 1.0% - 1.5% ] 1.30% | 464,342 | 2.7% |
[ 1.5% - 2.0% ] 1.54% | 407,187 | 2.8% |
[ 1.5% - 2.0% ] 1.78% | 203,350 | 2.9% |
[ 2.0% - 2.5% ] 2.04% | 133,851 | 2.3% |
[ 2.0% - 2.5% ] 2.22% | 66,350 | 3.5% |
[ 2.0% - 2.5% ] 2.49% | 48,937 | 1.8% |
[ 2.5% - 3.0% ] 2.74% | 24,329 | 2.3% |
[ 2.5% - 3.0% ] 2.99% | 24,060 | 2.8% |
[ 3.0% - 3.5% ] 3.26% | 27,988 | 1.6% |
[ 3.0% - 3.5% ] 3.45% | 45,984 | 3.2% |
[ 3.5% - 4.0% ] 3.75% | 9,680 | 3.9% |
[ 3.5% - 4.0% ] 3.87% | 4,243 | 0.92% |
[ 4.0% - 4.5% ] 4.15% | 5,014 | 9.0% |
[ 4.0% - 4.5% ] 4.40% | 5,199 | 1.5% |
[ 4.5% - 5.0% ] 4.72% | 24,854 | 2.1% |
[ 4.5% - 5.0% ] 4.88% | 3,748 | 10.8% |
[ 5.0% - 5.5% ] 5.23% | 1,606 | 2.6% |
[ 5.0% - 5.5% ] 5.38% | 186 | 1.7% |
[ 6.0% - 6.5% ] 6.07% | 4,758 | 2.0% |
[ 6.0% - 6.5% ] 6.27% | 1,611 | 1.6% |
[ 6.5% - 7.0% ] 6.77% | 1,388 | 10.3% |
[ 7.0% - 7.5% ] 7.27% | 1,211 | 1.9% |
[ 7.5% - 8.0% ] 7.55% | 1,669 | 3.1% |
[ 8.0% - 8.5% ] 8.30% | 4,648 | 2.2% |
[ 9.0% - 9.5% ] 9.30% | 172 | 0.65% |
[ 9.0% - 9.5% ] 9.34% | 578 | 2.9% |
[ 12.0% - 12.5% ] 12.46% | 313 | 15.3% |
[ 14.5% - 15.0% ] 14.97% | 294 | 4.7% |