Guamanian/Chamorro vs American Self-Care Disability
COMPARE
Guamanian/Chamorro
American
Self-Care Disability
Self-Care Disability Comparison
Guamanians/Chamorros
Americans
2.6%
SELF-CARE DISABILITY
2.5/ 100
METRIC RATING
229th/ 347
METRIC RANK
2.8%
SELF-CARE DISABILITY
0.0/ 100
METRIC RATING
298th/ 347
METRIC RANK
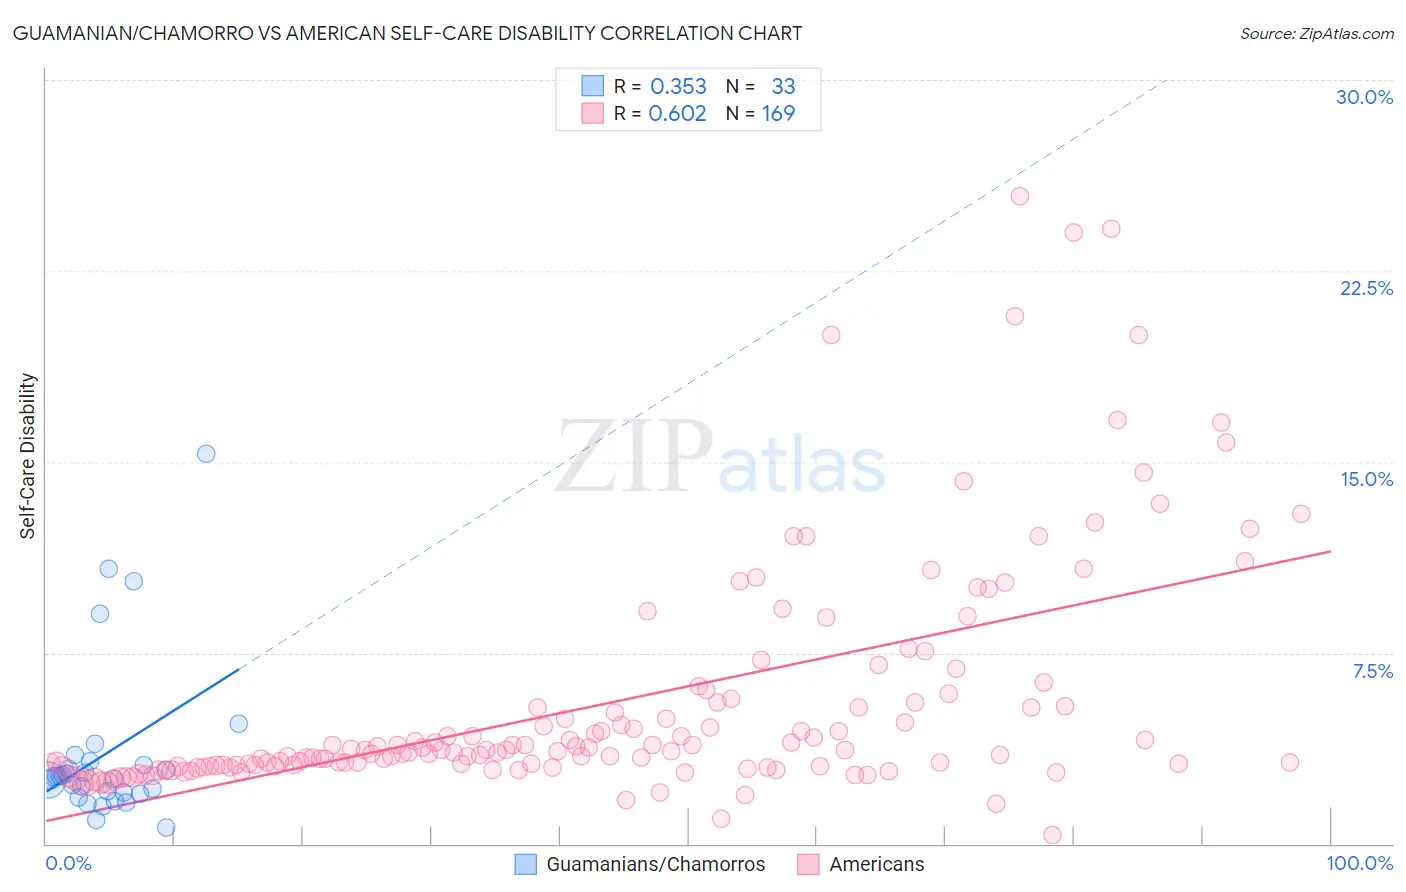
Guamanian/Chamorro vs American Self-Care Disability Correlation Chart
The statistical analysis conducted on geographies consisting of 221,730,163 people shows a mild positive correlation between the proportion of Guamanians/Chamorros and percentage of population with self-care disability in the United States with a correlation coefficient (R) of 0.353 and weighted average of 2.6%. Similarly, the statistical analysis conducted on geographies consisting of 579,144,180 people shows a significant positive correlation between the proportion of Americans and percentage of population with self-care disability in the United States with a correlation coefficient (R) of 0.602 and weighted average of 2.8%, a difference of 7.4%.
Self-Care Disability Correlation Summary
| Measurement | Guamanian/Chamorro | American |
| Minimum | 0.65% | 0.36% |
| Maximum | 15.3% | 25.5% |
| Range | 14.7% | 25.1% |
| Mean | 3.5% | 5.5% |
| Median | 2.6% | 3.6% |
| Interquartile 25% (IQ1) | 2.0% | 3.0% |
| Interquartile 75% (IQ3) | 3.2% | 5.5% |
| Interquartile Range (IQR) | 1.2% | 2.5% |
| Standard Deviation (Sample) | 3.2% | 4.6% |
| Standard Deviation (Population) | 3.1% | 4.6% |
Similar Demographics by Self-Care Disability
Demographics Similar to Guamanians/Chamorros by Self-Care Disability
In terms of self-care disability, the demographic groups most similar to Guamanians/Chamorros are Immigrants from Ecuador (2.6%, a difference of 0.010%), Guatemalan (2.6%, a difference of 0.070%), Immigrants from Philippines (2.6%, a difference of 0.080%), Immigrants from Guatemala (2.6%, a difference of 0.15%), and Chinese (2.6%, a difference of 0.16%).
| Demographics | Rating | Rank | Self-Care Disability |
| Spaniards | 3.8 /100 | #222 | Tragic 2.6% |
| French Canadians | 3.8 /100 | #223 | Tragic 2.6% |
| Osage | 3.6 /100 | #224 | Tragic 2.6% |
| Iraqis | 3.2 /100 | #225 | Tragic 2.6% |
| Chinese | 2.9 /100 | #226 | Tragic 2.6% |
| Immigrants | Philippines | 2.7 /100 | #227 | Tragic 2.6% |
| Guatemalans | 2.7 /100 | #228 | Tragic 2.6% |
| Guamanians/Chamorros | 2.5 /100 | #229 | Tragic 2.6% |
| Immigrants | Ecuador | 2.5 /100 | #230 | Tragic 2.6% |
| Immigrants | Guatemala | 2.2 /100 | #231 | Tragic 2.6% |
| Albanians | 2.2 /100 | #232 | Tragic 2.6% |
| Liberians | 2.1 /100 | #233 | Tragic 2.6% |
| Vietnamese | 2.1 /100 | #234 | Tragic 2.6% |
| Bahamians | 2.0 /100 | #235 | Tragic 2.6% |
| Bermudans | 1.9 /100 | #236 | Tragic 2.6% |
Demographics Similar to Americans by Self-Care Disability
In terms of self-care disability, the demographic groups most similar to Americans are Immigrants from Guyana (2.8%, a difference of 0.090%), West Indian (2.8%, a difference of 0.12%), Immigrants from Portugal (2.8%, a difference of 0.20%), Immigrants from Fiji (2.8%, a difference of 0.56%), and Barbadian (2.7%, a difference of 0.63%).
| Demographics | Rating | Rank | Self-Care Disability |
| Guyanese | 0.0 /100 | #291 | Tragic 2.7% |
| Central American Indians | 0.0 /100 | #292 | Tragic 2.7% |
| Belizeans | 0.0 /100 | #293 | Tragic 2.7% |
| Blackfeet | 0.0 /100 | #294 | Tragic 2.7% |
| Barbadians | 0.0 /100 | #295 | Tragic 2.7% |
| Immigrants | Portugal | 0.0 /100 | #296 | Tragic 2.8% |
| West Indians | 0.0 /100 | #297 | Tragic 2.8% |
| Americans | 0.0 /100 | #298 | Tragic 2.8% |
| Immigrants | Guyana | 0.0 /100 | #299 | Tragic 2.8% |
| Immigrants | Fiji | 0.0 /100 | #300 | Tragic 2.8% |
| Pima | 0.0 /100 | #301 | Tragic 2.8% |
| Immigrants | St. Vincent and the Grenadines | 0.0 /100 | #302 | Tragic 2.8% |
| Immigrants | Belize | 0.0 /100 | #303 | Tragic 2.8% |
| Cree | 0.0 /100 | #304 | Tragic 2.8% |
| Immigrants | West Indies | 0.0 /100 | #305 | Tragic 2.8% |