Hungarian Self-Care Disability
COMPARE
Hungarian
Select to Compare
Self-Care Disability
Hungarian Self-Care Disability
2.5%
SELF-CARE DISABILITY
45.5/ 100
METRIC RATING
179th/ 347
METRIC RANK
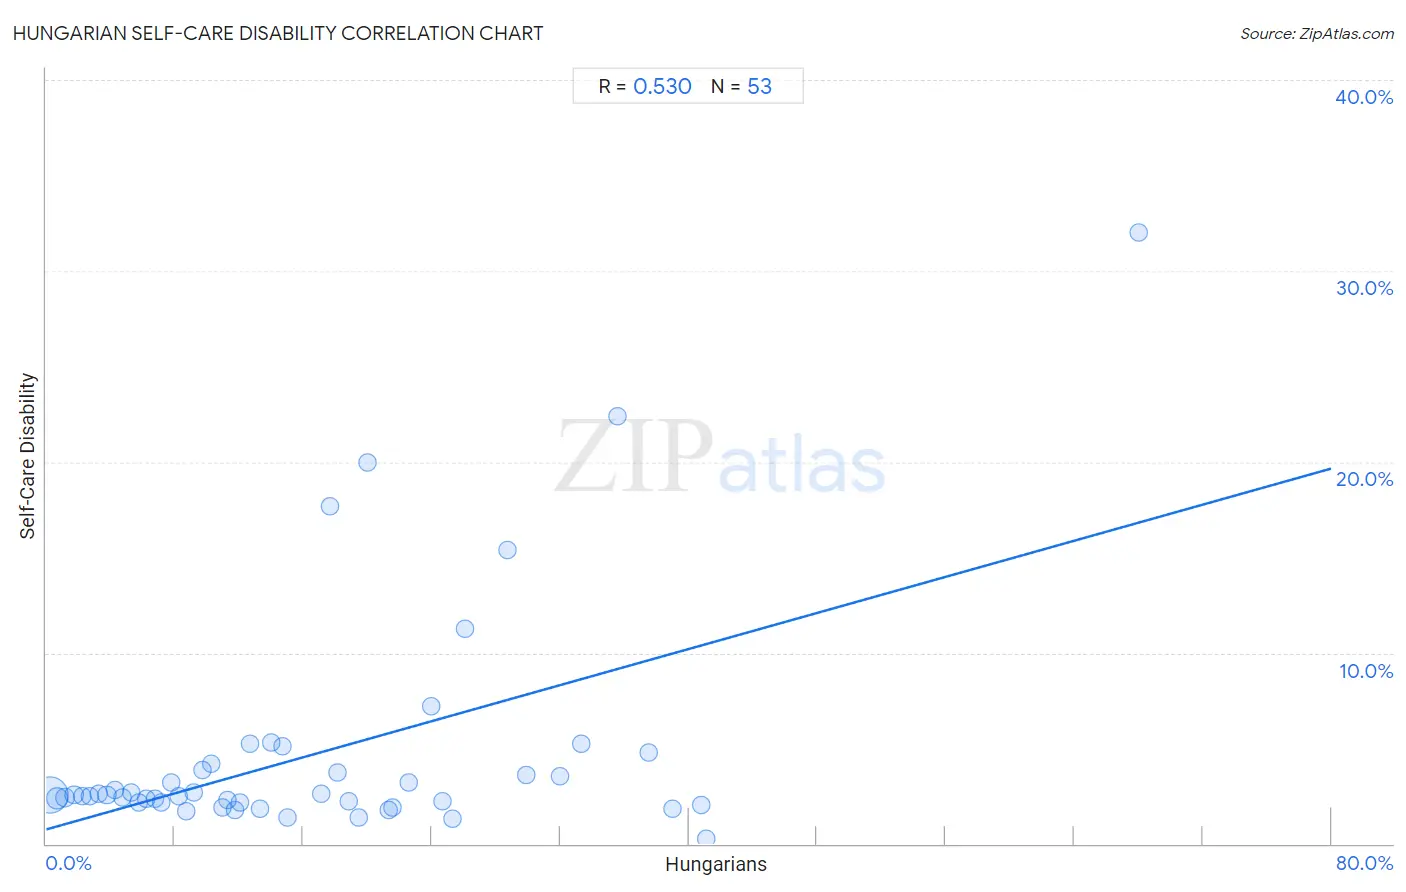
Hungarian Self-Care Disability Correlation Chart
The statistical analysis conducted on geographies consisting of 485,258,327 people shows a substantial positive correlation between the proportion of Hungarians and percentage of population with self-care disability in the United States with a correlation coefficient (R) of 0.530 and weighted average of 2.5%. On average, for every 1% (one percent) increase in Hungarians within a typical geography, there is an increase of 0.24% in percentage of population with self-care disability.
It is essential to understand that the correlation between the percentage of Hungarians and percentage of population with self-care disability does not imply a direct cause-and-effect relationship. It remains uncertain whether the presence of Hungarians influences an upward or downward trend in the level of percentage of population with self-care disability within an area, or if Hungarians simply ended up residing in those areas with higher or lower levels of percentage of population with self-care disability due to other factors.
Demographics Similar to Hungarians by Self-Care Disability
In terms of self-care disability, the demographic groups most similar to Hungarians are English (2.5%, a difference of 0.030%), Immigrants from Kazakhstan (2.5%, a difference of 0.060%), Immigrants from Afghanistan (2.5%, a difference of 0.10%), Immigrants from Bosnia and Herzegovina (2.5%, a difference of 0.20%), and Indonesian (2.5%, a difference of 0.21%).
| Demographics | Rating | Rank | Self-Care Disability |
| Czechoslovakians | 53.5 /100 | #172 | Average 2.5% |
| Immigrants from Burma/Myanmar | 52.8 /100 | #173 | Average 2.5% |
| Welsh | 50.0 /100 | #174 | Average 2.5% |
| Immigrants from Bosnia and Herzegovina | 49.6 /100 | #175 | Average 2.5% |
| Immigrants from Afghanistan | 47.6 /100 | #176 | Average 2.5% |
| Immigrants from Kazakhstan | 46.7 /100 | #177 | Average 2.5% |
| English | 46.2 /100 | #178 | Average 2.5% |
| Hungarians | 45.5 /100 | #179 | Average 2.5% |
| Indonesians | 41.2 /100 | #180 | Average 2.5% |
| Ghanaians | 40.4 /100 | #181 | Average 2.5% |
| Maltese | 37.5 /100 | #182 | Fair 2.5% |
| Salvadorans | 36.4 /100 | #183 | Fair 2.5% |
| Yugoslavians | 36.1 /100 | #184 | Fair 2.5% |
| Slavs | 34.3 /100 | #185 | Fair 2.5% |
| Immigrants from El Salvador | 33.0 /100 | #186 | Fair 2.5% |
Hungarian Self-Care Disability Correlation Summary
| Measurement | Hungarian Data | Self-Care Disability Data |
| Minimum | 0.21% | 0.28% |
| Maximum | 68.0% | 32.0% |
| Range | 67.8% | 31.7% |
| Mean | 16.8% | 4.7% |
| Median | 13.3% | 2.5% |
| Interquartile 25% (IQ1) | 6.5% | 2.2% |
| Interquartile 75% (IQ3) | 24.3% | 4.0% |
| Interquartile Range (IQR) | 17.8% | 1.8% |
| Standard Deviation (Sample) | 13.4% | 6.0% |
| Standard Deviation (Population) | 13.3% | 5.9% |
Correlation Details
| Hungarian Percentile | Sample Size | Self-Care Disability |
[ 0.0% - 0.5% ] 0.21% | 356,901,264 | 2.5% |
[ 0.5% - 1.0% ] 0.68% | 85,614,680 | 2.4% |
[ 1.0% - 1.5% ] 1.20% | 21,781,617 | 2.4% |
[ 1.5% - 2.0% ] 1.73% | 8,630,522 | 2.6% |
[ 2.0% - 2.5% ] 2.23% | 4,066,973 | 2.5% |
[ 2.5% - 3.0% ] 2.75% | 2,261,771 | 2.5% |
[ 3.0% - 3.5% ] 3.25% | 1,834,020 | 2.6% |
[ 3.5% - 4.0% ] 3.77% | 1,304,002 | 2.6% |
[ 4.0% - 4.5% ] 4.26% | 903,147 | 2.8% |
[ 4.5% - 5.0% ] 4.74% | 460,022 | 2.4% |
[ 5.0% - 5.5% ] 5.28% | 430,009 | 2.7% |
[ 5.5% - 6.0% ] 5.78% | 154,223 | 2.2% |
[ 6.0% - 6.5% ] 6.22% | 146,218 | 2.4% |
[ 6.5% - 7.0% ] 6.77% | 117,411 | 2.3% |
[ 7.0% - 7.5% ] 7.17% | 77,274 | 2.2% |
[ 7.5% - 8.0% ] 7.75% | 68,954 | 3.2% |
[ 8.0% - 8.5% ] 8.21% | 46,207 | 2.5% |
[ 8.5% - 9.0% ] 8.71% | 26,793 | 1.7% |
[ 9.0% - 9.5% ] 9.15% | 18,498 | 2.7% |
[ 9.5% - 10.0% ] 9.69% | 11,817 | 3.9% |
[ 10.0% - 10.5% ] 10.23% | 3,156 | 4.2% |
[ 10.5% - 11.0% ] 10.94% | 55,580 | 1.9% |
[ 11.0% - 11.5% ] 11.30% | 24,283 | 2.3% |
[ 11.5% - 12.0% ] 11.76% | 18,533 | 1.7% |
[ 12.0% - 12.5% ] 12.06% | 77,181 | 2.2% |
[ 12.5% - 13.0% ] 12.67% | 2,423 | 5.2% |
[ 13.0% - 13.5% ] 13.34% | 1,147 | 1.8% |
[ 14.0% - 14.5% ] 14.04% | 178 | 5.3% |
[ 14.5% - 15.0% ] 14.71% | 741 | 5.1% |
[ 15.0% - 15.5% ] 15.05% | 7,051 | 1.4% |
[ 17.0% - 17.5% ] 17.14% | 48,627 | 2.6% |
[ 17.5% - 18.0% ] 17.65% | 51 | 17.6% |
[ 18.0% - 18.5% ] 18.15% | 1,322 | 3.7% |
[ 18.5% - 19.0% ] 18.84% | 807 | 2.2% |
[ 19.0% - 19.5% ] 19.42% | 1,792 | 1.4% |
[ 20.0% - 20.5% ] 20.00% | 5 | 20.0% |
[ 21.0% - 21.5% ] 21.35% | 28,512 | 1.8% |
[ 21.5% - 22.0% ] 21.57% | 2,035 | 1.9% |
[ 22.5% - 23.0% ] 22.53% | 7,385 | 3.2% |
[ 24.0% - 24.5% ] 24.00% | 125 | 7.2% |
[ 24.5% - 25.0% ] 24.63% | 64,313 | 2.2% |
[ 25.0% - 25.5% ] 25.30% | 5,501 | 1.3% |
[ 26.0% - 26.5% ] 26.04% | 864 | 11.2% |
[ 28.5% - 29.0% ] 28.69% | 610 | 15.4% |
[ 29.5% - 30.0% ] 29.88% | 897 | 3.6% |
[ 31.5% - 32.0% ] 31.96% | 3,858 | 3.5% |
[ 33.0% - 33.5% ] 33.30% | 871 | 5.2% |
[ 35.5% - 36.0% ] 35.53% | 76 | 22.4% |
[ 37.0% - 37.5% ] 37.50% | 48 | 4.8% |
[ 38.5% - 39.0% ] 38.95% | 9,578 | 1.8% |
[ 40.5% - 41.0% ] 40.81% | 34,368 | 2.1% |
[ 41.0% - 41.5% ] 41.06% | 962 | 0.28% |
[ 68.0% - 68.5% ] 68.00% | 25 | 32.0% |