Immigrants from Canada Self-Care Disability
COMPARE
Immigrants from Canada
Select to Compare
Self-Care Disability
Immigrants from Canada Self-Care Disability
2.4%
SELF-CARE DISABILITY
92.0/ 100
METRIC RATING
118th/ 347
METRIC RANK
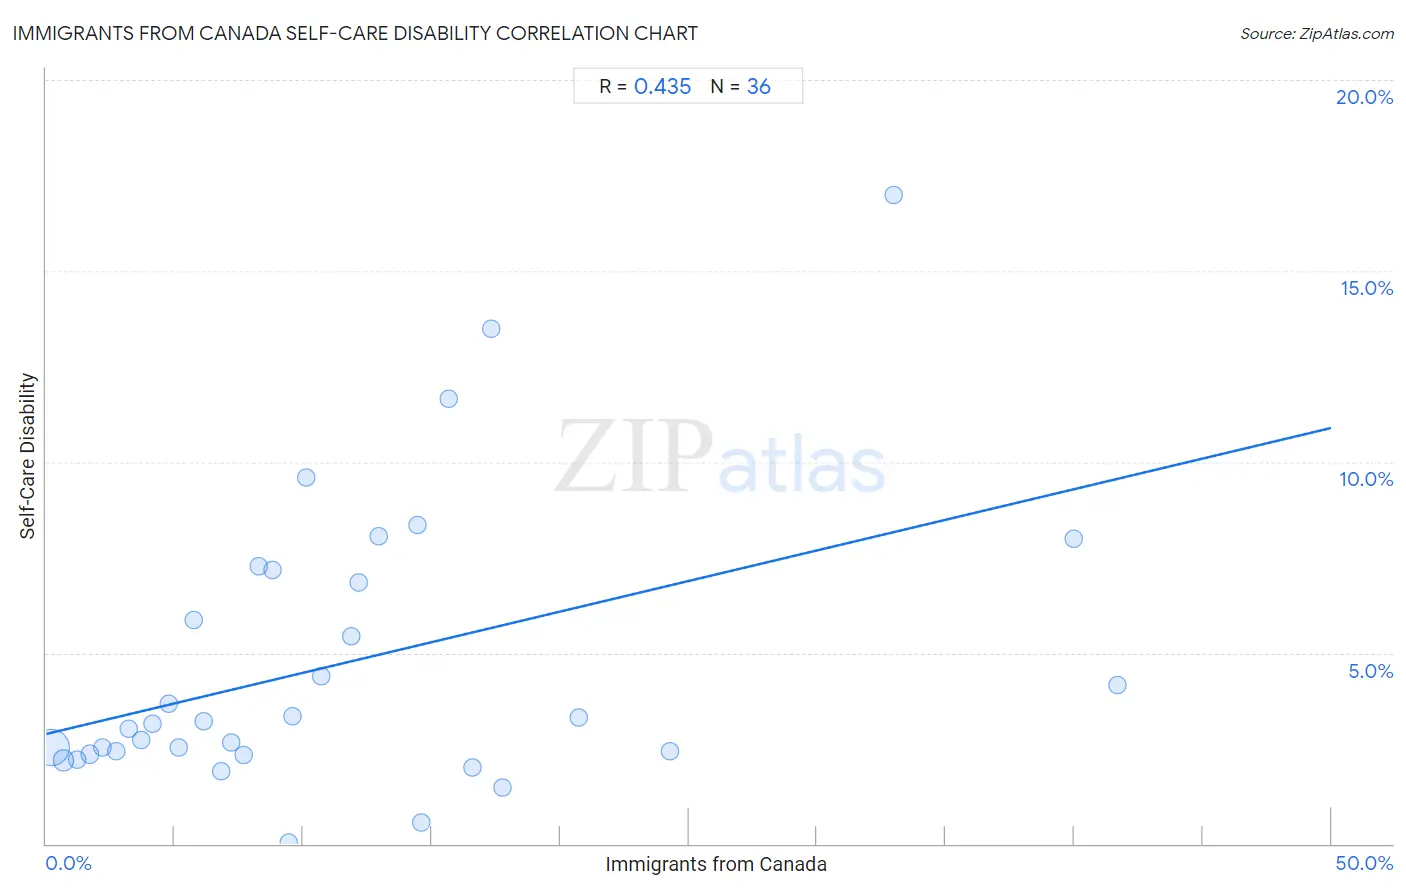
Immigrants from Canada Self-Care Disability Correlation Chart
The statistical analysis conducted on geographies consisting of 458,661,407 people shows a moderate positive correlation between the proportion of Immigrants from Canada and percentage of population with self-care disability in the United States with a correlation coefficient (R) of 0.435 and weighted average of 2.4%. On average, for every 1% (one percent) increase in Immigrants from Canada within a typical geography, there is an increase of 0.16% in percentage of population with self-care disability.
It is essential to understand that the correlation between the percentage of Immigrants from Canada and percentage of population with self-care disability does not imply a direct cause-and-effect relationship. It remains uncertain whether the presence of Immigrants from Canada influences an upward or downward trend in the level of percentage of population with self-care disability within an area, or if Immigrants from Canada simply ended up residing in those areas with higher or lower levels of percentage of population with self-care disability due to other factors.
Demographics Similar to Immigrants from Canada by Self-Care Disability
In terms of self-care disability, the demographic groups most similar to Immigrants from Canada are Immigrants from Sierra Leone (2.4%, a difference of 0.030%), Uruguayan (2.4%, a difference of 0.080%), Taiwanese (2.4%, a difference of 0.090%), Peruvian (2.4%, a difference of 0.11%), and Northern European (2.4%, a difference of 0.15%).
| Demographics | Rating | Rank | Self-Care Disability |
| Serbians | 93.6 /100 | #111 | Exceptional 2.4% |
| Scandinavians | 93.5 /100 | #112 | Exceptional 2.4% |
| South Americans | 93.2 /100 | #113 | Exceptional 2.4% |
| Immigrants from North Macedonia | 93.1 /100 | #114 | Exceptional 2.4% |
| Immigrants from Hong Kong | 93.1 /100 | #115 | Exceptional 2.4% |
| Northern Europeans | 92.9 /100 | #116 | Exceptional 2.4% |
| Taiwanese | 92.5 /100 | #117 | Exceptional 2.4% |
| Immigrants from Canada | 92.0 /100 | #118 | Exceptional 2.4% |
| Immigrants from Sierra Leone | 91.8 /100 | #119 | Exceptional 2.4% |
| Uruguayans | 91.5 /100 | #120 | Exceptional 2.4% |
| Peruvians | 91.3 /100 | #121 | Exceptional 2.4% |
| Belgians | 90.9 /100 | #122 | Exceptional 2.4% |
| Immigrants from Nigeria | 90.3 /100 | #123 | Exceptional 2.4% |
| Immigrants from North America | 90.2 /100 | #124 | Exceptional 2.4% |
| Immigrants from Morocco | 90.2 /100 | #124 | Exceptional 2.4% |
Immigrants from Canada Self-Care Disability Correlation Summary
| Measurement | Immigrants from Canada Data | Self-Care Disability Data |
| Minimum | 0.19% | 0.045% |
| Maximum | 41.7% | 17.0% |
| Range | 41.5% | 17.0% |
| Mean | 11.5% | 4.7% |
| Median | 9.1% | 3.2% |
| Interquartile 25% (IQ1) | 4.4% | 2.4% |
| Interquartile 75% (IQ3) | 15.1% | 7.0% |
| Interquartile Range (IQR) | 10.7% | 4.6% |
| Standard Deviation (Sample) | 10.1% | 3.7% |
| Standard Deviation (Population) | 10.0% | 3.7% |
Correlation Details
| Immigrants from Canada Percentile | Sample Size | Self-Care Disability |
[ 0.0% - 0.5% ] 0.19% | 377,403,638 | 2.5% |
[ 0.5% - 1.0% ] 0.68% | 60,261,689 | 2.2% |
[ 1.0% - 1.5% ] 1.19% | 13,585,072 | 2.2% |
[ 1.5% - 2.0% ] 1.69% | 4,570,024 | 2.3% |
[ 2.0% - 2.5% ] 2.21% | 1,469,938 | 2.5% |
[ 2.5% - 3.0% ] 2.72% | 651,951 | 2.4% |
[ 3.0% - 3.5% ] 3.22% | 197,929 | 3.0% |
[ 3.5% - 4.0% ] 3.68% | 131,013 | 2.7% |
[ 4.0% - 4.5% ] 4.12% | 149,070 | 3.1% |
[ 4.5% - 5.0% ] 4.75% | 51,626 | 3.7% |
[ 5.0% - 5.5% ] 5.15% | 36,129 | 2.5% |
[ 5.5% - 6.0% ] 5.76% | 19,259 | 5.9% |
[ 6.0% - 6.5% ] 6.14% | 32,238 | 3.2% |
[ 6.5% - 7.0% ] 6.82% | 15,448 | 1.9% |
[ 7.0% - 7.5% ] 7.20% | 32,398 | 2.6% |
[ 7.5% - 8.0% ] 7.67% | 14,648 | 2.3% |
[ 8.0% - 8.5% ] 8.25% | 1,879 | 7.3% |
[ 8.5% - 9.0% ] 8.82% | 4,106 | 7.2% |
[ 9.0% - 9.5% ] 9.44% | 6,716 | 0.045% |
[ 9.5% - 10.0% ] 9.57% | 1,547 | 3.3% |
[ 10.0% - 10.5% ] 10.11% | 2,245 | 9.6% |
[ 10.5% - 11.0% ] 10.69% | 2,413 | 4.4% |
[ 11.5% - 12.0% ] 11.87% | 4,935 | 5.4% |
[ 12.0% - 12.5% ] 12.18% | 2,726 | 6.8% |
[ 12.5% - 13.0% ] 12.94% | 394 | 8.0% |
[ 14.0% - 14.5% ] 14.46% | 567 | 8.3% |
[ 14.5% - 15.0% ] 14.62% | 390 | 0.55% |
[ 15.5% - 16.0% ] 15.65% | 147 | 11.7% |
[ 16.5% - 17.0% ] 16.59% | 4,297 | 2.0% |
[ 17.0% - 17.5% ] 17.29% | 133 | 13.5% |
[ 17.5% - 18.0% ] 17.74% | 3,669 | 1.5% |
[ 20.5% - 21.0% ] 20.70% | 401 | 3.3% |
[ 24.0% - 24.5% ] 24.26% | 2,498 | 2.4% |
[ 33.0% - 33.5% ] 33.00% | 200 | 17.0% |
[ 40.0% - 40.5% ] 40.00% | 50 | 8.0% |
[ 41.5% - 42.0% ] 41.67% | 24 | 4.2% |