New Zealander Self-Care Disability

COMPARE

New Zealander
Race
Ancestry
AfghanAfricanAlaska NativeAlaskan AthabascanAlbanianAleutAlsatianAmericanApacheArabArapahoArgentineanArmenianAssyrian/Chaldean/SyriacAustralianAustrianBahamianBangladeshiBarbadianBasqueBelgianBelizeanBermudanBhutaneseBlackfeetBolivianBrazilianBritishBritish West IndianBulgarianBurmeseCajunCambodianCanadianCape VerdeanCarpatho RusynCelticCentral AmericanCentral American IndianCherokeeCheyenneChickasawChileanChineseChippewaChoctawColombianColvilleComancheCosta RicanCreeCreekCroatianCrowCubanCypriotCzechCzechoslovakianDanishDelawareDominicanDutchDutch West IndianEastern EuropeanEcuadorianEgyptianEnglishEstonianEthiopianEuropeanFijianFilipinoFinnishFrenchFrench American IndianFrench CanadianGermanGerman RussianGhanaianGreekGuamanian/ChamorroGuatemalanGuyaneseHaitianHmongHonduranHopiHoumaHungarianIcelanderIndian (Asian)IndonesianInupiatIranianIraqiIrishIroquoisIsraeliItalianJamaicanJapaneseJordanianKenyanKiowaKoreanLaotianLatvianLebaneseLiberianLithuanianLumbeeLuxembourgerMacedonianMalaysianMalteseMarshalleseMenomineeMexicanMexican American IndianMongolianMoroccanNative HawaiianNavajoNepaleseNew ZealanderNicaraguanNigerianNorthern EuropeanNorwegianOkinawanOsageOttawaPaiutePakistaniPalestinianPanamanianParaguayanPennsylvania GermanPeruvianPimaPolishPortuguesePotawatomiPuebloPuerto RicanPuget Sound SalishRomanianRussianSalvadoranSamoanScandinavianScotch-IrishScottishSeminoleSenegaleseSerbianShoshoneSierra LeoneanSiouxSlavicSlovakSloveneSomaliSouth AfricanSouth AmericanSouth American IndianSoviet UnionSpaniardSpanishSpanish AmericanSpanish American IndianSri LankanSubsaharan AfricanSudaneseSwedishSwissSyrianTaiwaneseThaiTlingit-HaidaTohono O'OdhamTonganTrinidadian and TobagonianTsimshianTurkishU.S. Virgin IslanderUgandanUkrainianUruguayanUteVenezuelanVietnameseWelshWest IndianYakamaYaquiYugoslavianYumanYup'ikZimbabwean
Immigration
NonimmigrantsImmigrantsAfghanistanAfricaAlbaniaArgentinaArmeniaAsiaAustraliaAustriaBahamasBangladeshBarbadosBelarusBelgiumBelizeBoliviaBosnia and HerzegovinaBrazilBulgariaBurma/MyanmarCabo VerdeCambodiaCameroonCanadaCaribbeanCentral AmericaChileChinaColombiaCongoCosta RicaCroatiaCubaCzechoslovakiaDenmarkDominicaDominican RepublicEastern AfricaEastern AsiaEastern EuropeEcuadorEgyptEl SalvadorEnglandEritreaEthiopiaEuropeFijiFranceGermanyGhanaGreeceGrenadaGuatemalaGuyanaHaitiHondurasHong KongHungaryIndiaIndonesiaIranIraqIrelandIsraelItalyJamaicaJapanJordanKazakhstanKenyaKoreaKuwaitLaosLatin AmericaLatviaLebanonLiberiaLithuaniaMalaysiaMexicoMicronesiaMiddle AfricaMoldovaMoroccoNepalNetherlandsNicaraguaNigeriaNorth AmericaNorth MacedoniaNorthern AfricaNorthern EuropeNorwayOceaniaPakistanPanamaPeruPhilippinesPolandPortugalRomaniaRussiaSaudi ArabiaScotlandSenegalSerbiaSierra LeoneSingaporeSomaliaSouth AfricaSouth AmericaSouth Central AsiaSouth Eastern AsiaSouthern EuropeSpainSri LankaSt. Vincent and the GrenadinesSudanSwedenSwitzerlandSyriaTaiwanThailandTrinidad and TobagoTurkeyUgandaUkraineUruguayUzbekistanVenezuelaVietnamWest IndiesWestern AfricaWestern AsiaWestern EuropeYemenZaireZimbabweAzores
Select to Compare
Race
Ancestry
AfghanAfricanAlaska NativeAlaskan AthabascanAlbanianAleutAlsatianAmericanApacheArabArapahoArgentineanArmenianAssyrian/Chaldean/SyriacAustralianAustrianBahamianBangladeshiBarbadianBasqueBelgianBelizeanBermudanBhutaneseBlackfeetBolivianBrazilianBritishBritish West IndianBulgarianBurmeseCajunCambodianCanadianCape VerdeanCarpatho RusynCelticCentral AmericanCentral American IndianCherokeeCheyenneChickasawChileanChineseChippewaChoctawColombianColvilleComancheCosta RicanCreeCreekCroatianCrowCubanCypriotCzechCzechoslovakianDanishDelawareDominicanDutchDutch West IndianEastern EuropeanEcuadorianEgyptianEnglishEstonianEthiopianEuropeanFijianFilipinoFinnishFrenchFrench American IndianFrench CanadianGermanGerman RussianGhanaianGreekGuamanian/ChamorroGuatemalanGuyaneseHaitianHmongHonduranHopiHoumaHungarianIcelanderIndian (Asian)IndonesianInupiatIranianIraqiIrishIroquoisIsraeliItalianJamaicanJapaneseJordanianKenyanKiowaKoreanLaotianLatvianLebaneseLiberianLithuanianLumbeeLuxembourgerMacedonianMalaysianMalteseMarshalleseMenomineeMexicanMexican American IndianMongolianMoroccanNative HawaiianNavajoNepaleseNicaraguanNigerianNorthern EuropeanNorwegianOkinawanOsageOttawaPaiutePakistaniPalestinianPanamanianParaguayanPennsylvania GermanPeruvianPimaPolishPortuguesePotawatomiPuebloPuerto RicanPuget Sound SalishRomanianRussianSalvadoranSamoanScandinavianScotch-IrishScottishSeminoleSenegaleseSerbianShoshoneSierra LeoneanSiouxSlavicSlovakSloveneSomaliSouth AfricanSouth AmericanSouth American IndianSoviet UnionSpaniardSpanishSpanish AmericanSpanish American IndianSri LankanSubsaharan AfricanSudaneseSwedishSwissSyrianTaiwaneseThaiTlingit-HaidaTohono O'OdhamTonganTrinidadian and TobagonianTsimshianTurkishU.S. Virgin IslanderUgandanUkrainianUruguayanUteVenezuelanVietnameseWelshWest IndianYakamaYaquiYugoslavianYumanYup'ikZimbabwean
Immigration
NonimmigrantsImmigrantsAfghanistanAfricaAlbaniaArgentinaArmeniaAsiaAustraliaAustriaBahamasBangladeshBarbadosBelarusBelgiumBelizeBoliviaBosnia and HerzegovinaBrazilBulgariaBurma/MyanmarCabo VerdeCambodiaCameroonCanadaCaribbeanCentral AmericaChileChinaColombiaCongoCosta RicaCroatiaCubaCzechoslovakiaDenmarkDominicaDominican RepublicEastern AfricaEastern AsiaEastern EuropeEcuadorEgyptEl SalvadorEnglandEritreaEthiopiaEuropeFijiFranceGermanyGhanaGreeceGrenadaGuatemalaGuyanaHaitiHondurasHong KongHungaryIndiaIndonesiaIranIraqIrelandIsraelItalyJamaicaJapanJordanKazakhstanKenyaKoreaKuwaitLaosLatin AmericaLatviaLebanonLiberiaLithuaniaMalaysiaMexicoMicronesiaMiddle AfricaMoldovaMoroccoNepalNetherlandsNicaraguaNigeriaNorth AmericaNorth MacedoniaNorthern AfricaNorthern EuropeNorwayOceaniaPakistanPanamaPeruPhilippinesPolandPortugalRomaniaRussiaSaudi ArabiaScotlandSenegalSerbiaSierra LeoneSingaporeSomaliaSouth AfricaSouth AmericaSouth Central AsiaSouth Eastern AsiaSouthern EuropeSpainSri LankaSt. Vincent and the GrenadinesSudanSwedenSwitzerlandSyriaTaiwanThailandTrinidad and TobagoTurkeyUgandaUkraineUruguayUzbekistanVenezuelaVietnamWest IndiesWestern AfricaWestern AsiaWestern EuropeYemenZaireZimbabweAzores
Self-Care Disability
Income
Poverty
Unemployment
Labor Participation
Family Structure
Vehicle Availability
Education Level
Disability

New Zealander Self-Care Disability
Exceptional

2.3%
SELF-CARE DISABILITY
99.5/ 100
METRIC RATING
59th/ 347
METRIC RANK

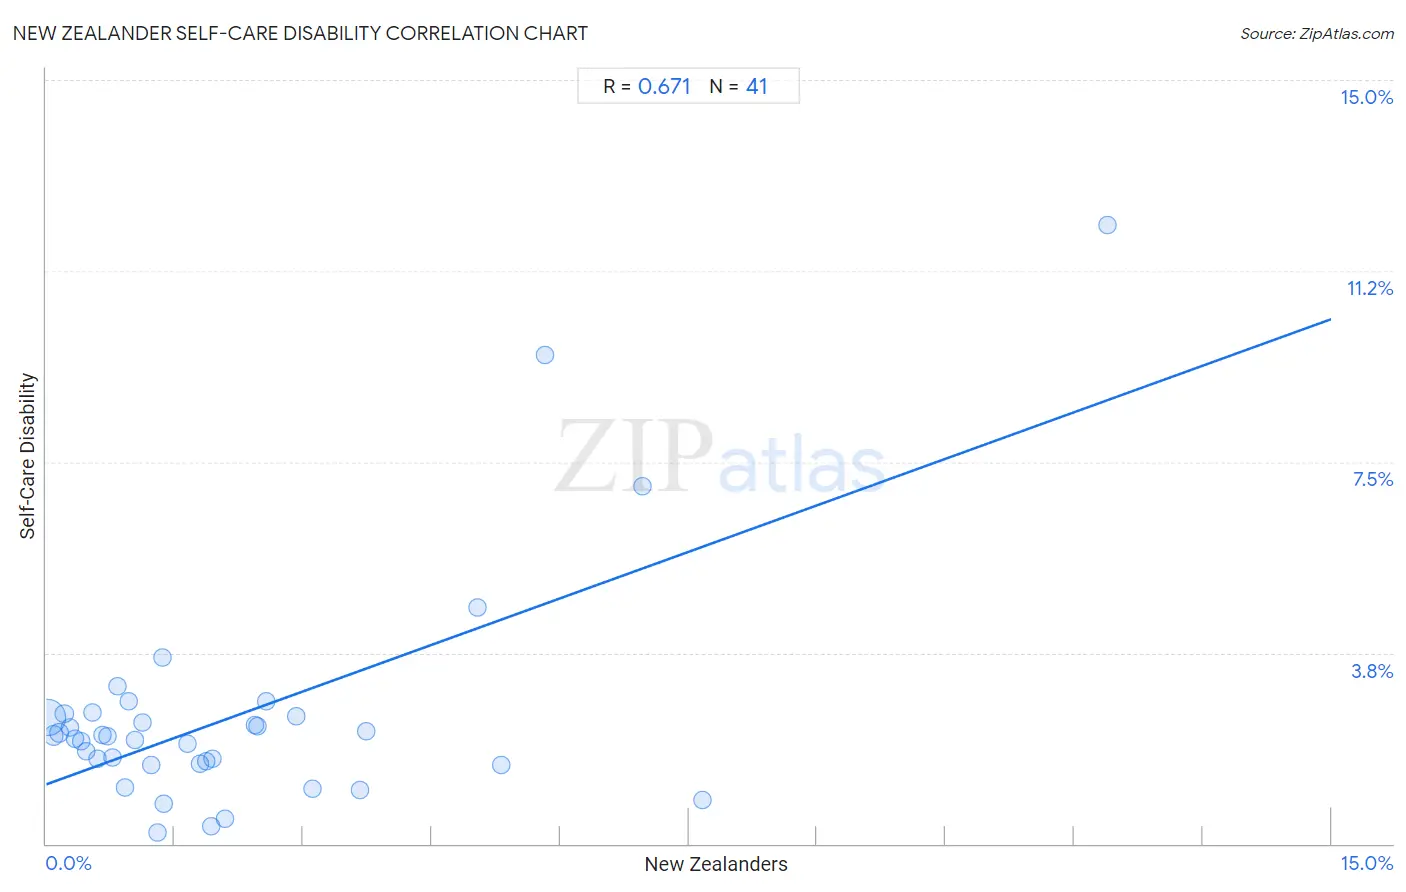
New Zealander Self-Care Disability Correlation Chart

The statistical analysis conducted on geographies consisting of 106,879,653 people shows a significant positive correlation between the proportion of New Zealanders and percentage of population with self-care disability in the United States with a correlation coefficient (R) of 0.671 and weighted average of 2.3%. On average, for every 1% (one percent) increase in New Zealanders within a typical geography, there is an increase of 0.61% in percentage of population with self-care disability.
New Zealander Self-Care Disability
It is essential to understand that the correlation between the percentage of New Zealanders and percentage of population with self-care disability does not imply a direct cause-and-effect relationship. It remains uncertain whether the presence of New Zealanders influences an upward or downward trend in the level of percentage of population with self-care disability within an area, or if New Zealanders simply ended up residing in those areas with higher or lower levels of percentage of population with self-care disability due to other factors.

Demographics Similar to New Zealanders by Self-Care Disability

In terms of self-care disability, the demographic groups most similar to New Zealanders are Immigrants from Cameroon (2.3%, a difference of 0.11%), Immigrants from Japan (2.3%, a difference of 0.14%), Immigrants from Belgium (2.3%, a difference of 0.18%), Immigrants from Eastern Asia (2.3%, a difference of 0.19%), and Immigrants from France (2.3%, a difference of 0.23%).
DemographicsRating | RankSelf-Care Disability
Immigrants from Serbia
99.6
/100
|
#52
Exceptional
2.3%
Australians
99.6
/100
|
#53
Exceptional
2.3%
Argentineans
99.6
/100
|
#54
Exceptional
2.3%
Immigrants from France
99.6
/100
|
#55
Exceptional
2.3%
Immigrants from Eastern Asia
99.6
/100
|
#56
Exceptional
2.3%
Immigrants from Belgium
99.6
/100
|
#57
Exceptional
2.3%
Immigrants from Cameroon
99.6
/100
|
#58
Exceptional
2.3%
New Zealanders
99.5
/100
|
#59
Exceptional
2.3%
Immigrants from Japan
99.5
/100
|
#60
Exceptional
2.3%
Palestinians
99.4
/100
|
#61
Exceptional
2.3%
Egyptians
99.4
/100
|
#62
Exceptional
2.3%
Mongolians
99.3
/100
|
#63
Exceptional
2.3%
Swedes
99.3
/100
|
#64
Exceptional
2.3%
Brazilians
99.3
/100
|
#65
Exceptional
2.3%
Immigrants from Argentina
99.3
/100
|
#66
Exceptional
2.3%

New Zealander Self-Care Disability Correlation Summary

MeasurementNew Zealander DataSelf-Care Disability Data
Minimum0.016%0.21%
Maximum12.4%12.2%
Range12.4%11.9%
Mean2.2%2.5%
Median1.4%2.1%
Interquartile 25% (IQ1)0.63%1.6%
Interquartile 75% (IQ3)2.7%2.5%
Interquartile Range (IQR)2.1%0.97%
Standard Deviation (Sample)2.5%2.3%
Standard Deviation (Population)2.5%2.2%

Correlation Details

New Zealander PercentileSample SizeSelf-Care Disability
[
0.0%
-
0.5%
]
0.016%
93,462,3062.5%
[
0.0%
-
0.5%
]
0.086%
7,621,4292.1%
[
0.0%
-
0.5%
]
0.15%
2,736,0832.2%
[
0.0%
-
0.5%
]
0.21%
994,5372.5%
[
0.0%
-
0.5%
]
0.27%
670,9952.3%
[
0.0%
-
0.5%
]
0.34%
442,8052.1%
[
0.0%
-
0.5%
]
0.40%
215,3272.0%
[
0.0%
-
0.5%
]
0.47%
199,4211.8%
[
0.5%
-
1.0%
]
0.54%
138,9442.6%
[
0.5%
-
1.0%
]
0.59%
46,1451.7%
[
0.5%
-
1.0%
]
0.66%
61,5642.1%
[
0.5%
-
1.0%
]
0.71%
53,7772.1%
[
0.5%
-
1.0%
]
0.78%
28,5431.7%
[
0.5%
-
1.0%
]
0.84%
58,0183.1%
[
0.5%
-
1.0%
]
0.92%
35,5871.1%
[
0.5%
-
1.0%
]
0.96%
26,0232.8%
[
1.0%
-
1.5%
]
1.03%
7,6452.0%
[
1.0%
-
1.5%
]
1.12%
5,0122.4%
[
1.0%
-
1.5%
]
1.23%
7,7871.5%
[
1.0%
-
1.5%
]
1.30%
12,6330.21%
[
1.0%
-
1.5%
]
1.35%
13,3223.7%
[
1.0%
-
1.5%
]
1.38%
6,1040.79%
[
1.5%
-
2.0%
]
1.65%
3632.0%
[
1.5%
-
2.0%
]
1.80%
5,5691.6%
[
1.5%
-
2.0%
]
1.86%
1,0191.6%
[
1.5%
-
2.0%
]
1.92%
1,2470.35%
[
1.5%
-
2.0%
]
1.95%
9761.7%
[
2.0%
-
2.5%
]
2.09%
3,3050.49%
[
2.0%
-
2.5%
]
2.43%
2,0162.3%
[
2.0%
-
2.5%
]
2.47%
3,3672.3%
[
2.5%
-
3.0%
]
2.57%
4,4022.8%
[
2.5%
-
3.0%
]
2.92%
6,3452.5%
[
3.0%
-
3.5%
]
3.11%
1,4131.1%
[
3.5%
-
4.0%
]
3.67%
4911.1%
[
3.5%
-
4.0%
]
3.73%
1,3402.2%
[
5.0%
-
5.5%
]
5.03%
8944.6%
[
5.0%
-
5.5%
]
5.31%
3391.5%
[
5.5%
-
6.0%
]
5.82%
4989.6%
[
6.5%
-
7.0%
]
6.95%
6047.0%
[
7.5%
-
8.0%
]
7.66%
1,2400.85%
[
12.0%
-
12.5%
]
12.39%
21812.2%