Immigrants from Denmark Self-Care Disability
COMPARE
Immigrants from Denmark
Select to Compare
Self-Care Disability
Immigrants from Denmark Self-Care Disability
2.3%
SELF-CARE DISABILITY
98.8/ 100
METRIC RATING
82nd/ 347
METRIC RANK
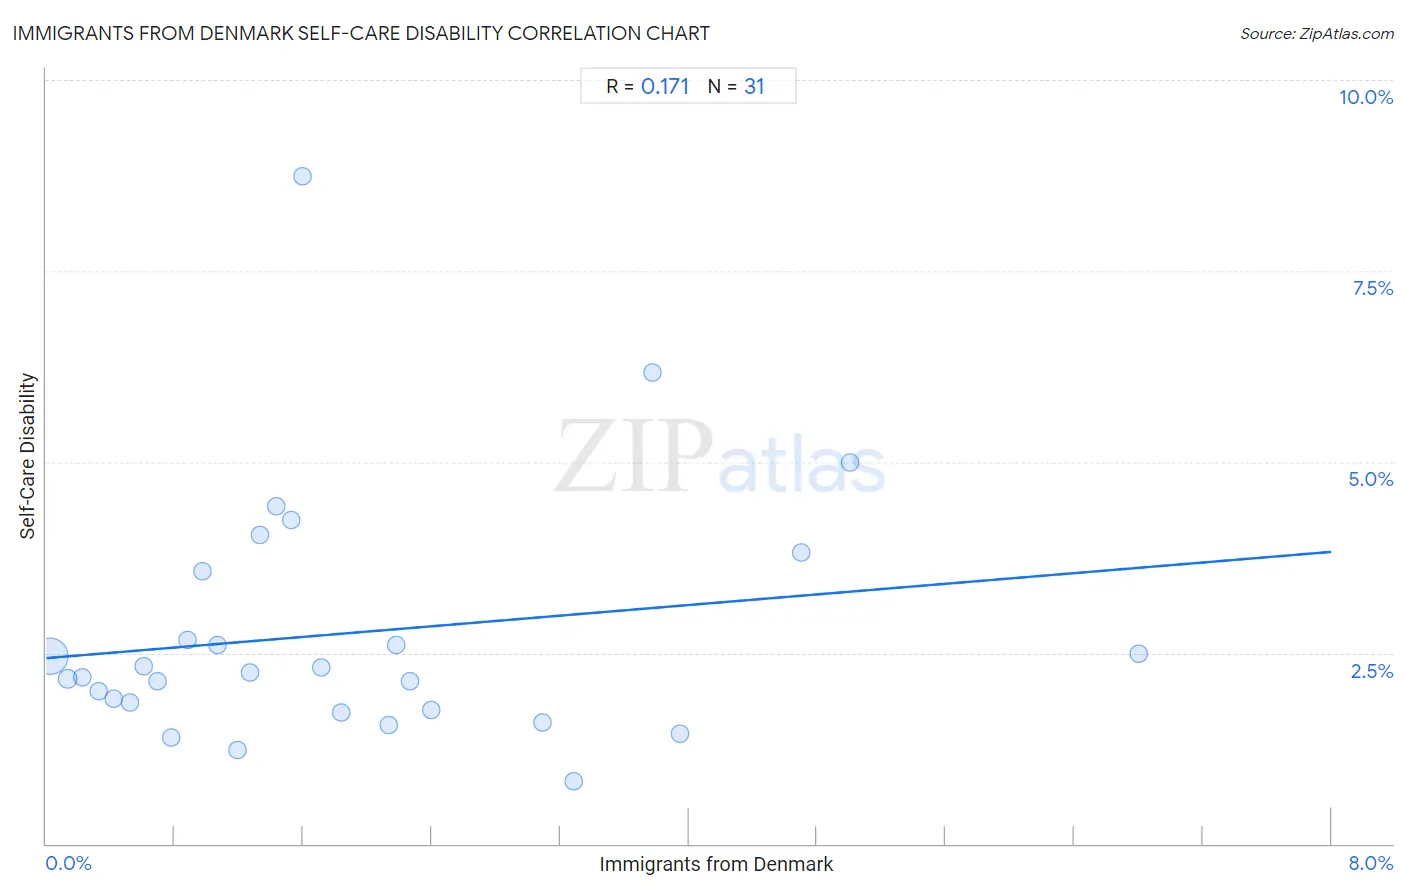
Immigrants from Denmark Self-Care Disability Correlation Chart
The statistical analysis conducted on geographies consisting of 136,375,472 people shows a poor positive correlation between the proportion of Immigrants from Denmark and percentage of population with self-care disability in the United States with a correlation coefficient (R) of 0.171 and weighted average of 2.3%. On average, for every 1% (one percent) increase in Immigrants from Denmark within a typical geography, there is an increase of 0.17% in percentage of population with self-care disability.
It is essential to understand that the correlation between the percentage of Immigrants from Denmark and percentage of population with self-care disability does not imply a direct cause-and-effect relationship. It remains uncertain whether the presence of Immigrants from Denmark influences an upward or downward trend in the level of percentage of population with self-care disability within an area, or if Immigrants from Denmark simply ended up residing in those areas with higher or lower levels of percentage of population with self-care disability due to other factors.
Demographics Similar to Immigrants from Denmark by Self-Care Disability
In terms of self-care disability, the demographic groups most similar to Immigrants from Denmark are Ugandan (2.3%, a difference of 0.0%), Chilean (2.3%, a difference of 0.070%), Indian (Asian) (2.3%, a difference of 0.070%), Immigrants from Spain (2.3%, a difference of 0.10%), and Immigrants from Middle Africa (2.3%, a difference of 0.26%).
| Demographics | Rating | Rank | Self-Care Disability |
| Immigrants from Netherlands | 99.1 /100 | #75 | Exceptional 2.3% |
| Immigrants from China | 99.1 /100 | #76 | Exceptional 2.3% |
| Immigrants from Middle Africa | 99.0 /100 | #77 | Exceptional 2.3% |
| Immigrants from Ireland | 99.0 /100 | #78 | Exceptional 2.3% |
| Immigrants from Kenya | 99.0 /100 | #79 | Exceptional 2.3% |
| Chileans | 98.8 /100 | #80 | Exceptional 2.3% |
| Ugandans | 98.8 /100 | #81 | Exceptional 2.3% |
| Immigrants from Denmark | 98.8 /100 | #82 | Exceptional 2.3% |
| Indians (Asian) | 98.7 /100 | #83 | Exceptional 2.3% |
| Immigrants from Spain | 98.7 /100 | #84 | Exceptional 2.3% |
| Estonians | 98.3 /100 | #85 | Exceptional 2.3% |
| Immigrants from Northern Africa | 98.2 /100 | #86 | Exceptional 2.3% |
| Sierra Leoneans | 98.0 /100 | #87 | Exceptional 2.4% |
| Lithuanians | 98.0 /100 | #88 | Exceptional 2.4% |
| Immigrants from Congo | 98.0 /100 | #89 | Exceptional 2.4% |
Immigrants from Denmark Self-Care Disability Correlation Summary
| Measurement | Immigrants from Denmark Data | Self-Care Disability Data |
| Minimum | 0.022% | 0.82% |
| Maximum | 6.8% | 8.7% |
| Range | 6.8% | 7.9% |
| Mean | 1.9% | 2.8% |
| Median | 1.4% | 2.2% |
| Interquartile 25% (IQ1) | 0.69% | 1.7% |
| Interquartile 75% (IQ3) | 2.4% | 3.6% |
| Interquartile Range (IQR) | 1.7% | 1.8% |
| Standard Deviation (Sample) | 1.6% | 1.6% |
| Standard Deviation (Population) | 1.6% | 1.6% |
Correlation Details
| Immigrants from Denmark Percentile | Sample Size | Self-Care Disability |
[ 0.0% - 0.5% ] 0.022% | 125,394,530 | 2.5% |
[ 0.0% - 0.5% ] 0.13% | 6,844,573 | 2.2% |
[ 0.0% - 0.5% ] 0.23% | 2,336,769 | 2.2% |
[ 0.0% - 0.5% ] 0.32% | 660,038 | 2.0% |
[ 0.0% - 0.5% ] 0.42% | 362,925 | 1.9% |
[ 0.5% - 1.0% ] 0.52% | 259,815 | 1.9% |
[ 0.5% - 1.0% ] 0.61% | 240,156 | 2.3% |
[ 0.5% - 1.0% ] 0.69% | 63,799 | 2.1% |
[ 0.5% - 1.0% ] 0.78% | 22,997 | 1.4% |
[ 0.5% - 1.0% ] 0.88% | 28,971 | 2.7% |
[ 0.5% - 1.0% ] 0.97% | 15,970 | 3.6% |
[ 1.0% - 1.5% ] 1.07% | 52,888 | 2.6% |
[ 1.0% - 1.5% ] 1.19% | 6,315 | 1.2% |
[ 1.0% - 1.5% ] 1.27% | 30,871 | 2.2% |
[ 1.0% - 1.5% ] 1.33% | 7,423 | 4.0% |
[ 1.0% - 1.5% ] 1.43% | 8,448 | 4.4% |
[ 1.5% - 2.0% ] 1.52% | 10,374 | 4.2% |
[ 1.5% - 2.0% ] 1.60% | 2,505 | 8.7% |
[ 1.5% - 2.0% ] 1.71% | 8,118 | 2.3% |
[ 1.5% - 2.0% ] 1.84% | 544 | 1.7% |
[ 2.0% - 2.5% ] 2.13% | 2,489 | 1.6% |
[ 2.0% - 2.5% ] 2.18% | 1,377 | 2.6% |
[ 2.0% - 2.5% ] 2.26% | 442 | 2.1% |
[ 2.0% - 2.5% ] 2.40% | 2,211 | 1.7% |
[ 3.0% - 3.5% ] 3.09% | 3,369 | 1.6% |
[ 3.0% - 3.5% ] 3.28% | 396 | 0.82% |
[ 3.5% - 4.0% ] 3.77% | 2,040 | 6.2% |
[ 3.5% - 4.0% ] 3.94% | 2,714 | 1.4% |
[ 4.5% - 5.0% ] 4.70% | 1,233 | 3.8% |
[ 5.0% - 5.5% ] 5.00% | 40 | 5.0% |
[ 6.5% - 7.0% ] 6.80% | 1,132 | 2.5% |