Immigrants from Ireland Self-Care Disability
COMPARE
Immigrants from Ireland
Select to Compare
Self-Care Disability
Immigrants from Ireland Self-Care Disability
2.3%
SELF-CARE DISABILITY
99.0/ 100
METRIC RATING
78th/ 347
METRIC RANK
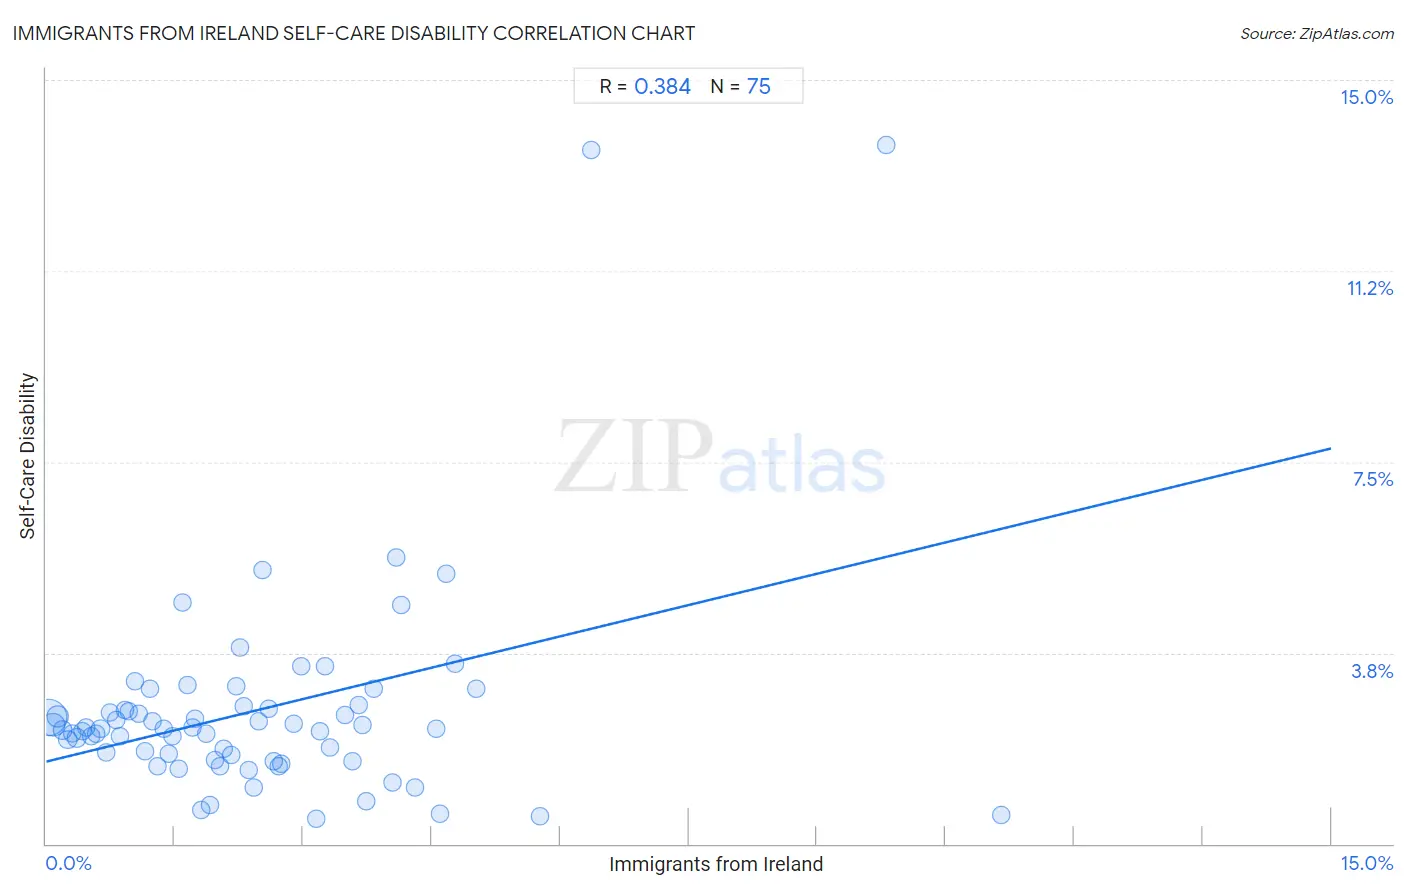
Immigrants from Ireland Self-Care Disability Correlation Chart
The statistical analysis conducted on geographies consisting of 240,643,513 people shows a mild positive correlation between the proportion of Immigrants from Ireland and percentage of population with self-care disability in the United States with a correlation coefficient (R) of 0.384 and weighted average of 2.3%. On average, for every 1% (one percent) increase in Immigrants from Ireland within a typical geography, there is an increase of 0.41% in percentage of population with self-care disability.
It is essential to understand that the correlation between the percentage of Immigrants from Ireland and percentage of population with self-care disability does not imply a direct cause-and-effect relationship. It remains uncertain whether the presence of Immigrants from Ireland influences an upward or downward trend in the level of percentage of population with self-care disability within an area, or if Immigrants from Ireland simply ended up residing in those areas with higher or lower levels of percentage of population with self-care disability due to other factors.
Demographics Similar to Immigrants from Ireland by Self-Care Disability
In terms of self-care disability, the demographic groups most similar to Immigrants from Ireland are Immigrants from Middle Africa (2.3%, a difference of 0.0%), Immigrants from Kenya (2.3%, a difference of 0.010%), Immigrants from China (2.3%, a difference of 0.080%), Immigrants from Netherlands (2.3%, a difference of 0.090%), and Immigrants from Switzerland (2.3%, a difference of 0.13%).
| Demographics | Rating | Rank | Self-Care Disability |
| Asians | 99.2 /100 | #71 | Exceptional 2.3% |
| Eastern Europeans | 99.2 /100 | #72 | Exceptional 2.3% |
| Immigrants from Egypt | 99.1 /100 | #73 | Exceptional 2.3% |
| Immigrants from Switzerland | 99.1 /100 | #74 | Exceptional 2.3% |
| Immigrants from Netherlands | 99.1 /100 | #75 | Exceptional 2.3% |
| Immigrants from China | 99.1 /100 | #76 | Exceptional 2.3% |
| Immigrants from Middle Africa | 99.0 /100 | #77 | Exceptional 2.3% |
| Immigrants from Ireland | 99.0 /100 | #78 | Exceptional 2.3% |
| Immigrants from Kenya | 99.0 /100 | #79 | Exceptional 2.3% |
| Chileans | 98.8 /100 | #80 | Exceptional 2.3% |
| Ugandans | 98.8 /100 | #81 | Exceptional 2.3% |
| Immigrants from Denmark | 98.8 /100 | #82 | Exceptional 2.3% |
| Indians (Asian) | 98.7 /100 | #83 | Exceptional 2.3% |
| Immigrants from Spain | 98.7 /100 | #84 | Exceptional 2.3% |
| Estonians | 98.3 /100 | #85 | Exceptional 2.3% |
Immigrants from Ireland Self-Care Disability Correlation Summary
| Measurement | Immigrants from Ireland Data | Self-Care Disability Data |
| Minimum | 0.024% | 0.50% |
| Maximum | 11.1% | 13.7% |
| Range | 11.1% | 13.2% |
| Mean | 2.4% | 2.6% |
| Median | 2.1% | 2.3% |
| Interquartile 25% (IQ1) | 1.0% | 1.7% |
| Interquartile 75% (IQ3) | 3.5% | 2.7% |
| Interquartile Range (IQR) | 2.5% | 1.0% |
| Standard Deviation (Sample) | 2.0% | 2.1% |
| Standard Deviation (Population) | 2.0% | 2.1% |
Correlation Details
| Immigrants from Ireland Percentile | Sample Size | Self-Care Disability |
[ 0.0% - 0.5% ] 0.024% | 144,618,891 | 2.5% |
[ 0.0% - 0.5% ] 0.080% | 41,671,091 | 2.3% |
[ 0.0% - 0.5% ] 0.14% | 25,950,640 | 2.5% |
[ 0.0% - 0.5% ] 0.19% | 8,507,291 | 2.2% |
[ 0.0% - 0.5% ] 0.25% | 5,248,992 | 2.0% |
[ 0.0% - 0.5% ] 0.31% | 3,714,096 | 2.2% |
[ 0.0% - 0.5% ] 0.36% | 2,725,785 | 2.1% |
[ 0.0% - 0.5% ] 0.42% | 1,440,409 | 2.2% |
[ 0.0% - 0.5% ] 0.47% | 1,136,129 | 2.3% |
[ 0.5% - 1.0% ] 0.52% | 841,655 | 2.1% |
[ 0.5% - 1.0% ] 0.58% | 892,581 | 2.2% |
[ 0.5% - 1.0% ] 0.63% | 627,539 | 2.3% |
[ 0.5% - 1.0% ] 0.70% | 379,126 | 1.8% |
[ 0.5% - 1.0% ] 0.75% | 440,707 | 2.6% |
[ 0.5% - 1.0% ] 0.81% | 388,162 | 2.4% |
[ 0.5% - 1.0% ] 0.86% | 348,192 | 2.1% |
[ 0.5% - 1.0% ] 0.92% | 83,281 | 2.6% |
[ 0.5% - 1.0% ] 0.97% | 118,500 | 2.6% |
[ 1.0% - 1.5% ] 1.04% | 143,553 | 3.2% |
[ 1.0% - 1.5% ] 1.08% | 265,114 | 2.6% |
[ 1.0% - 1.5% ] 1.16% | 67,092 | 1.8% |
[ 1.0% - 1.5% ] 1.21% | 285,873 | 3.0% |
[ 1.0% - 1.5% ] 1.24% | 98,155 | 2.4% |
[ 1.0% - 1.5% ] 1.30% | 86,599 | 1.5% |
[ 1.0% - 1.5% ] 1.37% | 58,842 | 2.3% |
[ 1.0% - 1.5% ] 1.42% | 28,319 | 1.8% |
[ 1.0% - 1.5% ] 1.47% | 45,848 | 2.1% |
[ 1.5% - 2.0% ] 1.54% | 56,653 | 1.5% |
[ 1.5% - 2.0% ] 1.59% | 19,084 | 4.7% |
[ 1.5% - 2.0% ] 1.65% | 12,077 | 3.1% |
[ 1.5% - 2.0% ] 1.71% | 16,745 | 2.3% |
[ 1.5% - 2.0% ] 1.74% | 39,141 | 2.5% |
[ 1.5% - 2.0% ] 1.81% | 5,808 | 0.67% |
[ 1.5% - 2.0% ] 1.86% | 30,627 | 2.2% |
[ 1.5% - 2.0% ] 1.91% | 24,439 | 0.77% |
[ 1.5% - 2.0% ] 1.96% | 9,062 | 1.7% |
[ 2.0% - 2.5% ] 2.04% | 3,882 | 1.5% |
[ 2.0% - 2.5% ] 2.08% | 6,312 | 1.9% |
[ 2.0% - 2.5% ] 2.15% | 1,625 | 1.7% |
[ 2.0% - 2.5% ] 2.22% | 2,616 | 3.1% |
[ 2.0% - 2.5% ] 2.25% | 754 | 3.9% |
[ 2.0% - 2.5% ] 2.30% | 304 | 2.7% |
[ 2.0% - 2.5% ] 2.37% | 10,780 | 1.4% |
[ 2.0% - 2.5% ] 2.42% | 4,466 | 1.1% |
[ 2.0% - 2.5% ] 2.48% | 1,493 | 2.4% |
[ 2.5% - 3.0% ] 2.52% | 2,022 | 5.4% |
[ 2.5% - 3.0% ] 2.60% | 6,011 | 2.6% |
[ 2.5% - 3.0% ] 2.66% | 31,720 | 1.6% |
[ 2.5% - 3.0% ] 2.72% | 2,799 | 1.5% |
[ 2.5% - 3.0% ] 2.74% | 7,599 | 1.6% |
[ 2.5% - 3.0% ] 2.89% | 3,809 | 2.4% |
[ 2.5% - 3.0% ] 2.97% | 20,439 | 3.5% |
[ 3.0% - 3.5% ] 3.16% | 7,729 | 0.50% |
[ 3.0% - 3.5% ] 3.20% | 2,812 | 2.2% |
[ 3.0% - 3.5% ] 3.26% | 399 | 3.5% |
[ 3.0% - 3.5% ] 3.31% | 8,872 | 1.9% |
[ 3.0% - 3.5% ] 3.49% | 15,666 | 2.5% |
[ 3.5% - 4.0% ] 3.58% | 2,041 | 1.6% |
[ 3.5% - 4.0% ] 3.64% | 2,305 | 2.7% |
[ 3.5% - 4.0% ] 3.70% | 16,426 | 2.3% |
[ 3.5% - 4.0% ] 3.74% | 3,828 | 0.85% |
[ 3.5% - 4.0% ] 3.83% | 575 | 3.0% |
[ 4.0% - 4.5% ] 4.05% | 8,250 | 1.2% |
[ 4.0% - 4.5% ] 4.08% | 196 | 5.6% |
[ 4.0% - 4.5% ] 4.14% | 893 | 4.7% |
[ 4.0% - 4.5% ] 4.30% | 186 | 1.1% |
[ 4.5% - 5.0% ] 4.55% | 550 | 2.3% |
[ 4.5% - 5.0% ] 4.59% | 2,047 | 0.59% |
[ 4.5% - 5.0% ] 4.67% | 793 | 5.3% |
[ 4.5% - 5.0% ] 4.77% | 943 | 3.5% |
[ 5.0% - 5.5% ] 5.01% | 33,059 | 3.0% |
[ 5.5% - 6.0% ] 5.76% | 191 | 0.54% |
[ 6.0% - 6.5% ] 6.36% | 330 | 13.6% |
[ 9.5% - 10.0% ] 9.80% | 153 | 13.7% |
[ 11.0% - 11.5% ] 11.14% | 2,540 | 0.56% |