Guamanian/Chamorro Family Poverty

COMPARE

Guamanian/Chamorro
Race
Ancestry
AfghanAfricanAlaska NativeAlaskan AthabascanAlbanianAleutAlsatianAmericanApacheArabArapahoArgentineanArmenianAssyrian/Chaldean/SyriacAustralianAustrianBahamianBangladeshiBarbadianBasqueBelgianBelizeanBermudanBhutaneseBlackfeetBolivianBrazilianBritishBritish West IndianBulgarianBurmeseCajunCambodianCanadianCape VerdeanCarpatho RusynCelticCentral AmericanCentral American IndianCherokeeCheyenneChickasawChileanChineseChippewaChoctawColombianColvilleComancheCosta RicanCreeCreekCroatianCrowCubanCypriotCzechCzechoslovakianDanishDelawareDominicanDutchDutch West IndianEastern EuropeanEcuadorianEgyptianEnglishEstonianEthiopianEuropeanFijianFilipinoFinnishFrenchFrench American IndianFrench CanadianGermanGerman RussianGhanaianGreekGuamanian/ChamorroGuatemalanGuyaneseHaitianHmongHonduranHopiHoumaHungarianIcelanderIndian (Asian)IndonesianInupiatIranianIraqiIrishIroquoisIsraeliItalianJamaicanJapaneseJordanianKenyanKiowaKoreanLaotianLatvianLebaneseLiberianLithuanianLumbeeLuxembourgerMacedonianMalaysianMalteseMarshalleseMenomineeMexicanMexican American IndianMongolianMoroccanNative HawaiianNavajoNepaleseNew ZealanderNicaraguanNigerianNorthern EuropeanNorwegianOkinawanOsageOttawaPaiutePakistaniPalestinianPanamanianParaguayanPennsylvania GermanPeruvianPimaPolishPortuguesePotawatomiPuebloPuerto RicanPuget Sound SalishRomanianRussianSalvadoranSamoanScandinavianScotch-IrishScottishSeminoleSenegaleseSerbianShoshoneSierra LeoneanSiouxSlavicSlovakSloveneSomaliSouth AfricanSouth AmericanSouth American IndianSoviet UnionSpaniardSpanishSpanish AmericanSpanish American IndianSri LankanSubsaharan AfricanSudaneseSwedishSwissSyrianTaiwaneseThaiTlingit-HaidaTohono O'OdhamTonganTrinidadian and TobagonianTsimshianTurkishU.S. Virgin IslanderUgandanUkrainianUruguayanUteVenezuelanVietnameseWelshWest IndianYakamaYaquiYugoslavianYumanYup'ikZimbabwean
Immigration
NonimmigrantsImmigrantsAfghanistanAfricaAlbaniaArgentinaArmeniaAsiaAustraliaAustriaBahamasBangladeshBarbadosBelarusBelgiumBelizeBoliviaBosnia and HerzegovinaBrazilBulgariaBurma/MyanmarCabo VerdeCambodiaCameroonCanadaCaribbeanCentral AmericaChileChinaColombiaCongoCosta RicaCroatiaCubaCzechoslovakiaDenmarkDominicaDominican RepublicEastern AfricaEastern AsiaEastern EuropeEcuadorEgyptEl SalvadorEnglandEritreaEthiopiaEuropeFijiFranceGermanyGhanaGreeceGrenadaGuatemalaGuyanaHaitiHondurasHong KongHungaryIndiaIndonesiaIranIraqIrelandIsraelItalyJamaicaJapanJordanKazakhstanKenyaKoreaKuwaitLaosLatin AmericaLatviaLebanonLiberiaLithuaniaMalaysiaMexicoMicronesiaMiddle AfricaMoldovaMoroccoNepalNetherlandsNicaraguaNigeriaNorth AmericaNorth MacedoniaNorthern AfricaNorthern EuropeNorwayOceaniaPakistanPanamaPeruPhilippinesPolandPortugalRomaniaRussiaSaudi ArabiaScotlandSenegalSerbiaSierra LeoneSingaporeSomaliaSouth AfricaSouth AmericaSouth Central AsiaSouth Eastern AsiaSouthern EuropeSpainSri LankaSt. Vincent and the GrenadinesSudanSwedenSwitzerlandSyriaTaiwanThailandTrinidad and TobagoTurkeyUgandaUkraineUruguayUzbekistanVenezuelaVietnamWest IndiesWestern AfricaWestern AsiaWestern EuropeYemenZaireZimbabweAzores
Select to Compare
Race
Ancestry
AfghanAfricanAlaska NativeAlaskan AthabascanAlbanianAleutAlsatianAmericanApacheArabArapahoArgentineanArmenianAssyrian/Chaldean/SyriacAustralianAustrianBahamianBangladeshiBarbadianBasqueBelgianBelizeanBermudanBhutaneseBlackfeetBolivianBrazilianBritishBritish West IndianBulgarianBurmeseCajunCambodianCanadianCape VerdeanCarpatho RusynCelticCentral AmericanCentral American IndianCherokeeCheyenneChickasawChileanChineseChippewaChoctawColombianColvilleComancheCosta RicanCreeCreekCroatianCrowCubanCypriotCzechCzechoslovakianDanishDelawareDominicanDutchDutch West IndianEastern EuropeanEcuadorianEgyptianEnglishEstonianEthiopianEuropeanFijianFilipinoFinnishFrenchFrench American IndianFrench CanadianGermanGerman RussianGhanaianGreekGuatemalanGuyaneseHaitianHmongHonduranHopiHoumaHungarianIcelanderIndian (Asian)IndonesianInupiatIranianIraqiIrishIroquoisIsraeliItalianJamaicanJapaneseJordanianKenyanKiowaKoreanLaotianLatvianLebaneseLiberianLithuanianLumbeeLuxembourgerMacedonianMalaysianMalteseMarshalleseMenomineeMexicanMexican American IndianMongolianMoroccanNative HawaiianNavajoNepaleseNew ZealanderNicaraguanNigerianNorthern EuropeanNorwegianOkinawanOsageOttawaPaiutePakistaniPalestinianPanamanianParaguayanPennsylvania GermanPeruvianPimaPolishPortuguesePotawatomiPuebloPuerto RicanPuget Sound SalishRomanianRussianSalvadoranSamoanScandinavianScotch-IrishScottishSeminoleSenegaleseSerbianShoshoneSierra LeoneanSiouxSlavicSlovakSloveneSomaliSouth AfricanSouth AmericanSouth American IndianSoviet UnionSpaniardSpanishSpanish AmericanSpanish American IndianSri LankanSubsaharan AfricanSudaneseSwedishSwissSyrianTaiwaneseThaiTlingit-HaidaTohono O'OdhamTonganTrinidadian and TobagonianTsimshianTurkishU.S. Virgin IslanderUgandanUkrainianUruguayanUteVenezuelanVietnameseWelshWest IndianYakamaYaquiYugoslavianYumanYup'ikZimbabwean
Immigration
NonimmigrantsImmigrantsAfghanistanAfricaAlbaniaArgentinaArmeniaAsiaAustraliaAustriaBahamasBangladeshBarbadosBelarusBelgiumBelizeBoliviaBosnia and HerzegovinaBrazilBulgariaBurma/MyanmarCabo VerdeCambodiaCameroonCanadaCaribbeanCentral AmericaChileChinaColombiaCongoCosta RicaCroatiaCubaCzechoslovakiaDenmarkDominicaDominican RepublicEastern AfricaEastern AsiaEastern EuropeEcuadorEgyptEl SalvadorEnglandEritreaEthiopiaEuropeFijiFranceGermanyGhanaGreeceGrenadaGuatemalaGuyanaHaitiHondurasHong KongHungaryIndiaIndonesiaIranIraqIrelandIsraelItalyJamaicaJapanJordanKazakhstanKenyaKoreaKuwaitLaosLatin AmericaLatviaLebanonLiberiaLithuaniaMalaysiaMexicoMicronesiaMiddle AfricaMoldovaMoroccoNepalNetherlandsNicaraguaNigeriaNorth AmericaNorth MacedoniaNorthern AfricaNorthern EuropeNorwayOceaniaPakistanPanamaPeruPhilippinesPolandPortugalRomaniaRussiaSaudi ArabiaScotlandSenegalSerbiaSierra LeoneSingaporeSomaliaSouth AfricaSouth AmericaSouth Central AsiaSouth Eastern AsiaSouthern EuropeSpainSri LankaSt. Vincent and the GrenadinesSudanSwedenSwitzerlandSyriaTaiwanThailandTrinidad and TobagoTurkeyUgandaUkraineUruguayUzbekistanVenezuelaVietnamWest IndiesWestern AfricaWestern AsiaWestern EuropeYemenZaireZimbabweAzores
Family Poverty
Income
Poverty
Unemployment
Labor Participation
Family Structure
Vehicle Availability
Education Level
Disability

Guamanian/Chamorro Family Poverty
Good

8.8%
POVERTY | FAMILIES
64.7/ 100
METRIC RATING
165th/ 347
METRIC RANK

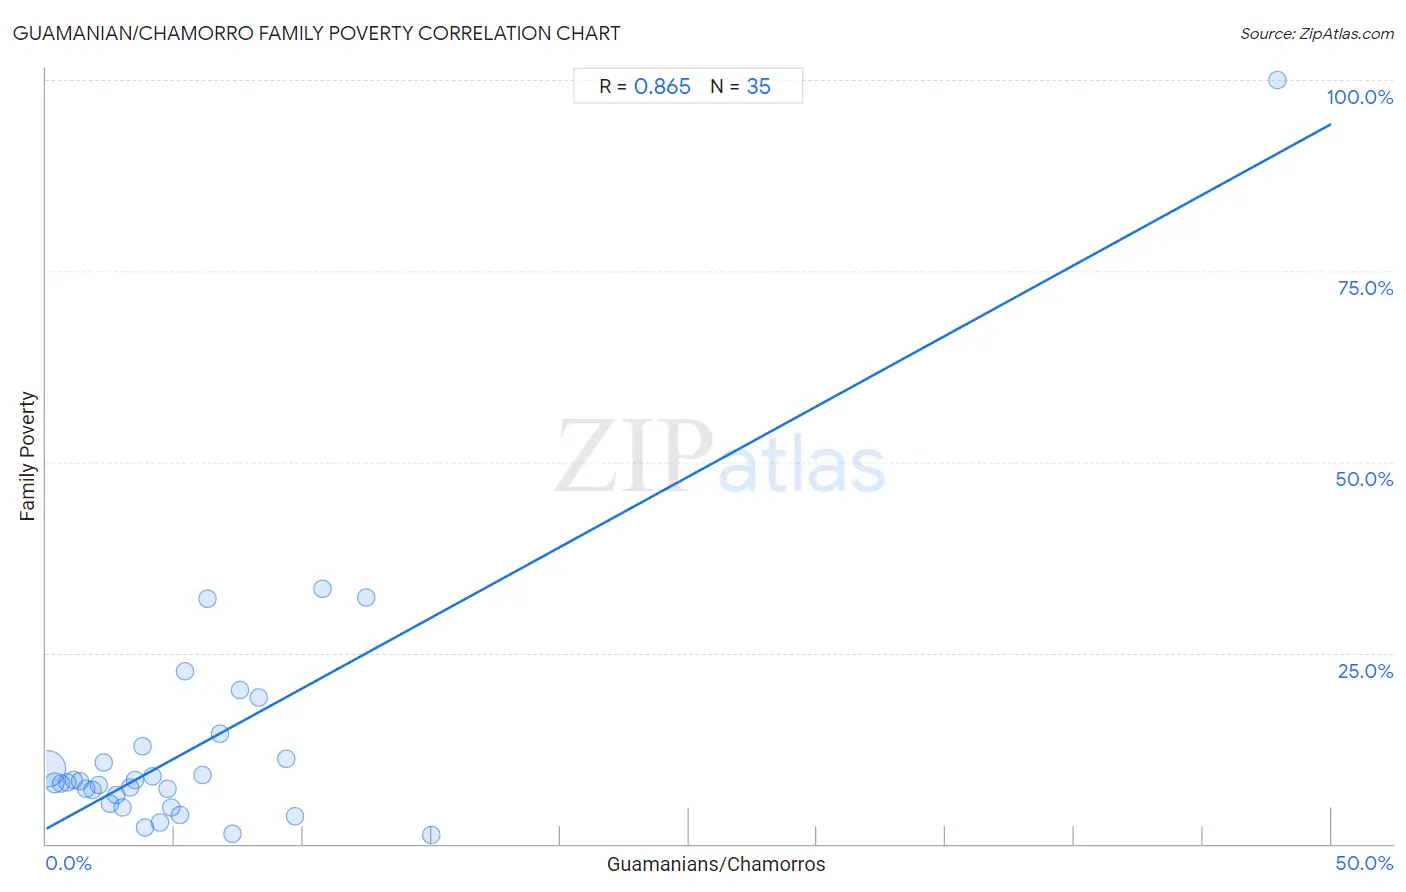
Guamanian/Chamorro Family Poverty Correlation Chart

The statistical analysis conducted on geographies consisting of 221,737,995 people shows a very strong positive correlation between the proportion of Guamanians/Chamorros and poverty level among families in the United States with a correlation coefficient (R) of 0.865 and weighted average of 8.8%. On average, for every 1% (one percent) increase in Guamanians/Chamorros within a typical geography, there is an increase of 1.8% in poverty level among families.
Guamanian/Chamorro Family Poverty
It is essential to understand that the correlation between the percentage of Guamanians/Chamorros and poverty level among families does not imply a direct cause-and-effect relationship. It remains uncertain whether the presence of Guamanians/Chamorros influences an upward or downward trend in the level of poverty level among families within an area, or if Guamanians/Chamorros simply ended up residing in those areas with higher or lower levels of poverty level among families due to other factors.

Demographics Similar to Guamanians/Chamorros by Family Poverty

In terms of family poverty, the demographic groups most similar to Guamanians/Chamorros are Celtic (8.8%, a difference of 0.030%), Afghan (8.8%, a difference of 0.18%), Pennsylvania German (8.8%, a difference of 0.19%), Ethiopian (8.8%, a difference of 0.24%), and Immigrants from Ethiopia (8.9%, a difference of 0.32%).
DemographicsRating | RankFamily Poverty
Whites/Caucasians
69.1
/100
|
#158
Good
8.8%
Peruvians
68.0
/100
|
#159
Good
8.8%
Hungarians
67.2
/100
|
#160
Good
8.8%
Immigrants from Northern Africa
66.9
/100
|
#161
Good
8.8%
Ethiopians
66.3
/100
|
#162
Good
8.8%
Pennsylvania Germans
66.0
/100
|
#163
Good
8.8%
Celtics
64.9
/100
|
#164
Good
8.8%
Guamanians/Chamorros
64.7
/100
|
#165
Good
8.8%
Afghans
63.5
/100
|
#166
Good
8.8%
Immigrants from Ethiopia
62.5
/100
|
#167
Good
8.9%
Israelis
62.1
/100
|
#168
Good
8.9%
Immigrants from Chile
59.6
/100
|
#169
Average
8.9%
Kenyans
58.2
/100
|
#170
Average
8.9%
Lebanese
57.6
/100
|
#171
Average
8.9%
Immigrants from Peru
57.5
/100
|
#172
Average
8.9%

Guamanian/Chamorro Family Poverty Correlation Summary

MeasurementGuamanian/Chamorro DataFamily Poverty Data
Minimum0.066%1.2%
Maximum47.9%100.0%
Range47.8%98.8%
Mean6.0%13.1%
Median4.1%8.0%
Interquartile 25% (IQ1)2.0%5.2%
Interquartile 75% (IQ3)7.3%12.7%
Interquartile Range (IQR)5.2%7.5%
Standard Deviation (Sample)8.1%17.3%
Standard Deviation (Population)8.0%17.1%

Correlation Details

Guamanian/Chamorro PercentileSample SizeFamily Poverty
[
0.0%
-
0.5%
]
0.066%
190,786,3279.9%
[
0.0%
-
0.5%
]
0.33%
20,013,6218.0%
[
0.5%
-
1.0%
]
0.58%
5,608,3677.9%
[
0.5%
-
1.0%
]
0.82%
2,544,7468.0%
[
1.0%
-
1.5%
]
1.08%
1,250,3028.3%
[
1.0%
-
1.5%
]
1.29%
475,5128.2%
[
1.5%
-
2.0%
]
1.55%
404,1097.2%
[
1.5%
-
2.0%
]
1.78%
203,3507.0%
[
2.0%
-
2.5%
]
2.04%
135,5497.6%
[
2.0%
-
2.5%
]
2.22%
66,47810.7%
[
2.0%
-
2.5%
]
2.49%
48,9375.2%
[
2.5%
-
3.0%
]
2.74%
24,7126.3%
[
2.5%
-
3.0%
]
2.99%
29,8624.8%
[
3.0%
-
3.5%
]
3.26%
27,4857.3%
[
3.0%
-
3.5%
]
3.45%
45,9848.3%
[
3.5%
-
4.0%
]
3.75%
9,68012.7%
[
3.5%
-
4.0%
]
3.87%
4,2432.2%
[
4.0%
-
4.5%
]
4.15%
5,0148.9%
[
4.0%
-
4.5%
]
4.40%
5,1992.9%
[
4.5%
-
5.0%
]
4.73%
24,9677.1%
[
4.5%
-
5.0%
]
4.88%
3,7484.7%
[
5.0%
-
5.5%
]
5.22%
1,9743.7%
[
5.0%
-
5.5%
]
5.38%
18622.6%
[
6.0%
-
6.5%
]
6.07%
4,7589.0%
[
6.0%
-
6.5%
]
6.27%
1,61132.1%
[
6.5%
-
7.0%
]
6.77%
1,38814.3%
[
7.0%
-
7.5%
]
7.27%
1,1281.3%
[
7.5%
-
8.0%
]
7.55%
1,66920.2%
[
8.0%
-
8.5%
]
8.29%
5,26219.1%
[
9.0%
-
9.5%
]
9.34%
57811.1%
[
9.5%
-
10.0%
]
9.70%
4023.5%
[
10.5%
-
11.0%
]
10.74%
12133.3%
[
12.0%
-
12.5%
]
12.46%
31332.3%
[
14.5%
-
15.0%
]
14.97%
2941.2%
[
47.5%
-
48.0%
]
47.90%
119100.0%