Guamanian/Chamorro Disability
COMPARE
Guamanian/Chamorro
Select to Compare
Disability
Guamanian/Chamorro Disability
12.3%
DISABILITY
1.4/ 100
METRIC RATING
248th/ 347
METRIC RANK
Guamanian/Chamorro Disability Correlation Chart
The statistical analysis conducted on geographies consisting of 221,898,550 people shows a weak positive correlation between the proportion of Guamanians/Chamorros and percentage of population with a disability in the United States with a correlation coefficient (R) of 0.298 and weighted average of 12.3%. On average, for every 1% (one percent) increase in Guamanians/Chamorros within a typical geography, there is an increase of 0.41% in percentage of population with a disability.
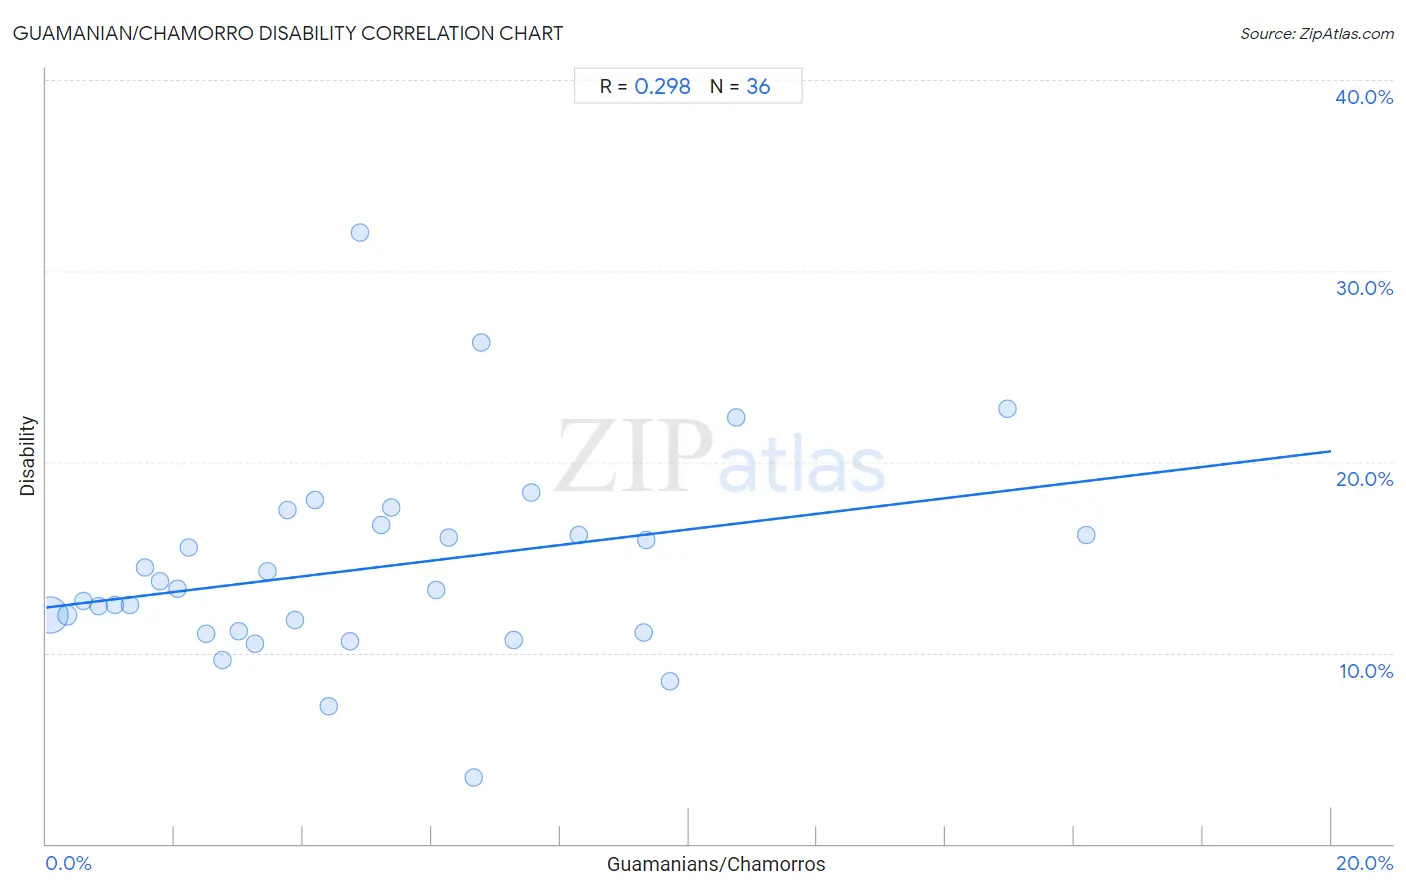
It is essential to understand that the correlation between the percentage of Guamanians/Chamorros and percentage of population with a disability does not imply a direct cause-and-effect relationship. It remains uncertain whether the presence of Guamanians/Chamorros influences an upward or downward trend in the level of percentage of population with a disability within an area, or if Guamanians/Chamorros simply ended up residing in those areas with higher or lower levels of percentage of population with a disability due to other factors.
Demographics Similar to Guamanians/Chamorros by Disability
In terms of disability, the demographic groups most similar to Guamanians/Chamorros are Carpatho Rusyn (12.3%, a difference of 0.010%), Subsaharan African (12.3%, a difference of 0.020%), European (12.3%, a difference of 0.020%), Indonesian (12.2%, a difference of 0.040%), and Swiss (12.2%, a difference of 0.070%).
| Demographics | Rating | Rank | Disability |
| Yugoslavians | 1.7 /100 | #241 | Tragic 12.2% |
| Poles | 1.7 /100 | #242 | Tragic 12.2% |
| British | 1.5 /100 | #243 | Tragic 12.2% |
| Basques | 1.5 /100 | #244 | Tragic 12.2% |
| Liberians | 1.5 /100 | #245 | Tragic 12.2% |
| Swiss | 1.5 /100 | #246 | Tragic 12.2% |
| Indonesians | 1.4 /100 | #247 | Tragic 12.2% |
| Guamanians/Chamorros | 1.4 /100 | #248 | Tragic 12.3% |
| Carpatho Rusyns | 1.4 /100 | #249 | Tragic 12.3% |
| Sub-Saharan Africans | 1.4 /100 | #250 | Tragic 12.3% |
| Europeans | 1.4 /100 | #251 | Tragic 12.3% |
| Bermudans | 1.1 /100 | #252 | Tragic 12.3% |
| Belgians | 0.8 /100 | #253 | Tragic 12.3% |
| German Russians | 0.8 /100 | #254 | Tragic 12.3% |
| Slovenes | 0.6 /100 | #255 | Tragic 12.4% |
Guamanian/Chamorro Disability Correlation Summary
| Measurement | Guamanian/Chamorro Data | Disability Data |
| Minimum | 0.066% | 3.4% |
| Maximum | 16.2% | 32.0% |
| Range | 16.1% | 28.6% |
| Mean | 5.1% | 14.4% |
| Median | 4.3% | 13.3% |
| Interquartile 25% (IQ1) | 2.1% | 11.1% |
| Interquartile 75% (IQ3) | 7.0% | 16.4% |
| Interquartile Range (IQR) | 4.9% | 5.3% |
| Standard Deviation (Sample) | 3.9% | 5.3% |
| Standard Deviation (Population) | 3.8% | 5.2% |
Correlation Details
| Guamanian/Chamorro Percentile | Sample Size | Disability |
[ 0.0% - 0.5% ] 0.066% | 190,846,214 | 12.0% |
[ 0.0% - 0.5% ] 0.33% | 20,066,004 | 12.0% |
[ 0.5% - 1.0% ] 0.58% | 5,628,192 | 12.7% |
[ 0.5% - 1.0% ] 0.82% | 2,549,885 | 12.4% |
[ 1.0% - 1.5% ] 1.08% | 1,257,582 | 12.5% |
[ 1.0% - 1.5% ] 1.29% | 477,459 | 12.5% |
[ 1.5% - 2.0% ] 1.54% | 411,728 | 14.5% |
[ 1.5% - 2.0% ] 1.78% | 203,350 | 13.7% |
[ 2.0% - 2.5% ] 2.04% | 135,549 | 13.4% |
[ 2.0% - 2.5% ] 2.22% | 66,564 | 15.5% |
[ 2.0% - 2.5% ] 2.49% | 49,703 | 11.0% |
[ 2.5% - 3.0% ] 2.74% | 24,712 | 9.6% |
[ 2.5% - 3.0% ] 2.99% | 30,241 | 11.1% |
[ 3.0% - 3.5% ] 3.26% | 27,988 | 10.5% |
[ 3.0% - 3.5% ] 3.45% | 45,984 | 14.3% |
[ 3.5% - 4.0% ] 3.75% | 9,680 | 17.5% |
[ 3.5% - 4.0% ] 3.86% | 4,608 | 11.7% |
[ 4.0% - 4.5% ] 4.19% | 7,782 | 18.0% |
[ 4.0% - 4.5% ] 4.41% | 5,379 | 7.2% |
[ 4.5% - 5.0% ] 4.72% | 25,535 | 10.6% |
[ 4.5% - 5.0% ] 4.88% | 3,748 | 32.0% |
[ 5.0% - 5.5% ] 5.22% | 1,974 | 16.7% |
[ 5.0% - 5.5% ] 5.36% | 261 | 17.6% |
[ 6.0% - 6.5% ] 6.07% | 4,758 | 13.3% |
[ 6.0% - 6.5% ] 6.27% | 1,611 | 16.0% |
[ 6.5% - 7.0% ] 6.65% | 857 | 3.4% |
[ 6.5% - 7.0% ] 6.77% | 1,388 | 26.2% |
[ 7.0% - 7.5% ] 7.27% | 1,211 | 10.7% |
[ 7.5% - 8.0% ] 7.55% | 1,669 | 18.4% |
[ 8.0% - 8.5% ] 8.29% | 5,262 | 16.2% |
[ 9.0% - 9.5% ] 9.30% | 172 | 11.0% |
[ 9.0% - 9.5% ] 9.34% | 578 | 15.9% |
[ 9.5% - 10.0% ] 9.70% | 402 | 8.5% |
[ 10.5% - 11.0% ] 10.74% | 121 | 22.3% |
[ 14.5% - 15.0% ] 14.97% | 294 | 22.8% |
[ 16.0% - 16.5% ] 16.19% | 105 | 16.2% |