Guamanian/Chamorro GED/Equivalency

COMPARE

Guamanian/Chamorro
Race
Ancestry
AfghanAfricanAlaska NativeAlaskan AthabascanAlbanianAleutAlsatianAmericanApacheArabArapahoArgentineanArmenianAssyrian/Chaldean/SyriacAustralianAustrianBahamianBangladeshiBarbadianBasqueBelgianBelizeanBermudanBhutaneseBlackfeetBolivianBrazilianBritishBritish West IndianBulgarianBurmeseCajunCambodianCanadianCape VerdeanCarpatho RusynCelticCentral AmericanCentral American IndianCherokeeCheyenneChickasawChileanChineseChippewaChoctawColombianColvilleComancheCosta RicanCreeCreekCroatianCrowCubanCypriotCzechCzechoslovakianDanishDelawareDominicanDutchDutch West IndianEastern EuropeanEcuadorianEgyptianEnglishEstonianEthiopianEuropeanFijianFilipinoFinnishFrenchFrench American IndianFrench CanadianGermanGerman RussianGhanaianGreekGuamanian/ChamorroGuatemalanGuyaneseHaitianHmongHonduranHopiHoumaHungarianIcelanderIndian (Asian)IndonesianInupiatIranianIraqiIrishIroquoisIsraeliItalianJamaicanJapaneseJordanianKenyanKiowaKoreanLaotianLatvianLebaneseLiberianLithuanianLumbeeLuxembourgerMacedonianMalaysianMalteseMarshalleseMenomineeMexicanMexican American IndianMongolianMoroccanNative HawaiianNavajoNepaleseNew ZealanderNicaraguanNigerianNorthern EuropeanNorwegianOkinawanOsageOttawaPaiutePakistaniPalestinianPanamanianParaguayanPennsylvania GermanPeruvianPimaPolishPortuguesePotawatomiPuebloPuerto RicanPuget Sound SalishRomanianRussianSalvadoranSamoanScandinavianScotch-IrishScottishSeminoleSenegaleseSerbianShoshoneSierra LeoneanSiouxSlavicSlovakSloveneSomaliSouth AfricanSouth AmericanSouth American IndianSoviet UnionSpaniardSpanishSpanish AmericanSpanish American IndianSri LankanSubsaharan AfricanSudaneseSwedishSwissSyrianTaiwaneseThaiTlingit-HaidaTohono O'OdhamTonganTrinidadian and TobagonianTsimshianTurkishU.S. Virgin IslanderUgandanUkrainianUruguayanUteVenezuelanVietnameseWelshWest IndianYakamaYaquiYugoslavianYumanYup'ikZimbabwean
Immigration
NonimmigrantsImmigrantsAfghanistanAfricaAlbaniaArgentinaArmeniaAsiaAustraliaAustriaBahamasBangladeshBarbadosBelarusBelgiumBelizeBoliviaBosnia and HerzegovinaBrazilBulgariaBurma/MyanmarCabo VerdeCambodiaCameroonCanadaCaribbeanCentral AmericaChileChinaColombiaCongoCosta RicaCroatiaCubaCzechoslovakiaDenmarkDominicaDominican RepublicEastern AfricaEastern AsiaEastern EuropeEcuadorEgyptEl SalvadorEnglandEritreaEthiopiaEuropeFijiFranceGermanyGhanaGreeceGrenadaGuatemalaGuyanaHaitiHondurasHong KongHungaryIndiaIndonesiaIranIraqIrelandIsraelItalyJamaicaJapanJordanKazakhstanKenyaKoreaKuwaitLaosLatin AmericaLatviaLebanonLiberiaLithuaniaMalaysiaMexicoMicronesiaMiddle AfricaMoldovaMoroccoNepalNetherlandsNicaraguaNigeriaNorth AmericaNorth MacedoniaNorthern AfricaNorthern EuropeNorwayOceaniaPakistanPanamaPeruPhilippinesPolandPortugalRomaniaRussiaSaudi ArabiaScotlandSenegalSerbiaSierra LeoneSingaporeSomaliaSouth AfricaSouth AmericaSouth Central AsiaSouth Eastern AsiaSouthern EuropeSpainSri LankaSt. Vincent and the GrenadinesSudanSwedenSwitzerlandSyriaTaiwanThailandTrinidad and TobagoTurkeyUgandaUkraineUruguayUzbekistanVenezuelaVietnamWest IndiesWestern AfricaWestern AsiaWestern EuropeYemenZaireZimbabweAzores
Select to Compare
Race
Ancestry
AfghanAfricanAlaska NativeAlaskan AthabascanAlbanianAleutAlsatianAmericanApacheArabArapahoArgentineanArmenianAssyrian/Chaldean/SyriacAustralianAustrianBahamianBangladeshiBarbadianBasqueBelgianBelizeanBermudanBhutaneseBlackfeetBolivianBrazilianBritishBritish West IndianBulgarianBurmeseCajunCambodianCanadianCape VerdeanCarpatho RusynCelticCentral AmericanCentral American IndianCherokeeCheyenneChickasawChileanChineseChippewaChoctawColombianColvilleComancheCosta RicanCreeCreekCroatianCrowCubanCypriotCzechCzechoslovakianDanishDelawareDominicanDutchDutch West IndianEastern EuropeanEcuadorianEgyptianEnglishEstonianEthiopianEuropeanFijianFilipinoFinnishFrenchFrench American IndianFrench CanadianGermanGerman RussianGhanaianGreekGuatemalanGuyaneseHaitianHmongHonduranHopiHoumaHungarianIcelanderIndian (Asian)IndonesianInupiatIranianIraqiIrishIroquoisIsraeliItalianJamaicanJapaneseJordanianKenyanKiowaKoreanLaotianLatvianLebaneseLiberianLithuanianLumbeeLuxembourgerMacedonianMalaysianMalteseMarshalleseMenomineeMexicanMexican American IndianMongolianMoroccanNative HawaiianNavajoNepaleseNew ZealanderNicaraguanNigerianNorthern EuropeanNorwegianOkinawanOsageOttawaPaiutePakistaniPalestinianPanamanianParaguayanPennsylvania GermanPeruvianPimaPolishPortuguesePotawatomiPuebloPuerto RicanPuget Sound SalishRomanianRussianSalvadoranSamoanScandinavianScotch-IrishScottishSeminoleSenegaleseSerbianShoshoneSierra LeoneanSiouxSlavicSlovakSloveneSomaliSouth AfricanSouth AmericanSouth American IndianSoviet UnionSpaniardSpanishSpanish AmericanSpanish American IndianSri LankanSubsaharan AfricanSudaneseSwedishSwissSyrianTaiwaneseThaiTlingit-HaidaTohono O'OdhamTonganTrinidadian and TobagonianTsimshianTurkishU.S. Virgin IslanderUgandanUkrainianUruguayanUteVenezuelanVietnameseWelshWest IndianYakamaYaquiYugoslavianYumanYup'ikZimbabwean
Immigration
NonimmigrantsImmigrantsAfghanistanAfricaAlbaniaArgentinaArmeniaAsiaAustraliaAustriaBahamasBangladeshBarbadosBelarusBelgiumBelizeBoliviaBosnia and HerzegovinaBrazilBulgariaBurma/MyanmarCabo VerdeCambodiaCameroonCanadaCaribbeanCentral AmericaChileChinaColombiaCongoCosta RicaCroatiaCubaCzechoslovakiaDenmarkDominicaDominican RepublicEastern AfricaEastern AsiaEastern EuropeEcuadorEgyptEl SalvadorEnglandEritreaEthiopiaEuropeFijiFranceGermanyGhanaGreeceGrenadaGuatemalaGuyanaHaitiHondurasHong KongHungaryIndiaIndonesiaIranIraqIrelandIsraelItalyJamaicaJapanJordanKazakhstanKenyaKoreaKuwaitLaosLatin AmericaLatviaLebanonLiberiaLithuaniaMalaysiaMexicoMicronesiaMiddle AfricaMoldovaMoroccoNepalNetherlandsNicaraguaNigeriaNorth AmericaNorth MacedoniaNorthern AfricaNorthern EuropeNorwayOceaniaPakistanPanamaPeruPhilippinesPolandPortugalRomaniaRussiaSaudi ArabiaScotlandSenegalSerbiaSierra LeoneSingaporeSomaliaSouth AfricaSouth AmericaSouth Central AsiaSouth Eastern AsiaSouthern EuropeSpainSri LankaSt. Vincent and the GrenadinesSudanSwedenSwitzerlandSyriaTaiwanThailandTrinidad and TobagoTurkeyUgandaUkraineUruguayUzbekistanVenezuelaVietnamWest IndiesWestern AfricaWestern AsiaWestern EuropeYemenZaireZimbabweAzores
GED/Equivalency
Income
Poverty
Unemployment
Labor Participation
Family Structure
Vehicle Availability
Education Level
Disability

Guamanian/Chamorro GED/Equivalency
Fair

85.3%
GED/EQUIVALENCY
28.4/ 100
METRIC RATING
189th/ 347
METRIC RANK

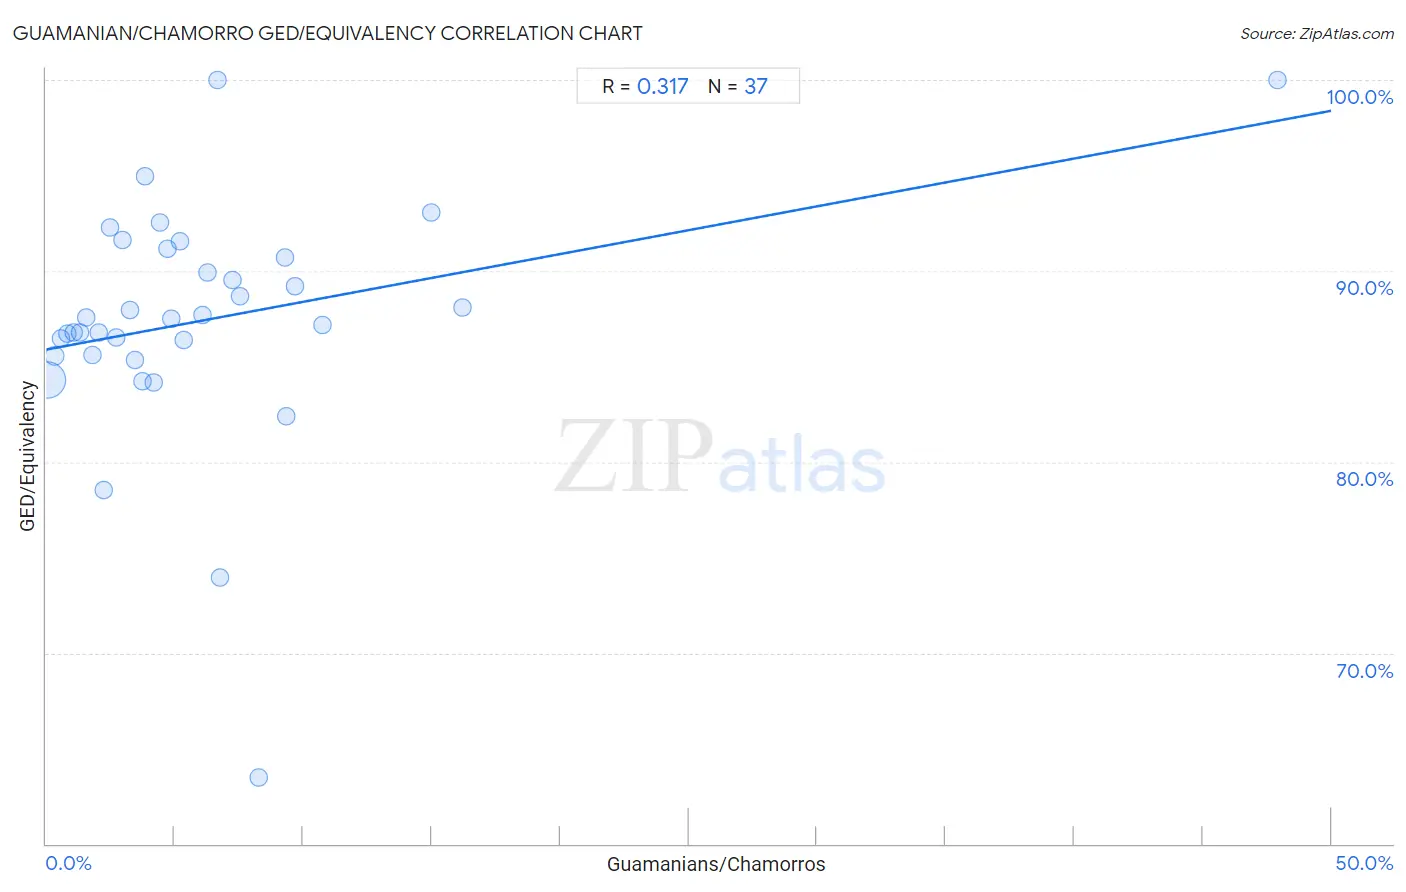
Guamanian/Chamorro GED/Equivalency Correlation Chart

The statistical analysis conducted on geographies consisting of 221,965,618 people shows a mild positive correlation between the proportion of Guamanians/Chamorros and percentage of population with at least ged/equivalency education in the United States with a correlation coefficient (R) of 0.317 and weighted average of 85.3%. On average, for every 1% (one percent) increase in Guamanians/Chamorros within a typical geography, there is an increase of 0.25% in percentage of population with at least ged/equivalency education.
Guamanian/Chamorro GED/Equivalency
It is essential to understand that the correlation between the percentage of Guamanians/Chamorros and percentage of population with at least ged/equivalency education does not imply a direct cause-and-effect relationship. It remains uncertain whether the presence of Guamanians/Chamorros influences an upward or downward trend in the level of percentage of population with at least ged/equivalency education within an area, or if Guamanians/Chamorros simply ended up residing in those areas with higher or lower levels of percentage of population with at least ged/equivalency education due to other factors.

Demographics Similar to Guamanians/Chamorros by GED/Equivalency

In terms of ged/equivalency, the demographic groups most similar to Guamanians/Chamorros are Immigrants from Sierra Leone (85.4%, a difference of 0.010%), Alaskan Athabascan (85.3%, a difference of 0.020%), Immigrants from Afghanistan (85.4%, a difference of 0.030%), Spaniard (85.4%, a difference of 0.090%), and Spanish (85.4%, a difference of 0.11%).
DemographicsRating | RankGED/Equivalency
Sudanese
35.2
/100
|
#182
Fair
85.5%
Immigrants from Sudan
34.2
/100
|
#183
Fair
85.5%
Immigrants from Oceania
33.6
/100
|
#184
Fair
85.5%
Spanish
32.8
/100
|
#185
Fair
85.4%
Spaniards
31.9
/100
|
#186
Fair
85.4%
Immigrants from Afghanistan
29.8
/100
|
#187
Fair
85.4%
Immigrants from Sierra Leone
29.0
/100
|
#188
Fair
85.4%
Guamanians/Chamorros
28.4
/100
|
#189
Fair
85.3%
Alaskan Athabascans
27.5
/100
|
#190
Fair
85.3%
South American Indians
22.8
/100
|
#191
Fair
85.2%
Nonimmigrants
22.7
/100
|
#192
Fair
85.2%
Delaware
22.2
/100
|
#193
Fair
85.2%
Puget Sound Salish
20.8
/100
|
#194
Fair
85.2%
Chippewa
20.8
/100
|
#195
Fair
85.2%
Tongans
20.7
/100
|
#196
Fair
85.2%

Guamanian/Chamorro GED/Equivalency Correlation Summary

MeasurementGuamanian/Chamorro DataGED/Equivalency Data
Minimum0.066%63.5%
Maximum47.9%100.0%
Range47.8%36.5%
Mean6.2%87.4%
Median4.4%87.5%
Interquartile 25% (IQ1)2.1%85.6%
Interquartile 75% (IQ3)7.4%90.9%
Interquartile Range (IQR)5.3%5.3%
Standard Deviation (Sample)8.0%6.3%
Standard Deviation (Population)7.9%6.2%

Correlation Details

Guamanian/Chamorro PercentileSample SizeGED/Equivalency
[
0.0%
-
0.5%
]
0.066%
190,874,62484.3%
[
0.0%
-
0.5%
]
0.33%
20,076,61585.5%
[
0.5%
-
1.0%
]
0.58%
5,638,92086.4%
[
0.5%
-
1.0%
]
0.82%
2,559,51586.7%
[
1.0%
-
1.5%
]
1.08%
1,257,93986.8%
[
1.0%
-
1.5%
]
1.29%
482,95586.8%
[
1.5%
-
2.0%
]
1.54%
411,41987.6%
[
1.5%
-
2.0%
]
1.78%
203,35085.6%
[
2.0%
-
2.5%
]
2.04%
135,64286.8%
[
2.0%
-
2.5%
]
2.22%
66,56478.6%
[
2.0%
-
2.5%
]
2.49%
49,70392.3%
[
2.5%
-
3.0%
]
2.74%
25,51986.5%
[
2.5%
-
3.0%
]
2.99%
30,24191.6%
[
3.0%
-
3.5%
]
3.26%
27,98888.0%
[
3.0%
-
3.5%
]
3.45%
45,98485.4%
[
3.5%
-
4.0%
]
3.75%
10,77584.2%
[
3.5%
-
4.0%
]
3.86%
4,60895.0%
[
4.0%
-
4.5%
]
4.19%
7,78284.1%
[
4.0%
-
4.5%
]
4.41%
5,37992.5%
[
4.5%
-
5.0%
]
4.72%
25,53591.1%
[
4.5%
-
5.0%
]
4.88%
3,74887.5%
[
5.0%
-
5.5%
]
5.22%
1,97491.5%
[
5.0%
-
5.5%
]
5.36%
26186.4%
[
6.0%
-
6.5%
]
6.07%
4,75887.7%
[
6.0%
-
6.5%
]
6.27%
1,64289.9%
[
6.5%
-
7.0%
]
6.65%
857100.0%
[
6.5%
-
7.0%
]
6.77%
1,38874.0%
[
7.0%
-
7.5%
]
7.27%
1,21189.5%
[
7.5%
-
8.0%
]
7.55%
1,66988.7%
[
8.0%
-
8.5%
]
8.29%
5,26263.5%
[
9.0%
-
9.5%
]
9.30%
17290.7%
[
9.0%
-
9.5%
]
9.34%
57882.4%
[
9.5%
-
10.0%
]
9.70%
40289.2%
[
10.5%
-
11.0%
]
10.74%
12187.2%
[
14.5%
-
15.0%
]
14.97%
29493.1%
[
16.0%
-
16.5%
]
16.19%
10588.1%
[
47.5%
-
48.0%
]
47.90%
119100.0%