Guamanian/Chamorro 4 or more Vehicles in Household
COMPARE
Guamanian/Chamorro
Select to Compare
4 or more Vehicles in Household
Guamanian/Chamorro 4 or more Vehicles in Household
8.1%
4+ VEHICLES AVAILABLE
100.0/ 100
METRIC RATING
35th/ 347
METRIC RANK
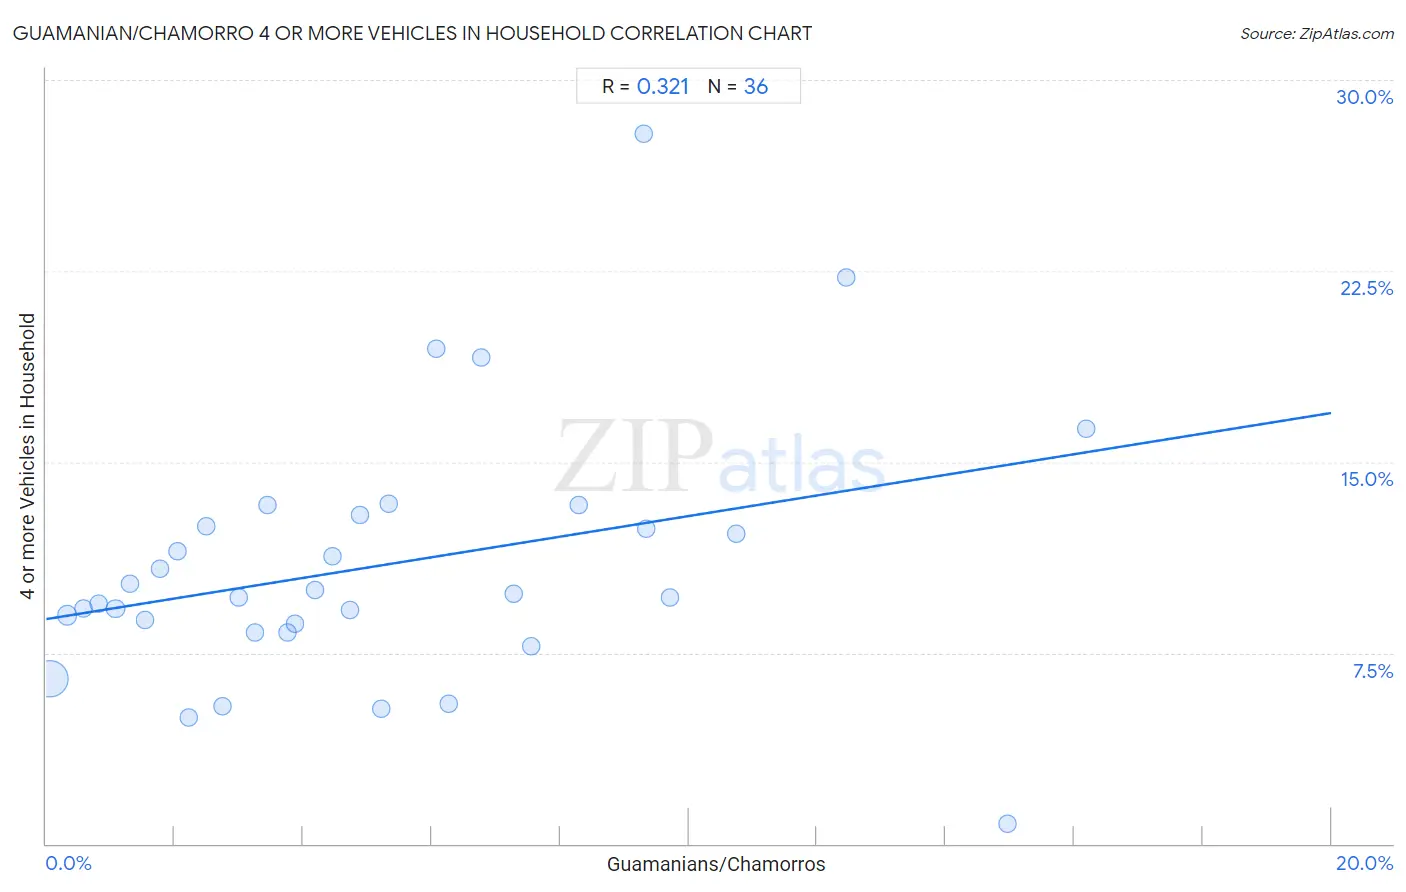
Guamanian/Chamorro 4 or more Vehicles in Household Correlation Chart
The statistical analysis conducted on geographies consisting of 221,490,989 people shows a mild positive correlation between the proportion of Guamanians/Chamorros and percentage of households with 4 or more vehicles available in the United States with a correlation coefficient (R) of 0.321 and weighted average of 8.1%. On average, for every 1% (one percent) increase in Guamanians/Chamorros within a typical geography, there is an increase of 0.40% in percentage of households with 4 or more vehicles available.
It is essential to understand that the correlation between the percentage of Guamanians/Chamorros and percentage of households with 4 or more vehicles available does not imply a direct cause-and-effect relationship. It remains uncertain whether the presence of Guamanians/Chamorros influences an upward or downward trend in the level of percentage of households with 4 or more vehicles available within an area, or if Guamanians/Chamorros simply ended up residing in those areas with higher or lower levels of percentage of households with 4 or more vehicles available due to other factors.
Demographics Similar to Guamanians/Chamorros by 4 or more Vehicles in Household
In terms of 4 or more vehicles in household, the demographic groups most similar to Guamanians/Chamorros are Alaskan Athabascan (8.1%, a difference of 0.20%), Norwegian (8.0%, a difference of 0.79%), Yaqui (8.1%, a difference of 0.80%), Scandinavian (8.0%, a difference of 0.96%), and Sioux (8.0%, a difference of 0.99%).
| Demographics | Rating | Rank | 4 or more Vehicles in Household |
| Cheyenne | 100.0 /100 | #28 | Exceptional 8.3% |
| Immigrants from South Eastern Asia | 100.0 /100 | #29 | Exceptional 8.2% |
| Navajo | 100.0 /100 | #30 | Exceptional 8.2% |
| Natives/Alaskans | 100.0 /100 | #31 | Exceptional 8.2% |
| Marshallese | 100.0 /100 | #32 | Exceptional 8.1% |
| Yaqui | 100.0 /100 | #33 | Exceptional 8.1% |
| Alaskan Athabascans | 100.0 /100 | #34 | Exceptional 8.1% |
| Guamanians/Chamorros | 100.0 /100 | #35 | Exceptional 8.1% |
| Norwegians | 100.0 /100 | #36 | Exceptional 8.0% |
| Scandinavians | 100.0 /100 | #37 | Exceptional 8.0% |
| Sioux | 100.0 /100 | #38 | Exceptional 8.0% |
| Spanish Americans | 100.0 /100 | #39 | Exceptional 8.0% |
| Spanish | 100.0 /100 | #40 | Exceptional 7.9% |
| Pima | 100.0 /100 | #41 | Exceptional 7.9% |
| Salvadorans | 100.0 /100 | #42 | Exceptional 7.8% |
Guamanian/Chamorro 4 or more Vehicles in Household Correlation Summary
| Measurement | Guamanian/Chamorro Data | 4 or more Vehicles in Household Data |
| Minimum | 0.066% | 0.81% |
| Maximum | 16.2% | 27.9% |
| Range | 16.1% | 27.1% |
| Mean | 5.2% | 10.9% |
| Median | 4.3% | 9.7% |
| Interquartile 25% (IQ1) | 2.1% | 8.5% |
| Interquartile 75% (IQ3) | 7.4% | 12.7% |
| Interquartile Range (IQR) | 5.3% | 4.2% |
| Standard Deviation (Sample) | 4.1% | 5.1% |
| Standard Deviation (Population) | 4.0% | 5.0% |
Correlation Details
| Guamanian/Chamorro Percentile | Sample Size | 4 or more Vehicles in Household |
[ 0.0% - 0.5% ] 0.066% | 190,626,422 | 6.5% |
[ 0.0% - 0.5% ] 0.33% | 20,013,612 | 9.0% |
[ 0.5% - 1.0% ] 0.58% | 5,572,812 | 9.2% |
[ 0.5% - 1.0% ] 0.82% | 2,539,956 | 9.4% |
[ 1.0% - 1.5% ] 1.08% | 1,211,082 | 9.2% |
[ 1.0% - 1.5% ] 1.30% | 467,858 | 10.2% |
[ 1.5% - 2.0% ] 1.54% | 408,836 | 8.8% |
[ 1.5% - 2.0% ] 1.78% | 203,350 | 10.8% |
[ 2.0% - 2.5% ] 2.04% | 135,023 | 11.5% |
[ 2.0% - 2.5% ] 2.22% | 66,264 | 5.0% |
[ 2.0% - 2.5% ] 2.49% | 48,937 | 12.5% |
[ 2.5% - 3.0% ] 2.74% | 24,329 | 5.4% |
[ 2.5% - 3.0% ] 3.00% | 28,022 | 9.7% |
[ 3.0% - 3.5% ] 3.26% | 27,988 | 8.3% |
[ 3.0% - 3.5% ] 3.45% | 45,984 | 13.3% |
[ 3.5% - 4.0% ] 3.75% | 9,680 | 8.3% |
[ 3.5% - 4.0% ] 3.87% | 2,299 | 8.7% |
[ 4.0% - 4.5% ] 4.19% | 7,782 | 10.0% |
[ 4.0% - 4.5% ] 4.45% | 1,506 | 11.3% |
[ 4.5% - 5.0% ] 4.72% | 25,535 | 9.2% |
[ 4.5% - 5.0% ] 4.88% | 3,748 | 12.9% |
[ 5.0% - 5.5% ] 5.22% | 1,974 | 5.3% |
[ 5.0% - 5.5% ] 5.33% | 75 | 13.3% |
[ 6.0% - 6.5% ] 6.07% | 4,758 | 19.4% |
[ 6.0% - 6.5% ] 6.27% | 1,642 | 5.5% |
[ 6.5% - 7.0% ] 6.77% | 1,388 | 19.1% |
[ 7.0% - 7.5% ] 7.27% | 1,211 | 9.8% |
[ 7.5% - 8.0% ] 7.55% | 1,669 | 7.8% |
[ 8.0% - 8.5% ] 8.29% | 5,262 | 13.3% |
[ 9.0% - 9.5% ] 9.30% | 172 | 27.9% |
[ 9.0% - 9.5% ] 9.34% | 578 | 12.4% |
[ 9.5% - 10.0% ] 9.70% | 402 | 9.7% |
[ 10.5% - 11.0% ] 10.74% | 121 | 12.2% |
[ 12.0% - 12.5% ] 12.46% | 313 | 22.2% |
[ 14.5% - 15.0% ] 14.97% | 294 | 0.81% |
[ 16.0% - 16.5% ] 16.19% | 105 | 16.3% |