Guamanian/Chamorro Disability Age Over 75

COMPARE

Guamanian/Chamorro
Race
Ancestry
AfghanAfricanAlaska NativeAlaskan AthabascanAlbanianAleutAlsatianAmericanApacheArabArapahoArgentineanArmenianAssyrian/Chaldean/SyriacAustralianAustrianBahamianBangladeshiBarbadianBasqueBelgianBelizeanBermudanBhutaneseBlackfeetBolivianBrazilianBritishBritish West IndianBulgarianBurmeseCajunCambodianCanadianCape VerdeanCarpatho RusynCelticCentral AmericanCentral American IndianCherokeeCheyenneChickasawChileanChineseChippewaChoctawColombianColvilleComancheCosta RicanCreeCreekCroatianCrowCubanCypriotCzechCzechoslovakianDanishDelawareDominicanDutchDutch West IndianEastern EuropeanEcuadorianEgyptianEnglishEstonianEthiopianEuropeanFijianFilipinoFinnishFrenchFrench American IndianFrench CanadianGermanGerman RussianGhanaianGreekGuamanian/ChamorroGuatemalanGuyaneseHaitianHmongHonduranHopiHoumaHungarianIcelanderIndian (Asian)IndonesianInupiatIranianIraqiIrishIroquoisIsraeliItalianJamaicanJapaneseJordanianKenyanKiowaKoreanLaotianLatvianLebaneseLiberianLithuanianLumbeeLuxembourgerMacedonianMalaysianMalteseMarshalleseMenomineeMexicanMexican American IndianMongolianMoroccanNative HawaiianNavajoNepaleseNew ZealanderNicaraguanNigerianNorthern EuropeanNorwegianOkinawanOsageOttawaPaiutePakistaniPalestinianPanamanianParaguayanPennsylvania GermanPeruvianPimaPolishPortuguesePotawatomiPuebloPuerto RicanPuget Sound SalishRomanianRussianSalvadoranSamoanScandinavianScotch-IrishScottishSeminoleSenegaleseSerbianShoshoneSierra LeoneanSiouxSlavicSlovakSloveneSomaliSouth AfricanSouth AmericanSouth American IndianSoviet UnionSpaniardSpanishSpanish AmericanSpanish American IndianSri LankanSubsaharan AfricanSudaneseSwedishSwissSyrianTaiwaneseThaiTlingit-HaidaTohono O'OdhamTonganTrinidadian and TobagonianTsimshianTurkishU.S. Virgin IslanderUgandanUkrainianUruguayanUteVenezuelanVietnameseWelshWest IndianYakamaYaquiYugoslavianYumanYup'ikZimbabwean
Immigration
NonimmigrantsImmigrantsAfghanistanAfricaAlbaniaArgentinaArmeniaAsiaAustraliaAustriaBahamasBangladeshBarbadosBelarusBelgiumBelizeBoliviaBosnia and HerzegovinaBrazilBulgariaBurma/MyanmarCabo VerdeCambodiaCameroonCanadaCaribbeanCentral AmericaChileChinaColombiaCongoCosta RicaCroatiaCubaCzechoslovakiaDenmarkDominicaDominican RepublicEastern AfricaEastern AsiaEastern EuropeEcuadorEgyptEl SalvadorEnglandEritreaEthiopiaEuropeFijiFranceGermanyGhanaGreeceGrenadaGuatemalaGuyanaHaitiHondurasHong KongHungaryIndiaIndonesiaIranIraqIrelandIsraelItalyJamaicaJapanJordanKazakhstanKenyaKoreaKuwaitLaosLatin AmericaLatviaLebanonLiberiaLithuaniaMalaysiaMexicoMicronesiaMiddle AfricaMoldovaMoroccoNepalNetherlandsNicaraguaNigeriaNorth AmericaNorth MacedoniaNorthern AfricaNorthern EuropeNorwayOceaniaPakistanPanamaPeruPhilippinesPolandPortugalRomaniaRussiaSaudi ArabiaScotlandSenegalSerbiaSierra LeoneSingaporeSomaliaSouth AfricaSouth AmericaSouth Central AsiaSouth Eastern AsiaSouthern EuropeSpainSri LankaSt. Vincent and the GrenadinesSudanSwedenSwitzerlandSyriaTaiwanThailandTrinidad and TobagoTurkeyUgandaUkraineUruguayUzbekistanVenezuelaVietnamWest IndiesWestern AfricaWestern AsiaWestern EuropeYemenZaireZimbabweAzores
Select to Compare
Race
Ancestry
AfghanAfricanAlaska NativeAlaskan AthabascanAlbanianAleutAlsatianAmericanApacheArabArapahoArgentineanArmenianAssyrian/Chaldean/SyriacAustralianAustrianBahamianBangladeshiBarbadianBasqueBelgianBelizeanBermudanBhutaneseBlackfeetBolivianBrazilianBritishBritish West IndianBulgarianBurmeseCajunCambodianCanadianCape VerdeanCarpatho RusynCelticCentral AmericanCentral American IndianCherokeeCheyenneChickasawChileanChineseChippewaChoctawColombianColvilleComancheCosta RicanCreeCreekCroatianCrowCubanCypriotCzechCzechoslovakianDanishDelawareDominicanDutchDutch West IndianEastern EuropeanEcuadorianEgyptianEnglishEstonianEthiopianEuropeanFijianFilipinoFinnishFrenchFrench American IndianFrench CanadianGermanGerman RussianGhanaianGreekGuatemalanGuyaneseHaitianHmongHonduranHopiHoumaHungarianIcelanderIndian (Asian)IndonesianInupiatIranianIraqiIrishIroquoisIsraeliItalianJamaicanJapaneseJordanianKenyanKiowaKoreanLaotianLatvianLebaneseLiberianLithuanianLumbeeLuxembourgerMacedonianMalaysianMalteseMarshalleseMenomineeMexicanMexican American IndianMongolianMoroccanNative HawaiianNavajoNepaleseNew ZealanderNicaraguanNigerianNorthern EuropeanNorwegianOkinawanOsageOttawaPaiutePakistaniPalestinianPanamanianParaguayanPennsylvania GermanPeruvianPimaPolishPortuguesePotawatomiPuebloPuerto RicanPuget Sound SalishRomanianRussianSalvadoranSamoanScandinavianScotch-IrishScottishSeminoleSenegaleseSerbianShoshoneSierra LeoneanSiouxSlavicSlovakSloveneSomaliSouth AfricanSouth AmericanSouth American IndianSoviet UnionSpaniardSpanishSpanish AmericanSpanish American IndianSri LankanSubsaharan AfricanSudaneseSwedishSwissSyrianTaiwaneseThaiTlingit-HaidaTohono O'OdhamTonganTrinidadian and TobagonianTsimshianTurkishU.S. Virgin IslanderUgandanUkrainianUruguayanUteVenezuelanVietnameseWelshWest IndianYakamaYaquiYugoslavianYumanYup'ikZimbabwean
Immigration
NonimmigrantsImmigrantsAfghanistanAfricaAlbaniaArgentinaArmeniaAsiaAustraliaAustriaBahamasBangladeshBarbadosBelarusBelgiumBelizeBoliviaBosnia and HerzegovinaBrazilBulgariaBurma/MyanmarCabo VerdeCambodiaCameroonCanadaCaribbeanCentral AmericaChileChinaColombiaCongoCosta RicaCroatiaCubaCzechoslovakiaDenmarkDominicaDominican RepublicEastern AfricaEastern AsiaEastern EuropeEcuadorEgyptEl SalvadorEnglandEritreaEthiopiaEuropeFijiFranceGermanyGhanaGreeceGrenadaGuatemalaGuyanaHaitiHondurasHong KongHungaryIndiaIndonesiaIranIraqIrelandIsraelItalyJamaicaJapanJordanKazakhstanKenyaKoreaKuwaitLaosLatin AmericaLatviaLebanonLiberiaLithuaniaMalaysiaMexicoMicronesiaMiddle AfricaMoldovaMoroccoNepalNetherlandsNicaraguaNigeriaNorth AmericaNorth MacedoniaNorthern AfricaNorthern EuropeNorwayOceaniaPakistanPanamaPeruPhilippinesPolandPortugalRomaniaRussiaSaudi ArabiaScotlandSenegalSerbiaSierra LeoneSingaporeSomaliaSouth AfricaSouth AmericaSouth Central AsiaSouth Eastern AsiaSouthern EuropeSpainSri LankaSt. Vincent and the GrenadinesSudanSwedenSwitzerlandSyriaTaiwanThailandTrinidad and TobagoTurkeyUgandaUkraineUruguayUzbekistanVenezuelaVietnamWest IndiesWestern AfricaWestern AsiaWestern EuropeYemenZaireZimbabweAzores
Disability Age Over 75
Income
Poverty
Unemployment
Labor Participation
Family Structure
Vehicle Availability
Education Level
Disability

Guamanian/Chamorro Disability Age Over 75
Tragic

49.4%
DISABILITY | AGE OVER 75
0.0/ 100
METRIC RATING
279th/ 347
METRIC RANK

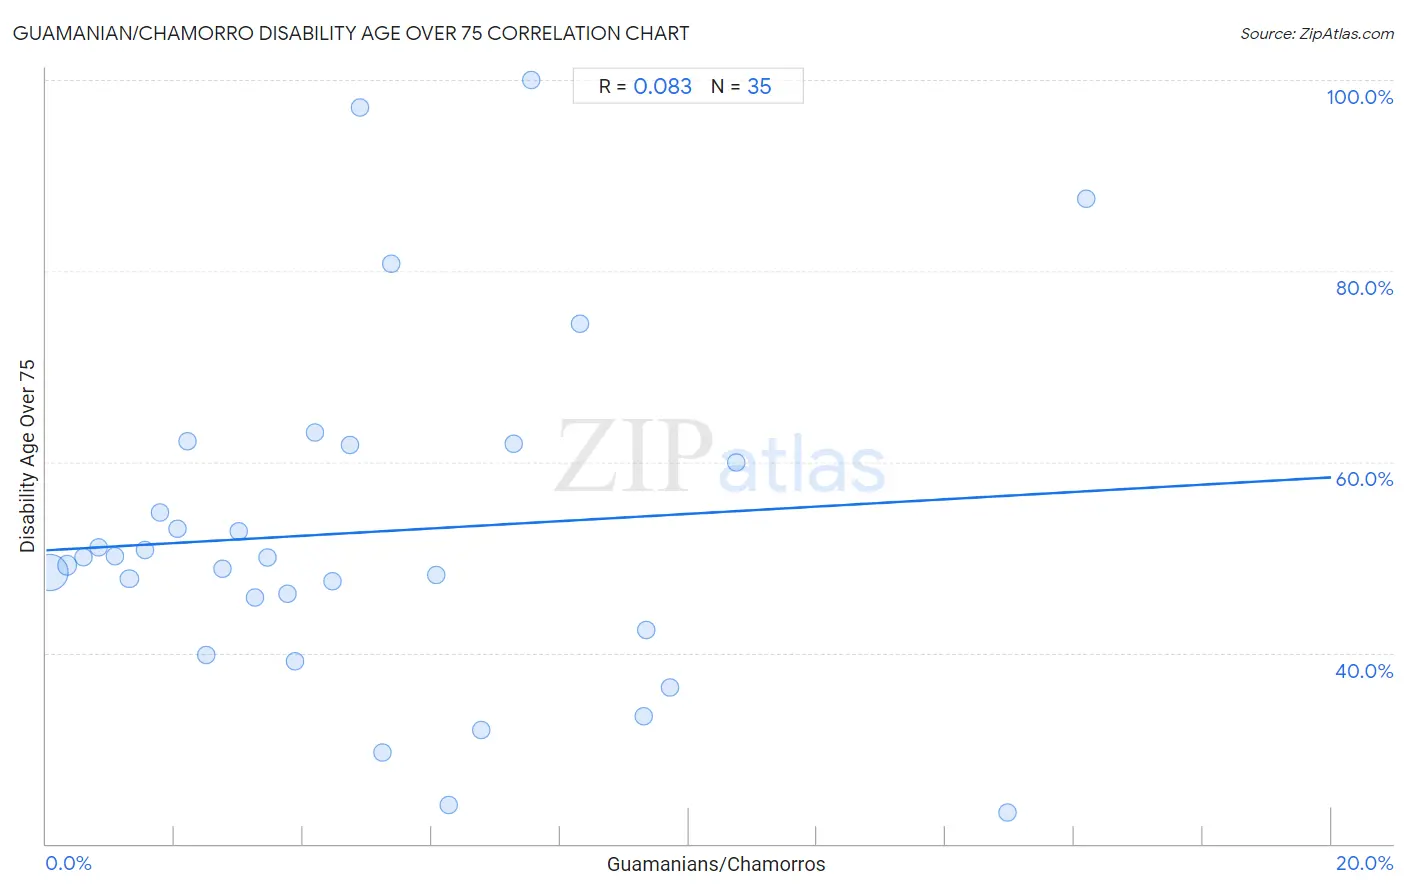
Guamanian/Chamorro Disability Age Over 75 Correlation Chart

The statistical analysis conducted on geographies consisting of 221,408,393 people shows a slight positive correlation between the proportion of Guamanians/Chamorros and percentage of population with a disability over the age of 75 in the United States with a correlation coefficient (R) of 0.083 and weighted average of 49.4%. On average, for every 1% (one percent) increase in Guamanians/Chamorros within a typical geography, there is an increase of 0.38% in percentage of population with a disability over the age of 75.
Guamanian/Chamorro Disability Age Over 75
It is essential to understand that the correlation between the percentage of Guamanians/Chamorros and percentage of population with a disability over the age of 75 does not imply a direct cause-and-effect relationship. It remains uncertain whether the presence of Guamanians/Chamorros influences an upward or downward trend in the level of percentage of population with a disability over the age of 75 within an area, or if Guamanians/Chamorros simply ended up residing in those areas with higher or lower levels of percentage of population with a disability over the age of 75 due to other factors.

Demographics Similar to Guamanians/Chamorros by Disability Age Over 75

In terms of disability age over 75, the demographic groups most similar to Guamanians/Chamorros are Bangladeshi (49.4%, a difference of 0.060%), Belizean (49.4%, a difference of 0.070%), Black/African American (49.5%, a difference of 0.21%), Samoan (49.5%, a difference of 0.24%), and Immigrants from Latin America (49.5%, a difference of 0.29%).
DemographicsRating | RankDisability Age Over 75
Assyrians/Chaldeans/Syriacs
0.2
/100
|
#272
Tragic
49.1%
Immigrants from Iraq
0.1
/100
|
#273
Tragic
49.1%
Immigrants from Guatemala
0.1
/100
|
#274
Tragic
49.1%
Immigrants from Dominica
0.1
/100
|
#275
Tragic
49.1%
Immigrants from Uzbekistan
0.1
/100
|
#276
Tragic
49.2%
Hawaiians
0.1
/100
|
#277
Tragic
49.2%
Immigrants from Laos
0.1
/100
|
#278
Tragic
49.2%
Guamanians/Chamorros
0.0
/100
|
#279
Tragic
49.4%
Bangladeshis
0.0
/100
|
#280
Tragic
49.4%
Belizeans
0.0
/100
|
#281
Tragic
49.4%
Blacks/African Americans
0.0
/100
|
#282
Tragic
49.5%
Samoans
0.0
/100
|
#283
Tragic
49.5%
Immigrants from Latin America
0.0
/100
|
#284
Tragic
49.5%
Crow
0.0
/100
|
#285
Tragic
49.6%
Immigrants from Belize
0.0
/100
|
#286
Tragic
49.6%

Guamanian/Chamorro Disability Age Over 75 Correlation Summary

MeasurementGuamanian/Chamorro DataDisability Age Over 75 Data
Minimum0.066%23.3%
Maximum16.2%100.0%
Range16.1%76.7%
Mean5.0%52.7%
Median4.2%50.0%
Interquartile 25% (IQ1)2.0%42.4%
Interquartile 75% (IQ3)7.3%61.7%
Interquartile Range (IQR)5.2%19.3%
Standard Deviation (Sample)3.9%18.1%
Standard Deviation (Population)3.9%17.8%

Correlation Details

Guamanian/Chamorro PercentileSample SizeDisability Age Over 75
[
0.0%
-
0.5%
]
0.066%
190,767,37048.5%
[
0.0%
-
0.5%
]
0.33%
19,930,17749.2%
[
0.5%
-
1.0%
]
0.58%
5,524,17050.0%
[
0.5%
-
1.0%
]
0.82%
2,499,07151.0%
[
1.0%
-
1.5%
]
1.08%
1,201,25950.1%
[
1.0%
-
1.5%
]
1.29%
440,42647.8%
[
1.5%
-
2.0%
]
1.54%
408,83650.8%
[
1.5%
-
2.0%
]
1.78%
203,35054.7%
[
2.0%
-
2.5%
]
2.04%
135,54952.9%
[
2.0%
-
2.5%
]
2.20%
57,60362.2%
[
2.0%
-
2.5%
]
2.49%
48,93739.8%
[
2.5%
-
3.0%
]
2.74%
24,71248.8%
[
2.5%
-
3.0%
]
2.99%
24,06052.8%
[
3.0%
-
3.5%
]
3.26%
27,98845.8%
[
3.0%
-
3.5%
]
3.45%
45,98450.0%
[
3.5%
-
4.0%
]
3.75%
9,68046.2%
[
3.5%
-
4.0%
]
3.87%
2,29939.2%
[
4.0%
-
4.5%
]
4.19%
7,78263.1%
[
4.0%
-
4.5%
]
4.45%
1,50647.4%
[
4.5%
-
5.0%
]
4.72%
25,13761.7%
[
4.5%
-
5.0%
]
4.88%
3,74897.2%
[
5.0%
-
5.5%
]
5.23%
1,60629.6%
[
5.0%
-
5.5%
]
5.38%
18680.8%
[
6.0%
-
6.5%
]
6.07%
4,75848.1%
[
6.0%
-
6.5%
]
6.27%
1,61124.1%
[
6.5%
-
7.0%
]
6.77%
1,38831.9%
[
7.0%
-
7.5%
]
7.27%
1,21161.8%
[
7.5%
-
8.0%
]
7.55%
1,669100.0%
[
8.0%
-
8.5%
]
8.30%
4,64874.5%
[
9.0%
-
9.5%
]
9.30%
17233.3%
[
9.0%
-
9.5%
]
9.34%
57842.4%
[
9.5%
-
10.0%
]
9.70%
40236.4%
[
10.5%
-
11.0%
]
10.74%
12160.0%
[
14.5%
-
15.0%
]
14.97%
29423.3%
[
16.0%
-
16.5%
]
16.19%
10587.5%