Pueblo Self-Care Disability
COMPARE
Pueblo
Select to Compare
Self-Care Disability
Pueblo Self-Care Disability
3.3%
SELF-CARE DISABILITY
0.0/ 100
METRIC RATING
344th/ 347
METRIC RANK
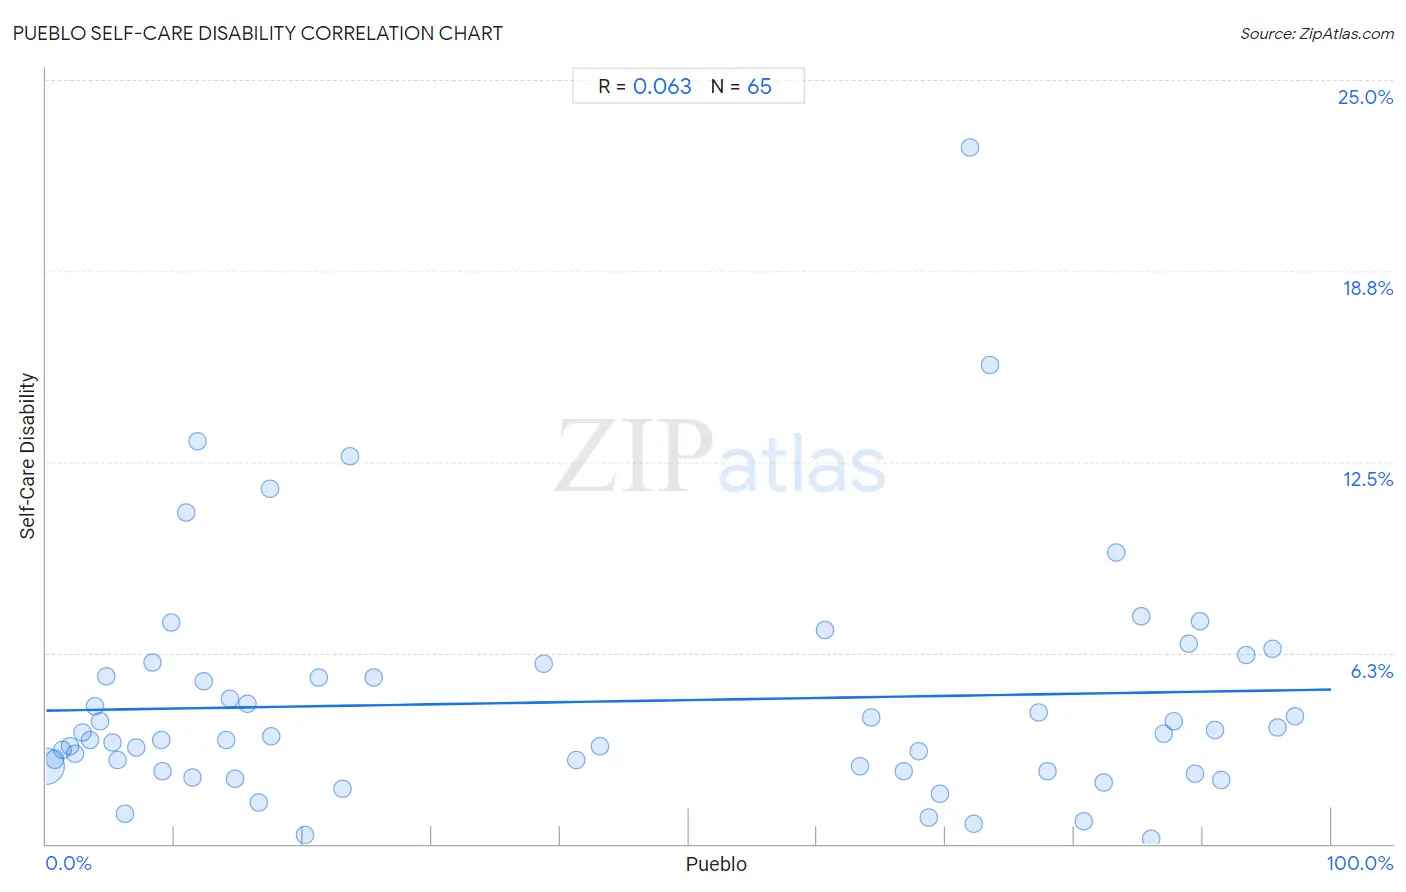
Pueblo Self-Care Disability Correlation Chart
The statistical analysis conducted on geographies consisting of 120,015,705 people shows a slight positive correlation between the proportion of Pueblo and percentage of population with self-care disability in the United States with a correlation coefficient (R) of 0.063 and weighted average of 3.3%. On average, for every 1% (one percent) increase in Pueblo within a typical geography, there is an increase of 0.0069% in percentage of population with self-care disability.
It is essential to understand that the correlation between the percentage of Pueblo and percentage of population with self-care disability does not imply a direct cause-and-effect relationship. It remains uncertain whether the presence of Pueblo influences an upward or downward trend in the level of percentage of population with self-care disability within an area, or if Pueblo simply ended up residing in those areas with higher or lower levels of percentage of population with self-care disability due to other factors.
Demographics Similar to Pueblo by Self-Care Disability
In terms of self-care disability, the demographic groups most similar to Pueblo are Armenian (3.4%, a difference of 4.5%), Tohono O'odham (3.1%, a difference of 4.6%), Colville (3.1%, a difference of 4.7%), Dominican (3.1%, a difference of 6.4%), and Immigrants from Cabo Verde (3.1%, a difference of 6.7%).
| Demographics | Rating | Rank | Self-Care Disability |
| Dutch West Indians | 0.0 /100 | #333 | Tragic 3.0% |
| Houma | 0.0 /100 | #334 | Tragic 3.0% |
| Immigrants from the Azores | 0.0 /100 | #335 | Tragic 3.0% |
| Immigrants from Yemen | 0.0 /100 | #336 | Tragic 3.0% |
| Choctaw | 0.0 /100 | #337 | Tragic 3.0% |
| Cape Verdeans | 0.0 /100 | #338 | Tragic 3.0% |
| Immigrants from Dominican Republic | 0.0 /100 | #339 | Tragic 3.0% |
| Immigrants from Cabo Verde | 0.0 /100 | #340 | Tragic 3.1% |
| Dominicans | 0.0 /100 | #341 | Tragic 3.1% |
| Colville | 0.0 /100 | #342 | Tragic 3.1% |
| Tohono O'odham | 0.0 /100 | #343 | Tragic 3.1% |
| Pueblo | 0.0 /100 | #344 | Tragic 3.3% |
| Armenians | 0.0 /100 | #345 | Tragic 3.4% |
| Puerto Ricans | 0.0 /100 | #346 | Tragic 3.7% |
| Immigrants from Armenia | 0.0 /100 | #347 | Tragic 4.2% |
Pueblo Self-Care Disability Correlation Summary
| Measurement | Pueblo Data | Self-Care Disability Data |
| Minimum | 0.045% | 0.17% |
| Maximum | 97.2% | 22.8% |
| Range | 97.2% | 22.6% |
| Mean | 42.1% | 4.7% |
| Median | 23.6% | 3.5% |
| Interquartile 25% (IQ1) | 9.0% | 2.4% |
| Interquartile 75% (IQ3) | 79.3% | 5.7% |
| Interquartile Range (IQR) | 70.4% | 3.3% |
| Standard Deviation (Sample) | 35.5% | 3.9% |
| Standard Deviation (Population) | 35.3% | 3.8% |
Correlation Details
| Pueblo Percentile | Sample Size | Self-Care Disability |
[ 0.0% - 0.5% ] 0.045% | 116,640,750 | 2.5% |
[ 0.5% - 1.0% ] 0.68% | 1,447,450 | 2.8% |
[ 1.0% - 1.5% ] 1.28% | 1,221,215 | 3.1% |
[ 1.5% - 2.0% ] 1.81% | 264,246 | 3.2% |
[ 2.0% - 2.5% ] 2.19% | 29,140 | 2.9% |
[ 2.5% - 3.0% ] 2.85% | 102,313 | 3.6% |
[ 3.0% - 3.5% ] 3.39% | 6,402 | 3.4% |
[ 3.5% - 4.0% ] 3.77% | 11,232 | 4.5% |
[ 4.0% - 4.5% ] 4.18% | 119,809 | 4.0% |
[ 4.5% - 5.0% ] 4.64% | 11,534 | 5.5% |
[ 5.0% - 5.5% ] 5.16% | 6,450 | 3.3% |
[ 5.5% - 6.0% ] 5.50% | 1,454 | 2.7% |
[ 6.0% - 6.5% ] 6.10% | 2,902 | 0.97% |
[ 7.0% - 7.5% ] 7.00% | 20,354 | 3.1% |
[ 8.0% - 8.5% ] 8.25% | 388 | 6.0% |
[ 8.5% - 9.0% ] 8.92% | 17,771 | 3.4% |
[ 9.0% - 9.5% ] 9.00% | 422 | 2.4% |
[ 9.5% - 10.0% ] 9.69% | 1,063 | 7.2% |
[ 10.5% - 11.0% ] 10.91% | 1,549 | 10.9% |
[ 11.0% - 11.5% ] 11.40% | 1,790 | 2.2% |
[ 11.5% - 12.0% ] 11.81% | 237 | 13.2% |
[ 12.0% - 12.5% ] 12.24% | 776 | 5.3% |
[ 13.5% - 14.0% ] 13.97% | 11,614 | 3.4% |
[ 14.0% - 14.5% ] 14.30% | 3,894 | 4.7% |
[ 14.5% - 15.0% ] 14.72% | 15,895 | 2.1% |
[ 15.5% - 16.0% ] 15.69% | 1,472 | 4.6% |
[ 16.5% - 17.0% ] 16.52% | 932 | 1.3% |
[ 17.0% - 17.5% ] 17.42% | 310 | 11.6% |
[ 17.5% - 18.0% ] 17.50% | 1,914 | 3.5% |
[ 20.0% - 20.5% ] 20.14% | 422 | 0.27% |
[ 21.0% - 21.5% ] 21.20% | 2,165 | 5.5% |
[ 23.0% - 23.5% ] 23.03% | 2,336 | 1.8% |
[ 23.5% - 24.0% ] 23.61% | 610 | 12.7% |
[ 25.5% - 26.0% ] 25.52% | 5,675 | 5.4% |
[ 38.5% - 39.0% ] 38.72% | 3,817 | 5.9% |
[ 41.0% - 41.5% ] 41.23% | 2,906 | 2.7% |
[ 43.0% - 43.5% ] 43.06% | 922 | 3.2% |
[ 60.5% - 61.0% ] 60.63% | 1,270 | 7.0% |
[ 63.0% - 63.5% ] 63.32% | 2,841 | 2.5% |
[ 64.0% - 64.5% ] 64.25% | 3,393 | 4.1% |
[ 66.5% - 67.0% ] 66.75% | 2,021 | 2.4% |
[ 67.5% - 68.0% ] 67.86% | 1,422 | 3.0% |
[ 68.5% - 69.0% ] 68.70% | 722 | 0.87% |
[ 69.5% - 70.0% ] 69.51% | 515 | 1.6% |
[ 71.5% - 72.0% ] 71.93% | 57 | 22.8% |
[ 72.0% - 72.5% ] 72.20% | 957 | 0.66% |
[ 73.0% - 73.5% ] 73.48% | 230 | 15.7% |
[ 77.0% - 77.5% ] 77.26% | 5,520 | 4.3% |
[ 77.5% - 78.0% ] 77.96% | 481 | 2.4% |
[ 80.5% - 81.0% ] 80.72% | 1,006 | 0.75% |
[ 82.0% - 82.5% ] 82.27% | 1,173 | 2.0% |
[ 83.0% - 83.5% ] 83.30% | 886 | 9.5% |
[ 85.0% - 85.5% ] 85.19% | 574 | 7.4% |
[ 85.5% - 86.0% ] 85.97% | 1,283 | 0.17% |
[ 86.5% - 87.0% ] 86.99% | 1,430 | 3.6% |
[ 87.5% - 88.0% ] 87.77% | 229 | 4.0% |
[ 88.5% - 89.0% ] 88.93% | 1,824 | 6.5% |
[ 89.0% - 89.5% ] 89.37% | 2,070 | 2.3% |
[ 89.5% - 90.0% ] 89.82% | 1,877 | 7.3% |
[ 90.5% - 91.0% ] 90.95% | 1,259 | 3.7% |
[ 91.0% - 91.5% ] 91.45% | 620 | 2.1% |
[ 93.0% - 93.5% ] 93.42% | 730 | 6.2% |
[ 95.0% - 95.5% ] 95.45% | 1,362 | 6.4% |
[ 95.5% - 96.0% ] 95.79% | 9,033 | 3.8% |
[ 97.0% - 97.5% ] 97.20% | 6,789 | 4.2% |