Guamanian/Chamorro Ambulatory Disability

COMPARE

Guamanian/Chamorro
Race
Ancestry
AfghanAfricanAlaska NativeAlaskan AthabascanAlbanianAleutAlsatianAmericanApacheArabArapahoArgentineanArmenianAssyrian/Chaldean/SyriacAustralianAustrianBahamianBangladeshiBarbadianBasqueBelgianBelizeanBermudanBhutaneseBlackfeetBolivianBrazilianBritishBritish West IndianBulgarianBurmeseCajunCambodianCanadianCape VerdeanCarpatho RusynCelticCentral AmericanCentral American IndianCherokeeCheyenneChickasawChileanChineseChippewaChoctawColombianColvilleComancheCosta RicanCreeCreekCroatianCrowCubanCypriotCzechCzechoslovakianDanishDelawareDominicanDutchDutch West IndianEastern EuropeanEcuadorianEgyptianEnglishEstonianEthiopianEuropeanFijianFilipinoFinnishFrenchFrench American IndianFrench CanadianGermanGerman RussianGhanaianGreekGuamanian/ChamorroGuatemalanGuyaneseHaitianHmongHonduranHopiHoumaHungarianIcelanderIndian (Asian)IndonesianInupiatIranianIraqiIrishIroquoisIsraeliItalianJamaicanJapaneseJordanianKenyanKiowaKoreanLaotianLatvianLebaneseLiberianLithuanianLumbeeLuxembourgerMacedonianMalaysianMalteseMarshalleseMenomineeMexicanMexican American IndianMongolianMoroccanNative HawaiianNavajoNepaleseNew ZealanderNicaraguanNigerianNorthern EuropeanNorwegianOkinawanOsageOttawaPaiutePakistaniPalestinianPanamanianParaguayanPennsylvania GermanPeruvianPimaPolishPortuguesePotawatomiPuebloPuerto RicanPuget Sound SalishRomanianRussianSalvadoranSamoanScandinavianScotch-IrishScottishSeminoleSenegaleseSerbianShoshoneSierra LeoneanSiouxSlavicSlovakSloveneSomaliSouth AfricanSouth AmericanSouth American IndianSoviet UnionSpaniardSpanishSpanish AmericanSpanish American IndianSri LankanSubsaharan AfricanSudaneseSwedishSwissSyrianTaiwaneseThaiTlingit-HaidaTohono O'OdhamTonganTrinidadian and TobagonianTsimshianTurkishU.S. Virgin IslanderUgandanUkrainianUruguayanUteVenezuelanVietnameseWelshWest IndianYakamaYaquiYugoslavianYumanYup'ikZimbabwean
Immigration
NonimmigrantsImmigrantsAfghanistanAfricaAlbaniaArgentinaArmeniaAsiaAustraliaAustriaBahamasBangladeshBarbadosBelarusBelgiumBelizeBoliviaBosnia and HerzegovinaBrazilBulgariaBurma/MyanmarCabo VerdeCambodiaCameroonCanadaCaribbeanCentral AmericaChileChinaColombiaCongoCosta RicaCroatiaCubaCzechoslovakiaDenmarkDominicaDominican RepublicEastern AfricaEastern AsiaEastern EuropeEcuadorEgyptEl SalvadorEnglandEritreaEthiopiaEuropeFijiFranceGermanyGhanaGreeceGrenadaGuatemalaGuyanaHaitiHondurasHong KongHungaryIndiaIndonesiaIranIraqIrelandIsraelItalyJamaicaJapanJordanKazakhstanKenyaKoreaKuwaitLaosLatin AmericaLatviaLebanonLiberiaLithuaniaMalaysiaMexicoMicronesiaMiddle AfricaMoldovaMoroccoNepalNetherlandsNicaraguaNigeriaNorth AmericaNorth MacedoniaNorthern AfricaNorthern EuropeNorwayOceaniaPakistanPanamaPeruPhilippinesPolandPortugalRomaniaRussiaSaudi ArabiaScotlandSenegalSerbiaSierra LeoneSingaporeSomaliaSouth AfricaSouth AmericaSouth Central AsiaSouth Eastern AsiaSouthern EuropeSpainSri LankaSt. Vincent and the GrenadinesSudanSwedenSwitzerlandSyriaTaiwanThailandTrinidad and TobagoTurkeyUgandaUkraineUruguayUzbekistanVenezuelaVietnamWest IndiesWestern AfricaWestern AsiaWestern EuropeYemenZaireZimbabweAzores
Select to Compare
Race
Ancestry
AfghanAfricanAlaska NativeAlaskan AthabascanAlbanianAleutAlsatianAmericanApacheArabArapahoArgentineanArmenianAssyrian/Chaldean/SyriacAustralianAustrianBahamianBangladeshiBarbadianBasqueBelgianBelizeanBermudanBhutaneseBlackfeetBolivianBrazilianBritishBritish West IndianBulgarianBurmeseCajunCambodianCanadianCape VerdeanCarpatho RusynCelticCentral AmericanCentral American IndianCherokeeCheyenneChickasawChileanChineseChippewaChoctawColombianColvilleComancheCosta RicanCreeCreekCroatianCrowCubanCypriotCzechCzechoslovakianDanishDelawareDominicanDutchDutch West IndianEastern EuropeanEcuadorianEgyptianEnglishEstonianEthiopianEuropeanFijianFilipinoFinnishFrenchFrench American IndianFrench CanadianGermanGerman RussianGhanaianGreekGuatemalanGuyaneseHaitianHmongHonduranHopiHoumaHungarianIcelanderIndian (Asian)IndonesianInupiatIranianIraqiIrishIroquoisIsraeliItalianJamaicanJapaneseJordanianKenyanKiowaKoreanLaotianLatvianLebaneseLiberianLithuanianLumbeeLuxembourgerMacedonianMalaysianMalteseMarshalleseMenomineeMexicanMexican American IndianMongolianMoroccanNative HawaiianNavajoNepaleseNew ZealanderNicaraguanNigerianNorthern EuropeanNorwegianOkinawanOsageOttawaPaiutePakistaniPalestinianPanamanianParaguayanPennsylvania GermanPeruvianPimaPolishPortuguesePotawatomiPuebloPuerto RicanPuget Sound SalishRomanianRussianSalvadoranSamoanScandinavianScotch-IrishScottishSeminoleSenegaleseSerbianShoshoneSierra LeoneanSiouxSlavicSlovakSloveneSomaliSouth AfricanSouth AmericanSouth American IndianSoviet UnionSpaniardSpanishSpanish AmericanSpanish American IndianSri LankanSubsaharan AfricanSudaneseSwedishSwissSyrianTaiwaneseThaiTlingit-HaidaTohono O'OdhamTonganTrinidadian and TobagonianTsimshianTurkishU.S. Virgin IslanderUgandanUkrainianUruguayanUteVenezuelanVietnameseWelshWest IndianYakamaYaquiYugoslavianYumanYup'ikZimbabwean
Immigration
NonimmigrantsImmigrantsAfghanistanAfricaAlbaniaArgentinaArmeniaAsiaAustraliaAustriaBahamasBangladeshBarbadosBelarusBelgiumBelizeBoliviaBosnia and HerzegovinaBrazilBulgariaBurma/MyanmarCabo VerdeCambodiaCameroonCanadaCaribbeanCentral AmericaChileChinaColombiaCongoCosta RicaCroatiaCubaCzechoslovakiaDenmarkDominicaDominican RepublicEastern AfricaEastern AsiaEastern EuropeEcuadorEgyptEl SalvadorEnglandEritreaEthiopiaEuropeFijiFranceGermanyGhanaGreeceGrenadaGuatemalaGuyanaHaitiHondurasHong KongHungaryIndiaIndonesiaIranIraqIrelandIsraelItalyJamaicaJapanJordanKazakhstanKenyaKoreaKuwaitLaosLatin AmericaLatviaLebanonLiberiaLithuaniaMalaysiaMexicoMicronesiaMiddle AfricaMoldovaMoroccoNepalNetherlandsNicaraguaNigeriaNorth AmericaNorth MacedoniaNorthern AfricaNorthern EuropeNorwayOceaniaPakistanPanamaPeruPhilippinesPolandPortugalRomaniaRussiaSaudi ArabiaScotlandSenegalSerbiaSierra LeoneSingaporeSomaliaSouth AfricaSouth AmericaSouth Central AsiaSouth Eastern AsiaSouthern EuropeSpainSri LankaSt. Vincent and the GrenadinesSudanSwedenSwitzerlandSyriaTaiwanThailandTrinidad and TobagoTurkeyUgandaUkraineUruguayUzbekistanVenezuelaVietnamWest IndiesWestern AfricaWestern AsiaWestern EuropeYemenZaireZimbabweAzores
Ambulatory Disability
Income
Poverty
Unemployment
Labor Participation
Family Structure
Vehicle Availability
Education Level
Disability

Guamanian/Chamorro Ambulatory Disability
Poor

6.3%
AMBULATORY DISABILITY
10.6/ 100
METRIC RATING
218th/ 347
METRIC RANK

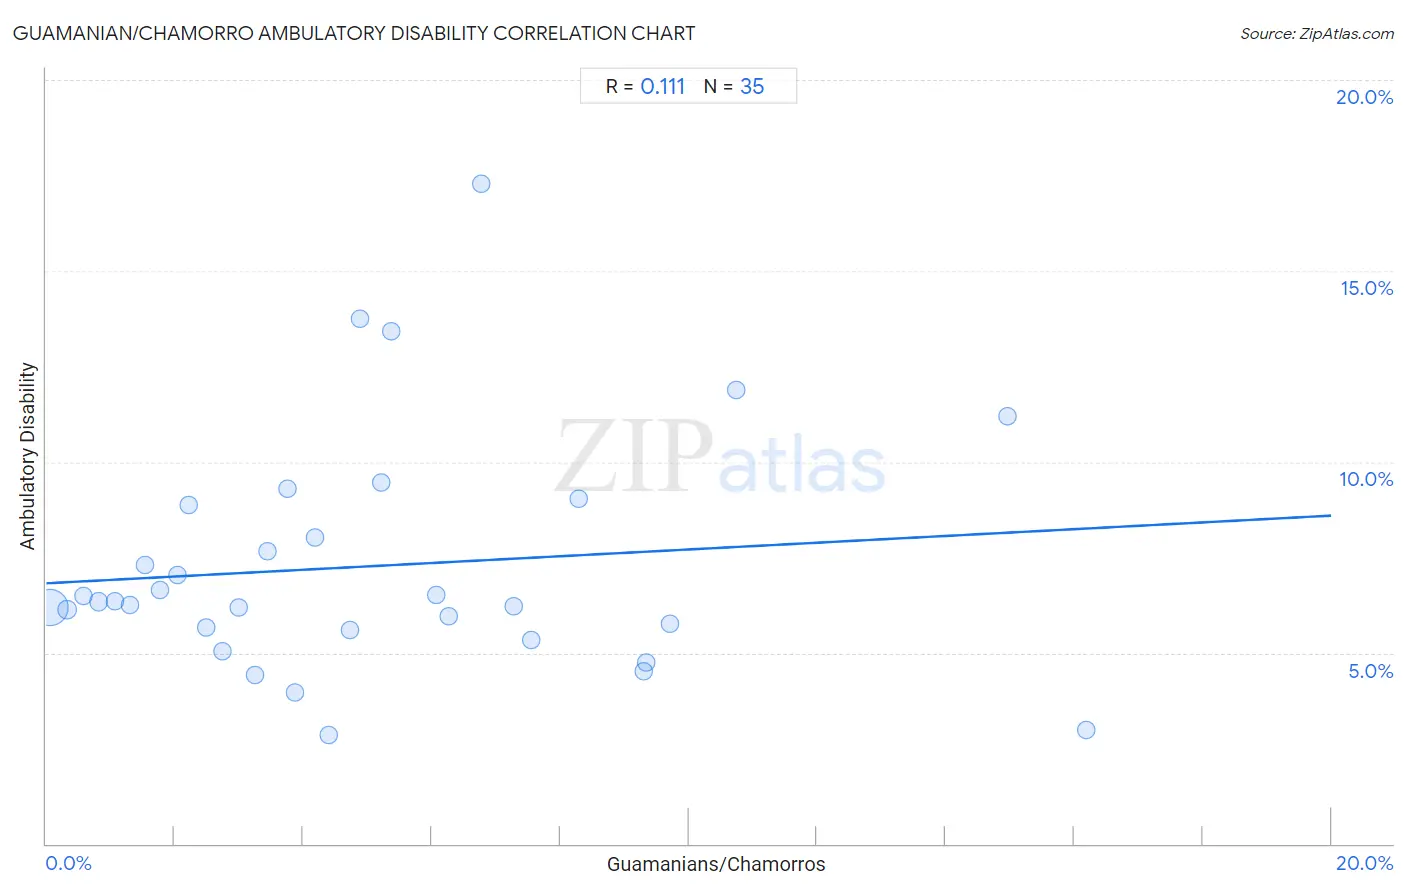
Guamanian/Chamorro Ambulatory Disability Correlation Chart

The statistical analysis conducted on geographies consisting of 221,865,083 people shows a poor positive correlation between the proportion of Guamanians/Chamorros and percentage of population with ambulatory disability in the United States with a correlation coefficient (R) of 0.111 and weighted average of 6.3%. On average, for every 1% (one percent) increase in Guamanians/Chamorros within a typical geography, there is an increase of 0.089% in percentage of population with ambulatory disability.
Guamanian/Chamorro Ambulatory Disability
It is essential to understand that the correlation between the percentage of Guamanians/Chamorros and percentage of population with ambulatory disability does not imply a direct cause-and-effect relationship. It remains uncertain whether the presence of Guamanians/Chamorros influences an upward or downward trend in the level of percentage of population with ambulatory disability within an area, or if Guamanians/Chamorros simply ended up residing in those areas with higher or lower levels of percentage of population with ambulatory disability due to other factors.

Demographics Similar to Guamanians/Chamorros by Ambulatory Disability

In terms of ambulatory disability, the demographic groups most similar to Guamanians/Chamorros are Canadian (6.3%, a difference of 0.040%), Yugoslavian (6.3%, a difference of 0.040%), Immigrants from Latin America (6.3%, a difference of 0.050%), Immigrants from Mexico (6.3%, a difference of 0.060%), and Indonesian (6.3%, a difference of 0.10%).
DemographicsRating | RankAmbulatory Disability
Samoans
12.1
/100
|
#211
Poor
6.3%
Mexican American Indians
12.0
/100
|
#212
Poor
6.3%
Japanese
12.0
/100
|
#213
Poor
6.3%
Immigrants from Mexico
11.0
/100
|
#214
Poor
6.3%
Immigrants from Latin America
11.0
/100
|
#215
Poor
6.3%
Canadians
10.9
/100
|
#216
Poor
6.3%
Yugoslavians
10.9
/100
|
#217
Poor
6.3%
Guamanians/Chamorros
10.6
/100
|
#218
Poor
6.3%
Indonesians
9.9
/100
|
#219
Tragic
6.3%
Immigrants from Albania
9.6
/100
|
#220
Tragic
6.3%
Hungarians
9.6
/100
|
#221
Tragic
6.3%
German Russians
9.4
/100
|
#222
Tragic
6.3%
Immigrants from Honduras
7.6
/100
|
#223
Tragic
6.3%
Liberians
7.1
/100
|
#224
Tragic
6.3%
Hondurans
6.3
/100
|
#225
Tragic
6.3%

Guamanian/Chamorro Ambulatory Disability Correlation Summary

MeasurementGuamanian/Chamorro DataAmbulatory Disability Data
Minimum0.066%2.8%
Maximum16.2%17.3%
Range16.1%14.4%
Mean5.0%7.3%
Median4.2%6.3%
Interquartile 25% (IQ1)2.0%5.6%
Interquartile 75% (IQ3)7.3%8.9%
Interquartile Range (IQR)5.2%3.3%
Standard Deviation (Sample)3.9%3.1%
Standard Deviation (Population)3.9%3.1%

Correlation Details

Guamanian/Chamorro PercentileSample SizeAmbulatory Disability
[
0.0%
-
0.5%
]
0.066%
190,846,2146.2%
[
0.0%
-
0.5%
]
0.33%
20,064,6016.1%
[
0.5%
-
1.0%
]
0.58%
5,617,0876.5%
[
0.5%
-
1.0%
]
0.82%
2,549,8856.3%
[
1.0%
-
1.5%
]
1.08%
1,242,3576.3%
[
1.0%
-
1.5%
]
1.29%
477,4596.3%
[
1.5%
-
2.0%
]
1.54%
409,1457.3%
[
1.5%
-
2.0%
]
1.78%
203,3506.7%
[
2.0%
-
2.5%
]
2.04%
135,5497.1%
[
2.0%
-
2.5%
]
2.22%
66,5648.9%
[
2.0%
-
2.5%
]
2.49%
49,7035.7%
[
2.5%
-
3.0%
]
2.74%
24,7125.0%
[
2.5%
-
3.0%
]
3.00%
28,0226.2%
[
3.0%
-
3.5%
]
3.26%
27,9884.4%
[
3.0%
-
3.5%
]
3.45%
45,9847.6%
[
3.5%
-
4.0%
]
3.75%
9,6809.3%
[
3.5%
-
4.0%
]
3.86%
4,6084.0%
[
4.0%
-
4.5%
]
4.19%
7,7828.0%
[
4.0%
-
4.5%
]
4.41%
5,3792.8%
[
4.5%
-
5.0%
]
4.72%
25,5355.6%
[
4.5%
-
5.0%
]
4.88%
3,74813.8%
[
5.0%
-
5.5%
]
5.22%
1,9749.4%
[
5.0%
-
5.5%
]
5.38%
18613.4%
[
6.0%
-
6.5%
]
6.07%
4,7586.5%
[
6.0%
-
6.5%
]
6.27%
1,6116.0%
[
6.5%
-
7.0%
]
6.77%
1,38817.3%
[
7.0%
-
7.5%
]
7.27%
1,2116.2%
[
7.5%
-
8.0%
]
7.55%
1,6695.3%
[
8.0%
-
8.5%
]
8.29%
5,2629.0%
[
9.0%
-
9.5%
]
9.30%
1724.5%
[
9.0%
-
9.5%
]
9.34%
5784.7%
[
9.5%
-
10.0%
]
9.70%
4025.7%
[
10.5%
-
11.0%
]
10.74%
12111.9%
[
14.5%
-
15.0%
]
14.97%
29411.2%
[
16.0%
-
16.5%
]
16.19%
1053.0%