Guamanian/Chamorro Single Father Households
COMPARE
Guamanian/Chamorro
Select to Compare
Single Father Households
Guamanian/Chamorro Single Father Households
2.6%
SINGLE FATHER HOUSEHOLDS
0.4/ 100
METRIC RATING
267th/ 347
METRIC RANK
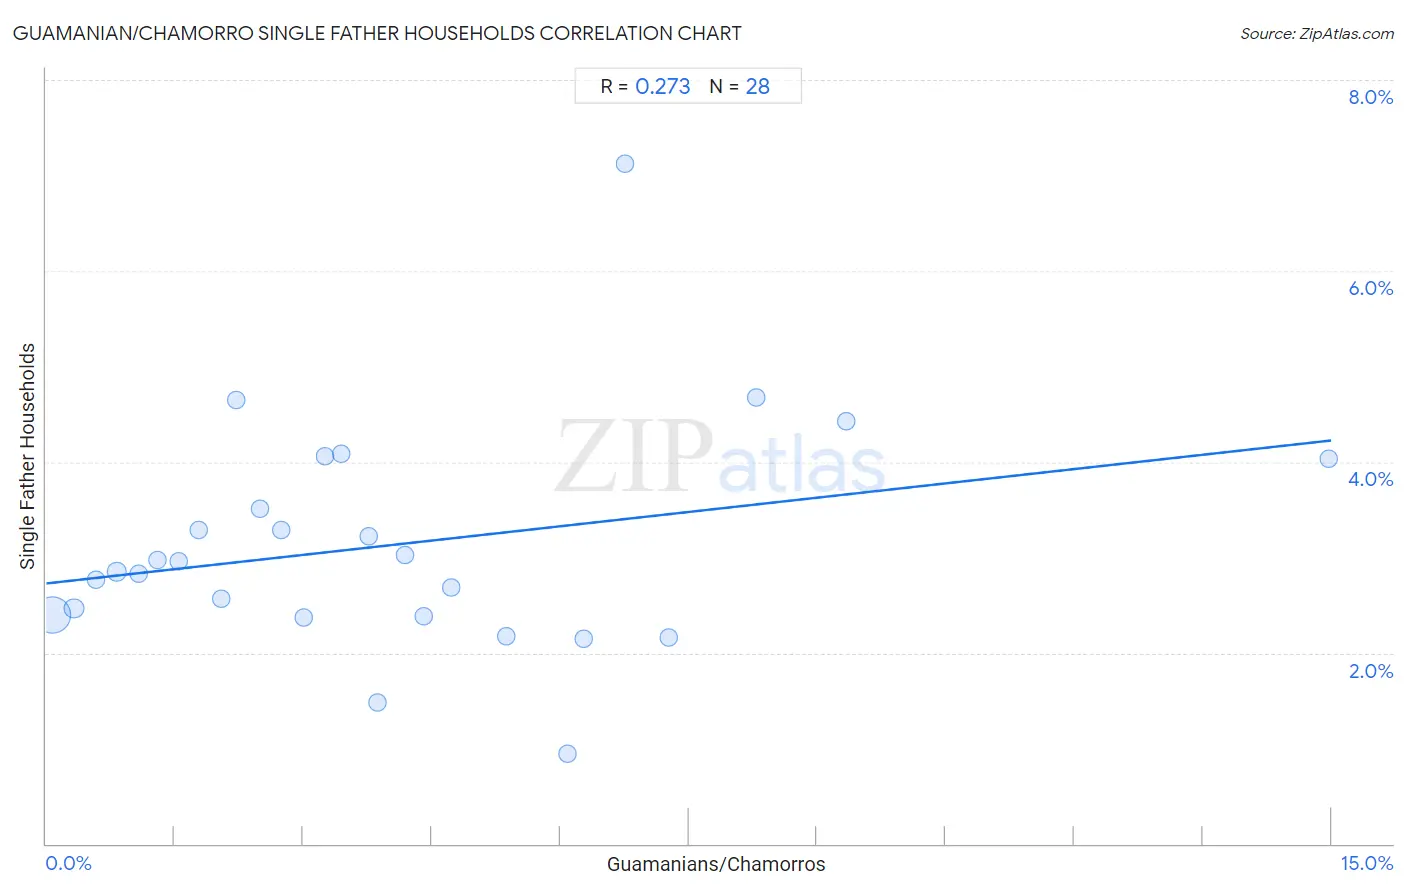
Guamanian/Chamorro Single Father Households Correlation Chart
The statistical analysis conducted on geographies consisting of 221,076,746 people shows a weak positive correlation between the proportion of Guamanians/Chamorros and percentage of single father households in the United States with a correlation coefficient (R) of 0.273 and weighted average of 2.6%. On average, for every 1% (one percent) increase in Guamanians/Chamorros within a typical geography, there is an increase of 0.100% in percentage of single father households.
It is essential to understand that the correlation between the percentage of Guamanians/Chamorros and percentage of single father households does not imply a direct cause-and-effect relationship. It remains uncertain whether the presence of Guamanians/Chamorros influences an upward or downward trend in the level of percentage of single father households within an area, or if Guamanians/Chamorros simply ended up residing in those areas with higher or lower levels of percentage of single father households due to other factors.
Demographics Similar to Guamanians/Chamorros by Single Father Households
In terms of single father households, the demographic groups most similar to Guamanians/Chamorros are Haitian (2.6%, a difference of 0.040%), Cuban (2.6%, a difference of 0.38%), French American Indian (2.6%, a difference of 0.48%), Immigrants from Micronesia (2.6%, a difference of 0.52%), and Seminole (2.6%, a difference of 0.52%).
| Demographics | Rating | Rank | Single Father Households |
| Immigrants from Caribbean | 1.0 /100 | #260 | Tragic 2.5% |
| Immigrants from Belize | 0.9 /100 | #261 | Tragic 2.5% |
| Immigrants from Liberia | 0.8 /100 | #262 | Tragic 2.5% |
| Dominicans | 0.8 /100 | #263 | Tragic 2.5% |
| Indonesians | 0.5 /100 | #264 | Tragic 2.6% |
| Immigrants from Micronesia | 0.5 /100 | #265 | Tragic 2.6% |
| French American Indians | 0.5 /100 | #266 | Tragic 2.6% |
| Guamanians/Chamorros | 0.4 /100 | #267 | Tragic 2.6% |
| Haitians | 0.4 /100 | #268 | Tragic 2.6% |
| Cubans | 0.3 /100 | #269 | Tragic 2.6% |
| Seminole | 0.3 /100 | #270 | Tragic 2.6% |
| Creek | 0.2 /100 | #271 | Tragic 2.6% |
| Belizeans | 0.2 /100 | #272 | Tragic 2.6% |
| Iroquois | 0.2 /100 | #273 | Tragic 2.6% |
| Puerto Ricans | 0.2 /100 | #274 | Tragic 2.6% |
Guamanian/Chamorro Single Father Households Correlation Summary
| Measurement | Guamanian/Chamorro Data | Single Father Households Data |
| Minimum | 0.066% | 0.94% |
| Maximum | 15.0% | 7.1% |
| Range | 14.9% | 6.2% |
| Mean | 4.0% | 3.1% |
| Median | 3.4% | 2.9% |
| Interquartile 25% (IQ1) | 1.7% | 2.4% |
| Interquartile 75% (IQ3) | 5.7% | 3.8% |
| Interquartile Range (IQR) | 4.1% | 1.4% |
| Standard Deviation (Sample) | 3.3% | 1.2% |
| Standard Deviation (Population) | 3.2% | 1.2% |
Correlation Details
| Guamanian/Chamorro Percentile | Sample Size | Single Father Households |
[ 0.0% - 0.5% ] 0.066% | 190,512,047 | 2.4% |
[ 0.0% - 0.5% ] 0.33% | 19,879,374 | 2.5% |
[ 0.5% - 1.0% ] 0.58% | 5,490,405 | 2.8% |
[ 0.5% - 1.0% ] 0.82% | 2,508,874 | 2.8% |
[ 1.0% - 1.5% ] 1.08% | 1,215,528 | 2.8% |
[ 1.0% - 1.5% ] 1.30% | 455,788 | 3.0% |
[ 1.5% - 2.0% ] 1.54% | 394,648 | 3.0% |
[ 1.5% - 2.0% ] 1.78% | 201,852 | 3.3% |
[ 2.0% - 2.5% ] 2.04% | 131,727 | 2.6% |
[ 2.0% - 2.5% ] 2.22% | 62,415 | 4.6% |
[ 2.0% - 2.5% ] 2.49% | 47,278 | 3.5% |
[ 2.5% - 3.0% ] 2.74% | 19,312 | 3.3% |
[ 2.5% - 3.0% ] 3.00% | 21,703 | 2.4% |
[ 3.0% - 3.5% ] 3.26% | 27,485 | 4.1% |
[ 3.0% - 3.5% ] 3.45% | 45,984 | 4.1% |
[ 3.5% - 4.0% ] 3.77% | 8,465 | 3.2% |
[ 3.5% - 4.0% ] 3.87% | 4,243 | 1.5% |
[ 4.0% - 4.5% ] 4.19% | 7,572 | 3.0% |
[ 4.0% - 4.5% ] 4.40% | 5,199 | 2.4% |
[ 4.5% - 5.0% ] 4.73% | 24,286 | 2.7% |
[ 5.0% - 5.5% ] 5.38% | 186 | 2.2% |
[ 6.0% - 6.5% ] 6.09% | 2,643 | 0.94% |
[ 6.0% - 6.5% ] 6.27% | 1,611 | 2.2% |
[ 6.5% - 7.0% ] 6.75% | 859 | 7.1% |
[ 7.0% - 7.5% ] 7.27% | 1,128 | 2.2% |
[ 8.0% - 8.5% ] 8.29% | 5,262 | 4.7% |
[ 9.0% - 9.5% ] 9.34% | 578 | 4.4% |
[ 14.5% - 15.0% ] 14.97% | 294 | 4.0% |