French American Indian Self-Care Disability
COMPARE
French American Indian
Select to Compare
Self-Care Disability
French American Indian Self-Care Disability
2.7%
SELF-CARE DISABILITY
0.0/ 100
METRIC RATING
286th/ 347
METRIC RANK
French American Indian Self-Care Disability Correlation Chart
The statistical analysis conducted on geographies consisting of 131,926,488 people shows a substantial positive correlation between the proportion of French American Indians and percentage of population with self-care disability in the United States with a correlation coefficient (R) of 0.571 and weighted average of 2.7%. On average, for every 1% (one percent) increase in French American Indians within a typical geography, there is an increase of 0.31% in percentage of population with self-care disability.
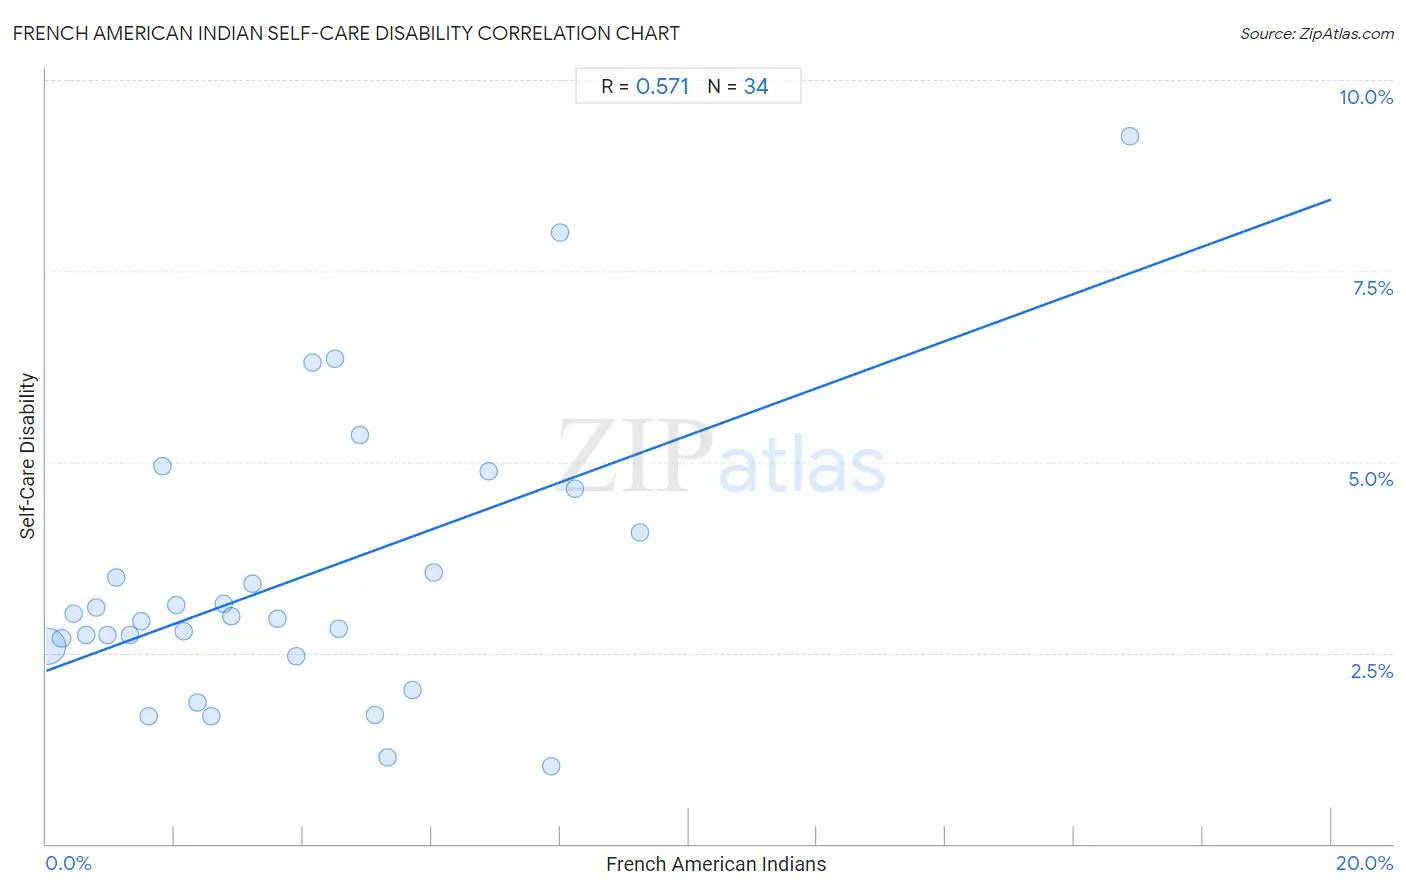
It is essential to understand that the correlation between the percentage of French American Indians and percentage of population with self-care disability does not imply a direct cause-and-effect relationship. It remains uncertain whether the presence of French American Indians influences an upward or downward trend in the level of percentage of population with self-care disability within an area, or if French American Indians simply ended up residing in those areas with higher or lower levels of percentage of population with self-care disability due to other factors.
Demographics Similar to French American Indians by Self-Care Disability
In terms of self-care disability, the demographic groups most similar to French American Indians are Immigrants from Jamaica (2.7%, a difference of 0.33%), Immigrants from Barbados (2.7%, a difference of 0.37%), African (2.7%, a difference of 0.47%), Jamaican (2.7%, a difference of 0.60%), and Cuban (2.7%, a difference of 0.62%).
| Demographics | Rating | Rank | Self-Care Disability |
| Iroquois | 0.1 /100 | #279 | Tragic 2.7% |
| Hispanics or Latinos | 0.1 /100 | #280 | Tragic 2.7% |
| Immigrants from Iraq | 0.0 /100 | #281 | Tragic 2.7% |
| Apache | 0.0 /100 | #282 | Tragic 2.7% |
| Delaware | 0.0 /100 | #283 | Tragic 2.7% |
| Fijians | 0.0 /100 | #284 | Tragic 2.7% |
| Jamaicans | 0.0 /100 | #285 | Tragic 2.7% |
| French American Indians | 0.0 /100 | #286 | Tragic 2.7% |
| Immigrants from Jamaica | 0.0 /100 | #287 | Tragic 2.7% |
| Immigrants from Barbados | 0.0 /100 | #288 | Tragic 2.7% |
| Africans | 0.0 /100 | #289 | Tragic 2.7% |
| Cubans | 0.0 /100 | #290 | Tragic 2.7% |
| Guyanese | 0.0 /100 | #291 | Tragic 2.7% |
| Central American Indians | 0.0 /100 | #292 | Tragic 2.7% |
| Belizeans | 0.0 /100 | #293 | Tragic 2.7% |
French American Indian Self-Care Disability Correlation Summary
| Measurement | French American Indian Data | Self-Care Disability Data |
| Minimum | 0.025% | 1.0% |
| Maximum | 16.9% | 9.3% |
| Range | 16.8% | 8.2% |
| Mean | 3.9% | 3.5% |
| Median | 3.1% | 3.0% |
| Interquartile 25% (IQ1) | 1.5% | 2.6% |
| Interquartile 75% (IQ3) | 5.3% | 4.1% |
| Interquartile Range (IQR) | 3.8% | 1.5% |
| Standard Deviation (Sample) | 3.4% | 1.8% |
| Standard Deviation (Population) | 3.4% | 1.8% |
Correlation Details
| French American Indian Percentile | Sample Size | Self-Care Disability |
[ 0.0% - 0.5% ] 0.025% | 124,985,043 | 2.6% |
[ 0.0% - 0.5% ] 0.24% | 4,840,884 | 2.7% |
[ 0.0% - 0.5% ] 0.43% | 1,174,430 | 3.0% |
[ 0.5% - 1.0% ] 0.63% | 367,968 | 2.7% |
[ 0.5% - 1.0% ] 0.78% | 161,136 | 3.1% |
[ 0.5% - 1.0% ] 0.96% | 76,987 | 2.7% |
[ 1.0% - 1.5% ] 1.09% | 141,316 | 3.5% |
[ 1.0% - 1.5% ] 1.30% | 55,472 | 2.7% |
[ 1.0% - 1.5% ] 1.48% | 28,638 | 2.9% |
[ 1.5% - 2.0% ] 1.60% | 13,007 | 1.7% |
[ 1.5% - 2.0% ] 1.80% | 27,381 | 4.9% |
[ 2.0% - 2.5% ] 2.03% | 3,448 | 3.1% |
[ 2.0% - 2.5% ] 2.15% | 10,904 | 2.8% |
[ 2.0% - 2.5% ] 2.35% | 12,524 | 1.9% |
[ 2.5% - 3.0% ] 2.56% | 4,527 | 1.7% |
[ 2.5% - 3.0% ] 2.76% | 362 | 3.1% |
[ 2.5% - 3.0% ] 2.88% | 6,240 | 3.0% |
[ 3.0% - 3.5% ] 3.22% | 2,331 | 3.4% |
[ 3.5% - 4.0% ] 3.61% | 1,026 | 2.9% |
[ 3.5% - 4.0% ] 3.88% | 1,210 | 2.4% |
[ 4.0% - 4.5% ] 4.14% | 290 | 6.3% |
[ 4.0% - 4.5% ] 4.49% | 178 | 6.4% |
[ 4.5% - 5.0% ] 4.55% | 682 | 2.8% |
[ 4.5% - 5.0% ] 4.89% | 368 | 5.4% |
[ 5.0% - 5.5% ] 5.11% | 548 | 1.7% |
[ 5.0% - 5.5% ] 5.31% | 1,300 | 1.1% |
[ 5.5% - 6.0% ] 5.71% | 666 | 2.0% |
[ 6.0% - 6.5% ] 6.04% | 3,346 | 3.6% |
[ 6.5% - 7.0% ] 6.90% | 174 | 4.9% |
[ 7.5% - 8.0% ] 7.85% | 1,554 | 1.0% |
[ 8.0% - 8.5% ] 8.00% | 25 | 8.0% |
[ 8.0% - 8.5% ] 8.22% | 1,593 | 4.7% |
[ 9.0% - 9.5% ] 9.23% | 758 | 4.1% |
[ 16.5% - 17.0% ] 16.86% | 172 | 9.3% |