Arapaho Self-Care Disability
COMPARE
Arapaho
Select to Compare
Self-Care Disability
Arapaho Self-Care Disability
2.6%
SELF-CARE DISABILITY
0.2/ 100
METRIC RATING
261st/ 347
METRIC RANK
Arapaho Self-Care Disability Correlation Chart
The statistical analysis conducted on geographies consisting of 29,765,885 people shows no correlation between the proportion of Arapaho and percentage of population with self-care disability in the United States with a correlation coefficient (R) of -0.004 and weighted average of 2.6%. On average, for every 1% (one percent) increase in Arapaho within a typical geography, there is a decrease of 0.00030% in percentage of population with self-care disability.
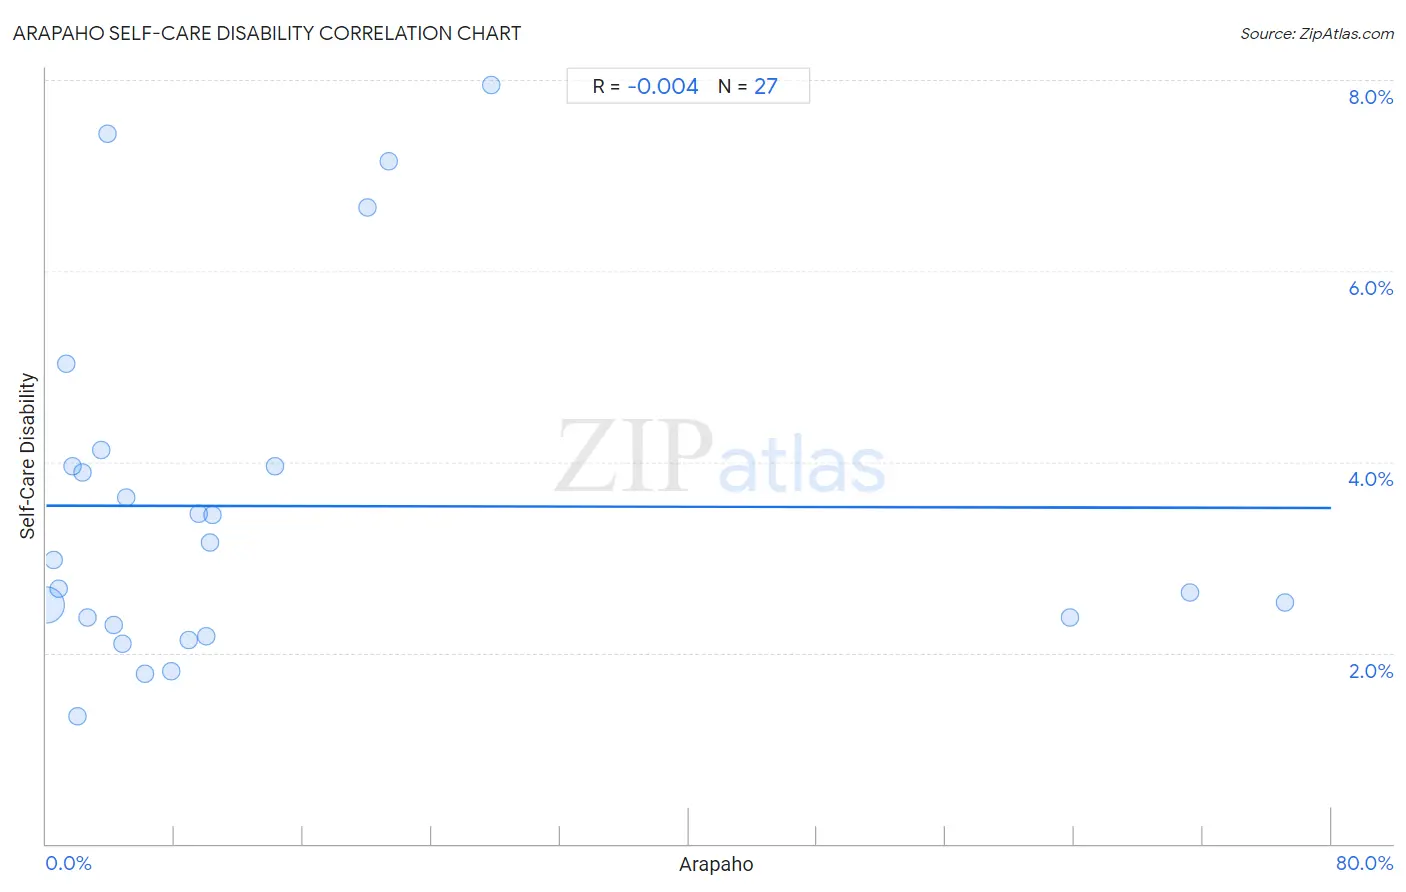
It is essential to understand that the correlation between the percentage of Arapaho and percentage of population with self-care disability does not imply a direct cause-and-effect relationship. It remains uncertain whether the presence of Arapaho influences an upward or downward trend in the level of percentage of population with self-care disability within an area, or if Arapaho simply ended up residing in those areas with higher or lower levels of percentage of population with self-care disability due to other factors.
Demographics Similar to Arapaho by Self-Care Disability
In terms of self-care disability, the demographic groups most similar to Arapaho are Chippewa (2.6%, a difference of 0.020%), Immigrants from Belarus (2.6%, a difference of 0.060%), Nonimmigrants (2.6%, a difference of 0.13%), Shoshone (2.7%, a difference of 0.14%), and Potawatomi (2.6%, a difference of 0.20%).
| Demographics | Rating | Rank | Self-Care Disability |
| Haitians | 0.3 /100 | #254 | Tragic 2.6% |
| Tsimshian | 0.3 /100 | #255 | Tragic 2.6% |
| Immigrants from Central America | 0.3 /100 | #256 | Tragic 2.6% |
| Potawatomi | 0.3 /100 | #257 | Tragic 2.6% |
| Nonimmigrants | 0.3 /100 | #258 | Tragic 2.6% |
| Immigrants from Belarus | 0.2 /100 | #259 | Tragic 2.6% |
| Chippewa | 0.2 /100 | #260 | Tragic 2.6% |
| Arapaho | 0.2 /100 | #261 | Tragic 2.6% |
| Shoshone | 0.2 /100 | #262 | Tragic 2.7% |
| Immigrants from Latin America | 0.2 /100 | #263 | Tragic 2.7% |
| Immigrants from Iran | 0.2 /100 | #264 | Tragic 2.7% |
| Immigrants from Nicaragua | 0.2 /100 | #265 | Tragic 2.7% |
| Immigrants from Cambodia | 0.1 /100 | #266 | Tragic 2.7% |
| Yaqui | 0.1 /100 | #267 | Tragic 2.7% |
| Immigrants from Mexico | 0.1 /100 | #268 | Tragic 2.7% |
Arapaho Self-Care Disability Correlation Summary
| Measurement | Arapaho Data | Self-Care Disability Data |
| Minimum | 0.025% | 1.3% |
| Maximum | 77.1% | 7.9% |
| Range | 77.1% | 6.6% |
| Mean | 14.5% | 3.5% |
| Median | 6.2% | 3.0% |
| Interquartile 25% (IQ1) | 2.3% | 2.3% |
| Interquartile 75% (IQ3) | 14.2% | 4.0% |
| Interquartile Range (IQR) | 12.0% | 1.7% |
| Standard Deviation (Sample) | 21.4% | 1.8% |
| Standard Deviation (Population) | 21.0% | 1.8% |
Correlation Details
| Arapaho Percentile | Sample Size | Self-Care Disability |
[ 0.0% - 0.5% ] 0.025% | 29,354,392 | 2.5% |
[ 0.0% - 0.5% ] 0.48% | 186,932 | 3.0% |
[ 0.5% - 1.0% ] 0.81% | 102,518 | 2.7% |
[ 1.0% - 1.5% ] 1.22% | 21,505 | 5.0% |
[ 1.5% - 2.0% ] 1.62% | 13,798 | 4.0% |
[ 1.5% - 2.0% ] 1.95% | 10,849 | 1.3% |
[ 2.0% - 2.5% ] 2.26% | 4,424 | 3.9% |
[ 2.5% - 3.0% ] 2.57% | 1,440 | 2.4% |
[ 3.0% - 3.5% ] 3.43% | 5,514 | 4.1% |
[ 3.5% - 4.0% ] 3.83% | 574 | 7.4% |
[ 4.0% - 4.5% ] 4.18% | 8,010 | 2.3% |
[ 4.5% - 5.0% ] 4.73% | 993 | 2.1% |
[ 4.5% - 5.0% ] 4.99% | 2,905 | 3.6% |
[ 6.0% - 6.5% ] 6.17% | 10,733 | 1.8% |
[ 7.5% - 8.0% ] 7.77% | 283 | 1.8% |
[ 8.5% - 9.0% ] 8.89% | 596 | 2.1% |
[ 9.0% - 9.5% ] 9.48% | 3,122 | 3.5% |
[ 9.5% - 10.0% ] 9.96% | 18,898 | 2.2% |
[ 10.0% - 10.5% ] 10.18% | 13,248 | 3.2% |
[ 10.0% - 10.5% ] 10.34% | 58 | 3.4% |
[ 14.0% - 14.5% ] 14.23% | 513 | 4.0% |
[ 20.0% - 20.5% ] 20.00% | 30 | 6.7% |
[ 21.0% - 21.5% ] 21.35% | 89 | 7.1% |
[ 27.5% - 28.0% ] 27.72% | 285 | 7.9% |
[ 63.5% - 64.0% ] 63.72% | 1,596 | 2.4% |
[ 71.0% - 71.5% ] 71.24% | 1,471 | 2.6% |
[ 77.0% - 77.5% ] 77.10% | 1,109 | 2.5% |