Guamanian/Chamorro Receiving Food Stamps
COMPARE
Guamanian/Chamorro
Select to Compare
Receiving Food Stamps
Guamanian/Chamorro Receiving Food Stamps
11.7%
PUBLIC INCOME | FOOD STAMPS
54.2/ 100
METRIC RATING
172nd/ 347
METRIC RANK
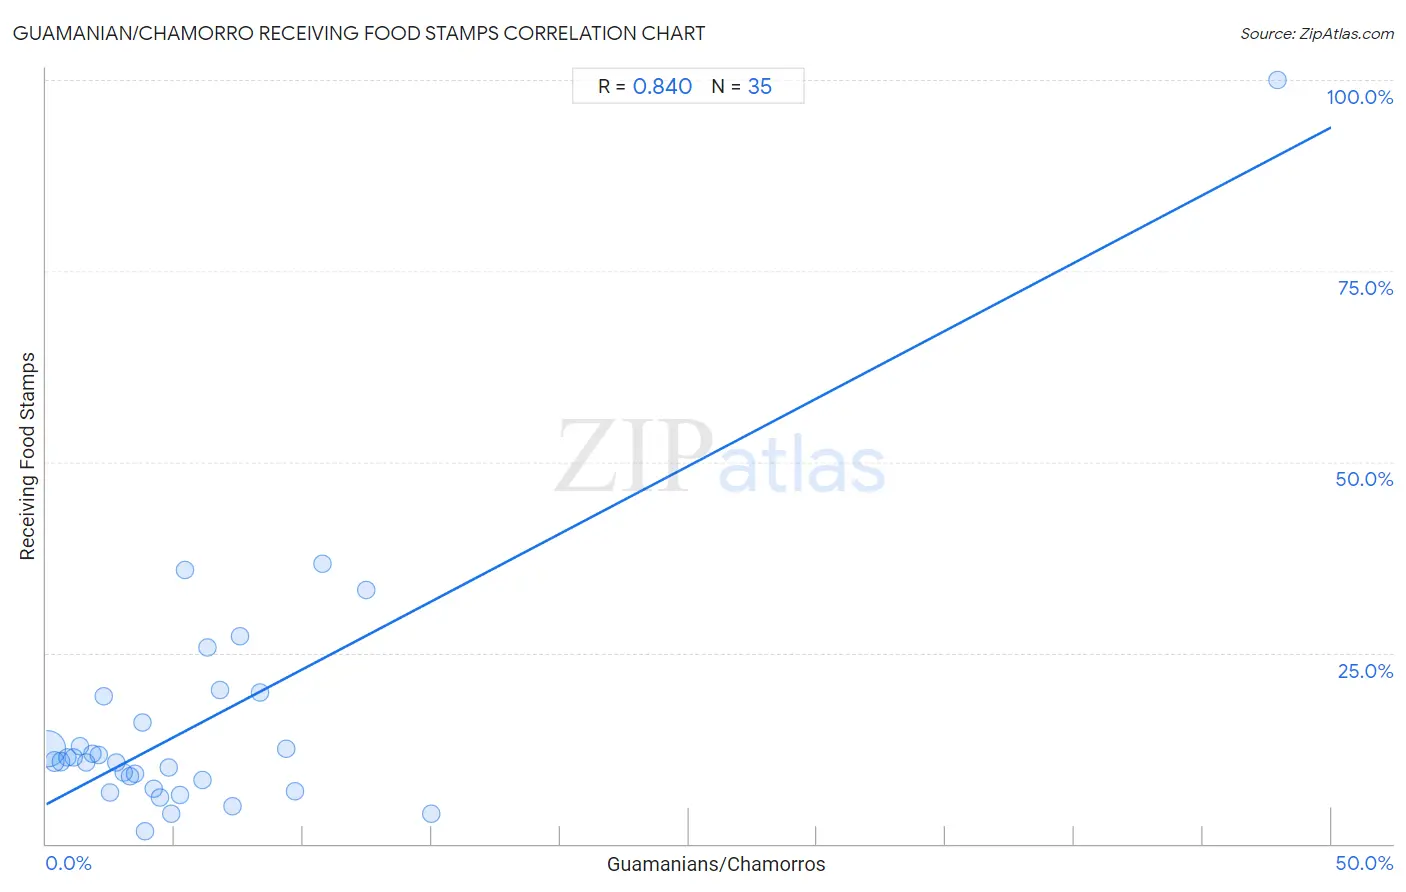
Guamanian/Chamorro Receiving Food Stamps Correlation Chart
The statistical analysis conducted on geographies consisting of 221,700,710 people shows a very strong positive correlation between the proportion of Guamanians/Chamorros and percentage of population receiving government assistance and/or food stamps in the United States with a correlation coefficient (R) of 0.840 and weighted average of 11.7%. On average, for every 1% (one percent) increase in Guamanians/Chamorros within a typical geography, there is an increase of 1.8% in percentage of population receiving government assistance and/or food stamps.
It is essential to understand that the correlation between the percentage of Guamanians/Chamorros and percentage of population receiving government assistance and/or food stamps does not imply a direct cause-and-effect relationship. It remains uncertain whether the presence of Guamanians/Chamorros influences an upward or downward trend in the level of percentage of population receiving government assistance and/or food stamps within an area, or if Guamanians/Chamorros simply ended up residing in those areas with higher or lower levels of percentage of population receiving government assistance and/or food stamps due to other factors.
Demographics Similar to Guamanians/Chamorros by Receiving Food Stamps
In terms of receiving food stamps, the demographic groups most similar to Guamanians/Chamorros are Immigrants from Syria (11.7%, a difference of 0.11%), Immigrants from Western Asia (11.6%, a difference of 0.32%), Costa Rican (11.6%, a difference of 0.53%), Immigrants from Eritrea (11.7%, a difference of 0.59%), and Immigrants from Eastern Africa (11.6%, a difference of 0.60%).
| Demographics | Rating | Rank | Receiving Food Stamps |
| Arabs | 64.7 /100 | #165 | Good 11.5% |
| Immigrants from Belarus | 62.8 /100 | #166 | Good 11.5% |
| Kenyans | 60.2 /100 | #167 | Good 11.6% |
| Tlingit-Haida | 59.1 /100 | #168 | Average 11.6% |
| Immigrants from Eastern Africa | 58.3 /100 | #169 | Average 11.6% |
| Costa Ricans | 57.9 /100 | #170 | Average 11.6% |
| Immigrants from Western Asia | 56.4 /100 | #171 | Average 11.6% |
| Guamanians/Chamorros | 54.2 /100 | #172 | Average 11.7% |
| Immigrants from Syria | 53.4 /100 | #173 | Average 11.7% |
| Immigrants from Eritrea | 50.0 /100 | #174 | Average 11.7% |
| Osage | 49.8 /100 | #175 | Average 11.7% |
| Peruvians | 49.3 /100 | #176 | Average 11.7% |
| Immigrants from Ukraine | 48.4 /100 | #177 | Average 11.8% |
| German Russians | 48.1 /100 | #178 | Average 11.8% |
| Immigrants from Kenya | 46.4 /100 | #179 | Average 11.8% |
Guamanian/Chamorro Receiving Food Stamps Correlation Summary
| Measurement | Guamanian/Chamorro Data | Receiving Food Stamps Data |
| Minimum | 0.066% | 1.7% |
| Maximum | 47.9% | 100.0% |
| Range | 47.8% | 98.3% |
| Mean | 6.0% | 15.8% |
| Median | 4.2% | 10.8% |
| Interquartile 25% (IQ1) | 2.0% | 7.3% |
| Interquartile 75% (IQ3) | 7.3% | 19.4% |
| Interquartile Range (IQR) | 5.2% | 12.1% |
| Standard Deviation (Sample) | 8.1% | 17.1% |
| Standard Deviation (Population) | 8.0% | 16.9% |
Correlation Details
| Guamanian/Chamorro Percentile | Sample Size | Receiving Food Stamps |
[ 0.0% - 0.5% ] 0.066% | 190,745,020 | 12.5% |
[ 0.0% - 0.5% ] 0.33% | 20,035,651 | 10.7% |
[ 0.5% - 1.0% ] 0.58% | 5,606,963 | 10.8% |
[ 0.5% - 1.0% ] 0.82% | 2,551,752 | 11.3% |
[ 1.0% - 1.5% ] 1.08% | 1,245,902 | 11.3% |
[ 1.0% - 1.5% ] 1.30% | 463,469 | 12.7% |
[ 1.5% - 2.0% ] 1.54% | 407,250 | 10.7% |
[ 1.5% - 2.0% ] 1.78% | 203,350 | 11.7% |
[ 2.0% - 2.5% ] 2.04% | 135,549 | 11.7% |
[ 2.0% - 2.5% ] 2.22% | 66,350 | 19.4% |
[ 2.0% - 2.5% ] 2.49% | 49,703 | 6.7% |
[ 2.5% - 3.0% ] 2.74% | 19,695 | 10.6% |
[ 2.5% - 3.0% ] 2.99% | 29,149 | 9.4% |
[ 3.0% - 3.5% ] 3.26% | 27,485 | 8.9% |
[ 3.0% - 3.5% ] 3.45% | 45,984 | 9.2% |
[ 3.5% - 4.0% ] 3.75% | 9,680 | 15.9% |
[ 3.5% - 4.0% ] 3.86% | 4,608 | 1.7% |
[ 4.0% - 4.5% ] 4.19% | 7,782 | 7.3% |
[ 4.0% - 4.5% ] 4.40% | 5,199 | 6.1% |
[ 4.5% - 5.0% ] 4.74% | 19,264 | 10.0% |
[ 4.5% - 5.0% ] 4.88% | 3,748 | 3.9% |
[ 5.0% - 5.5% ] 5.22% | 1,974 | 6.4% |
[ 5.0% - 5.5% ] 5.38% | 186 | 35.9% |
[ 6.0% - 6.5% ] 6.09% | 2,643 | 8.4% |
[ 6.0% - 6.5% ] 6.27% | 1,611 | 25.7% |
[ 6.5% - 7.0% ] 6.77% | 1,388 | 20.2% |
[ 7.0% - 7.5% ] 7.27% | 1,211 | 4.9% |
[ 7.5% - 8.0% ] 7.55% | 1,669 | 27.1% |
[ 8.0% - 8.5% ] 8.30% | 4,648 | 19.8% |
[ 9.0% - 9.5% ] 9.34% | 578 | 12.4% |
[ 9.5% - 10.0% ] 9.70% | 402 | 6.9% |
[ 10.5% - 11.0% ] 10.74% | 121 | 36.6% |
[ 12.0% - 12.5% ] 12.46% | 313 | 33.3% |
[ 14.5% - 15.0% ] 14.97% | 294 | 4.0% |
[ 47.5% - 48.0% ] 47.90% | 119 | 100.0% |