Guamanian/Chamorro vs Dominican Self-Care Disability
COMPARE
Guamanian/Chamorro
Dominican
Self-Care Disability
Self-Care Disability Comparison
Guamanians/Chamorros
Dominicans
2.6%
SELF-CARE DISABILITY
2.5/ 100
METRIC RATING
229th/ 347
METRIC RANK
3.1%
SELF-CARE DISABILITY
0.0/ 100
METRIC RATING
341st/ 347
METRIC RANK
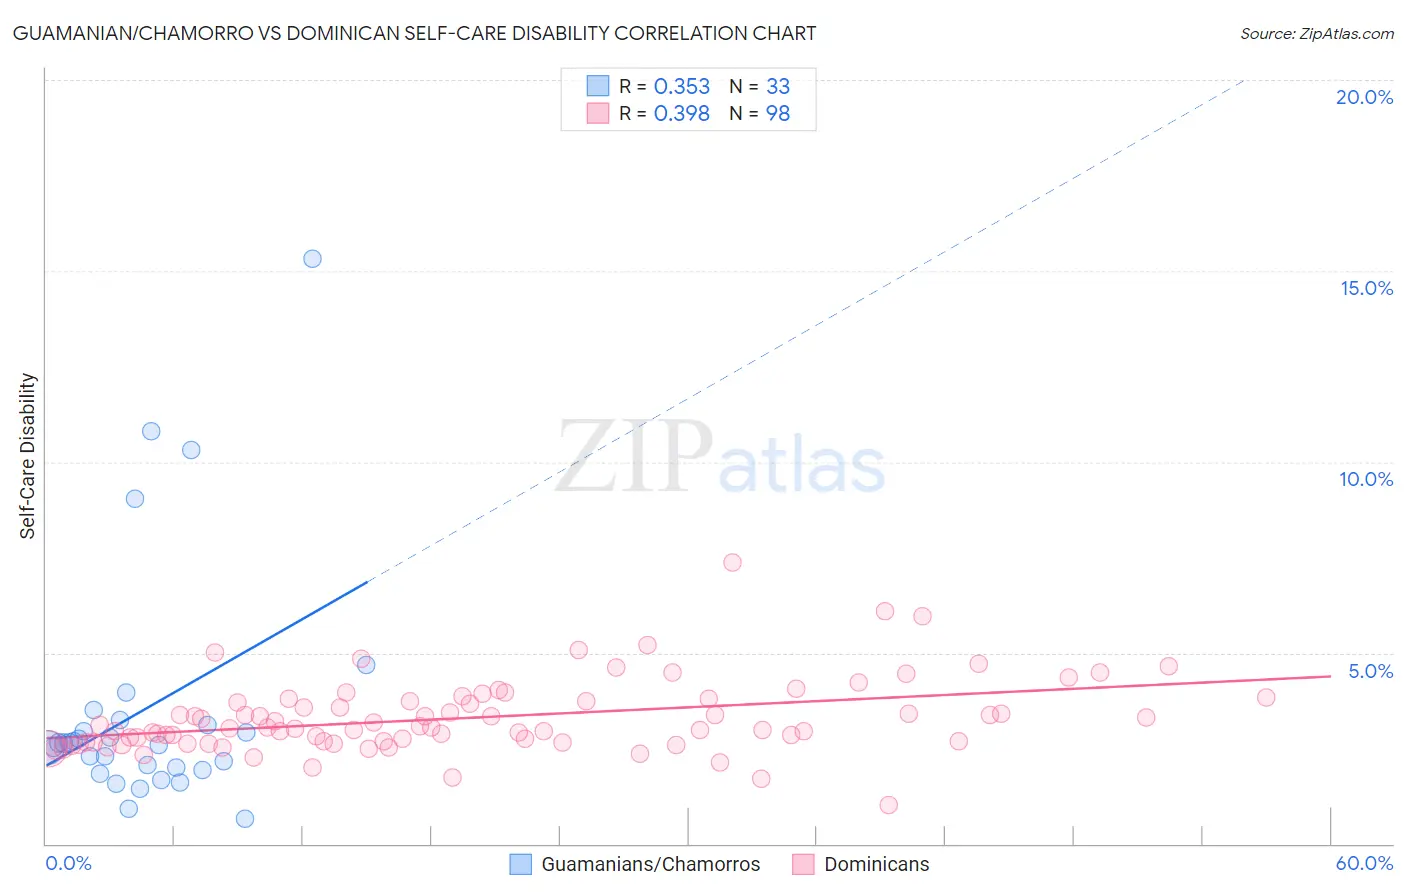
Guamanian/Chamorro vs Dominican Self-Care Disability Correlation Chart
The statistical analysis conducted on geographies consisting of 221,730,163 people shows a mild positive correlation between the proportion of Guamanians/Chamorros and percentage of population with self-care disability in the United States with a correlation coefficient (R) of 0.353 and weighted average of 2.6%. Similarly, the statistical analysis conducted on geographies consisting of 354,514,623 people shows a mild positive correlation between the proportion of Dominicans and percentage of population with self-care disability in the United States with a correlation coefficient (R) of 0.398 and weighted average of 3.1%, a difference of 19.0%.
Self-Care Disability Correlation Summary
| Measurement | Guamanian/Chamorro | Dominican |
| Minimum | 0.65% | 1.0% |
| Maximum | 15.3% | 7.4% |
| Range | 14.7% | 6.3% |
| Mean | 3.5% | 3.3% |
| Median | 2.6% | 3.0% |
| Interquartile 25% (IQ1) | 2.0% | 2.7% |
| Interquartile 75% (IQ3) | 3.2% | 3.7% |
| Interquartile Range (IQR) | 1.2% | 1.1% |
| Standard Deviation (Sample) | 3.2% | 0.96% |
| Standard Deviation (Population) | 3.1% | 0.96% |
Similar Demographics by Self-Care Disability
Demographics Similar to Guamanians/Chamorros by Self-Care Disability
In terms of self-care disability, the demographic groups most similar to Guamanians/Chamorros are Immigrants from Ecuador (2.6%, a difference of 0.010%), Guatemalan (2.6%, a difference of 0.070%), Immigrants from Philippines (2.6%, a difference of 0.080%), Immigrants from Guatemala (2.6%, a difference of 0.15%), and Chinese (2.6%, a difference of 0.16%).
| Demographics | Rating | Rank | Self-Care Disability |
| Spaniards | 3.8 /100 | #222 | Tragic 2.6% |
| French Canadians | 3.8 /100 | #223 | Tragic 2.6% |
| Osage | 3.6 /100 | #224 | Tragic 2.6% |
| Iraqis | 3.2 /100 | #225 | Tragic 2.6% |
| Chinese | 2.9 /100 | #226 | Tragic 2.6% |
| Immigrants | Philippines | 2.7 /100 | #227 | Tragic 2.6% |
| Guatemalans | 2.7 /100 | #228 | Tragic 2.6% |
| Guamanians/Chamorros | 2.5 /100 | #229 | Tragic 2.6% |
| Immigrants | Ecuador | 2.5 /100 | #230 | Tragic 2.6% |
| Immigrants | Guatemala | 2.2 /100 | #231 | Tragic 2.6% |
| Albanians | 2.2 /100 | #232 | Tragic 2.6% |
| Liberians | 2.1 /100 | #233 | Tragic 2.6% |
| Vietnamese | 2.1 /100 | #234 | Tragic 2.6% |
| Bahamians | 2.0 /100 | #235 | Tragic 2.6% |
| Bermudans | 1.9 /100 | #236 | Tragic 2.6% |
Demographics Similar to Dominicans by Self-Care Disability
In terms of self-care disability, the demographic groups most similar to Dominicans are Immigrants from Cabo Verde (3.1%, a difference of 0.26%), Immigrants from Dominican Republic (3.0%, a difference of 0.59%), Cape Verdean (3.0%, a difference of 0.98%), Choctaw (3.0%, a difference of 1.3%), and Colville (3.1%, a difference of 1.6%).
| Demographics | Rating | Rank | Self-Care Disability |
| Dutch West Indians | 0.0 /100 | #333 | Tragic 3.0% |
| Houma | 0.0 /100 | #334 | Tragic 3.0% |
| Immigrants | Azores | 0.0 /100 | #335 | Tragic 3.0% |
| Immigrants | Yemen | 0.0 /100 | #336 | Tragic 3.0% |
| Choctaw | 0.0 /100 | #337 | Tragic 3.0% |
| Cape Verdeans | 0.0 /100 | #338 | Tragic 3.0% |
| Immigrants | Dominican Republic | 0.0 /100 | #339 | Tragic 3.0% |
| Immigrants | Cabo Verde | 0.0 /100 | #340 | Tragic 3.1% |
| Dominicans | 0.0 /100 | #341 | Tragic 3.1% |
| Colville | 0.0 /100 | #342 | Tragic 3.1% |
| Tohono O'odham | 0.0 /100 | #343 | Tragic 3.1% |
| Pueblo | 0.0 /100 | #344 | Tragic 3.3% |
| Armenians | 0.0 /100 | #345 | Tragic 3.4% |
| Puerto Ricans | 0.0 /100 | #346 | Tragic 3.7% |
| Immigrants | Armenia | 0.0 /100 | #347 | Tragic 4.2% |