Guamanian/Chamorro College, Under 1 year
COMPARE
Guamanian/Chamorro
Select to Compare
College, Under 1 year
Guamanian/Chamorro College, Under 1 year
65.4%
COLLEGE, UNDER 1 YEAR
48.2/ 100
METRIC RATING
179th/ 347
METRIC RANK
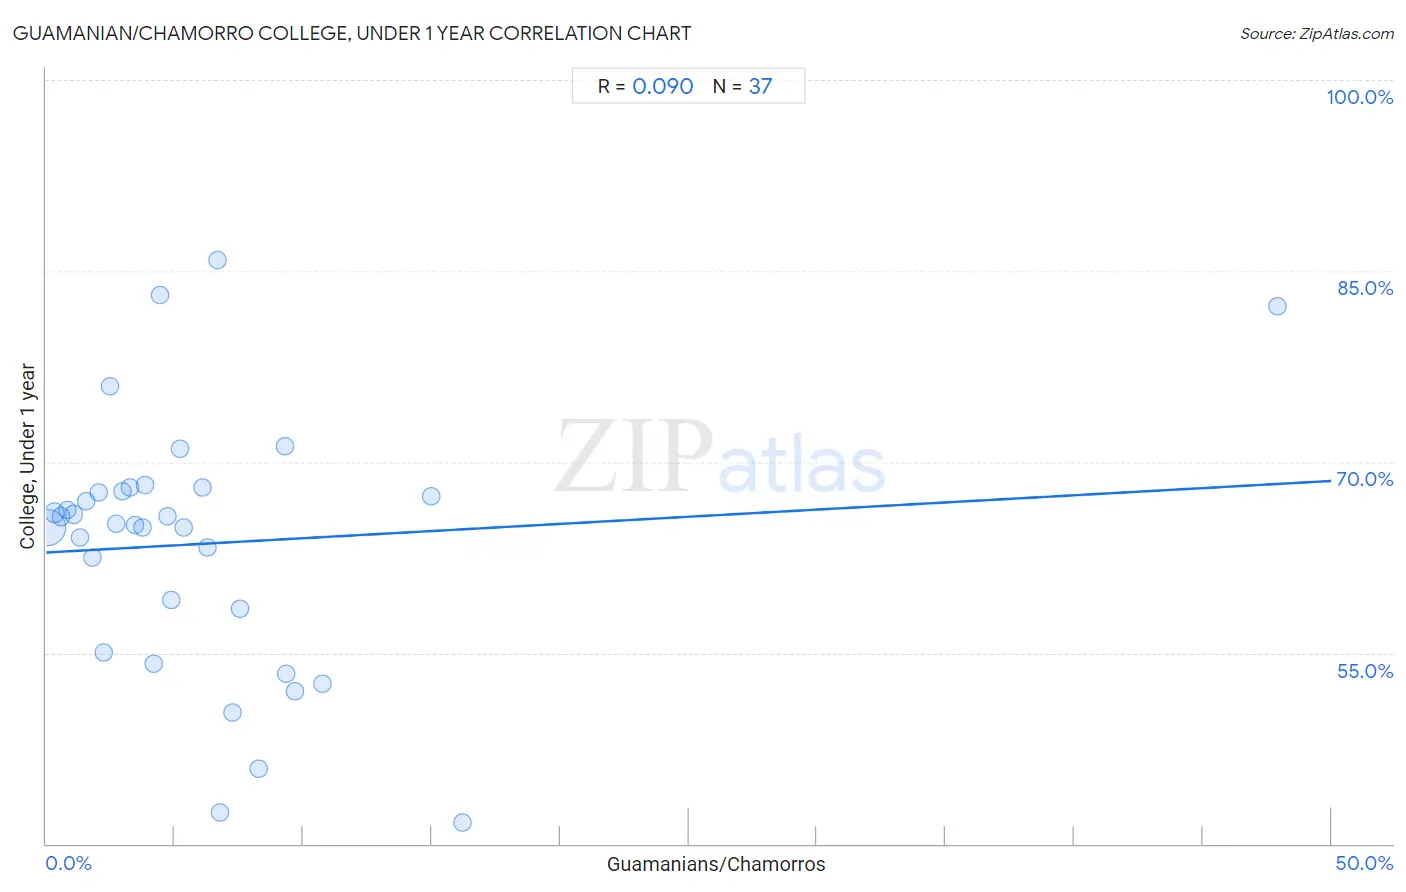
Guamanian/Chamorro College, Under 1 year Correlation Chart
The statistical analysis conducted on geographies consisting of 221,965,438 people shows a slight positive correlation between the proportion of Guamanians/Chamorros and percentage of population with at least college, under 1 year education in the United States with a correlation coefficient (R) of 0.090 and weighted average of 65.4%. On average, for every 1% (one percent) increase in Guamanians/Chamorros within a typical geography, there is an increase of 0.11% in percentage of population with at least college, under 1 year education.
It is essential to understand that the correlation between the percentage of Guamanians/Chamorros and percentage of population with at least college, under 1 year education does not imply a direct cause-and-effect relationship. It remains uncertain whether the presence of Guamanians/Chamorros influences an upward or downward trend in the level of percentage of population with at least college, under 1 year education within an area, or if Guamanians/Chamorros simply ended up residing in those areas with higher or lower levels of percentage of population with at least college, under 1 year education due to other factors.
Demographics Similar to Guamanians/Chamorros by College, Under 1 year
In terms of college, under 1 year, the demographic groups most similar to Guamanians/Chamorros are German Russian (65.4%, a difference of 0.0%), Immigrants from North Macedonia (65.4%, a difference of 0.020%), French (65.4%, a difference of 0.030%), Scotch-Irish (65.4%, a difference of 0.060%), and Immigrants from Bosnia and Herzegovina (65.4%, a difference of 0.080%).
| Demographics | Rating | Rank | College, Under 1 year |
| South American Indians | 54.4 /100 | #172 | Average 65.5% |
| Swiss | 53.9 /100 | #173 | Average 65.5% |
| Immigrants from Bosnia and Herzegovina | 50.0 /100 | #174 | Average 65.4% |
| Scotch-Irish | 49.5 /100 | #175 | Average 65.4% |
| French | 48.9 /100 | #176 | Average 65.4% |
| Immigrants from North Macedonia | 48.6 /100 | #177 | Average 65.4% |
| German Russians | 48.3 /100 | #178 | Average 65.4% |
| Guamanians/Chamorros | 48.2 /100 | #179 | Average 65.4% |
| Dutch | 46.1 /100 | #180 | Average 65.3% |
| Spaniards | 45.5 /100 | #181 | Average 65.3% |
| Immigrants from Africa | 44.7 /100 | #182 | Average 65.3% |
| Immigrants from Poland | 42.6 /100 | #183 | Average 65.2% |
| Bermudans | 42.0 /100 | #184 | Average 65.2% |
| Sri Lankans | 41.7 /100 | #185 | Average 65.2% |
| Immigrants from Sierra Leone | 39.7 /100 | #186 | Fair 65.1% |
Guamanian/Chamorro College, Under 1 year Correlation Summary
| Measurement | Guamanian/Chamorro Data | College, Under 1 year Data |
| Minimum | 0.066% | 41.7% |
| Maximum | 47.9% | 85.9% |
| Range | 47.8% | 44.2% |
| Mean | 6.2% | 63.6% |
| Median | 4.4% | 65.1% |
| Interquartile 25% (IQ1) | 2.1% | 56.8% |
| Interquartile 75% (IQ3) | 7.4% | 67.9% |
| Interquartile Range (IQR) | 5.3% | 11.1% |
| Standard Deviation (Sample) | 8.0% | 10.0% |
| Standard Deviation (Population) | 7.9% | 9.9% |
Correlation Details
| Guamanian/Chamorro Percentile | Sample Size | College, Under 1 year |
[ 0.0% - 0.5% ] 0.066% | 190,874,624 | 64.8% |
[ 0.0% - 0.5% ] 0.33% | 20,076,615 | 66.0% |
[ 0.5% - 1.0% ] 0.58% | 5,638,920 | 65.7% |
[ 0.5% - 1.0% ] 0.82% | 2,559,515 | 66.2% |
[ 1.0% - 1.5% ] 1.08% | 1,257,939 | 65.9% |
[ 1.0% - 1.5% ] 1.29% | 482,955 | 64.1% |
[ 1.5% - 2.0% ] 1.54% | 411,419 | 66.9% |
[ 1.5% - 2.0% ] 1.78% | 203,350 | 62.5% |
[ 2.0% - 2.5% ] 2.04% | 135,642 | 67.6% |
[ 2.0% - 2.5% ] 2.22% | 66,564 | 55.1% |
[ 2.0% - 2.5% ] 2.49% | 49,703 | 76.0% |
[ 2.5% - 3.0% ] 2.74% | 25,519 | 65.1% |
[ 2.5% - 3.0% ] 2.99% | 30,241 | 67.7% |
[ 3.0% - 3.5% ] 3.26% | 27,988 | 68.0% |
[ 3.0% - 3.5% ] 3.45% | 45,984 | 65.0% |
[ 3.5% - 4.0% ] 3.75% | 10,775 | 64.8% |
[ 3.5% - 4.0% ] 3.86% | 4,608 | 68.2% |
[ 4.0% - 4.5% ] 4.19% | 7,782 | 54.2% |
[ 4.0% - 4.5% ] 4.40% | 5,199 | 83.1% |
[ 4.5% - 5.0% ] 4.72% | 25,535 | 65.7% |
[ 4.5% - 5.0% ] 4.88% | 3,748 | 59.1% |
[ 5.0% - 5.5% ] 5.22% | 1,974 | 71.0% |
[ 5.0% - 5.5% ] 5.36% | 261 | 64.9% |
[ 6.0% - 6.5% ] 6.07% | 4,758 | 68.0% |
[ 6.0% - 6.5% ] 6.27% | 1,642 | 63.3% |
[ 6.5% - 7.0% ] 6.65% | 857 | 85.9% |
[ 6.5% - 7.0% ] 6.77% | 1,388 | 42.5% |
[ 7.0% - 7.5% ] 7.27% | 1,211 | 50.3% |
[ 7.5% - 8.0% ] 7.55% | 1,669 | 58.4% |
[ 8.0% - 8.5% ] 8.29% | 5,262 | 45.9% |
[ 9.0% - 9.5% ] 9.30% | 172 | 71.2% |
[ 9.0% - 9.5% ] 9.34% | 578 | 53.4% |
[ 9.5% - 10.0% ] 9.70% | 402 | 51.9% |
[ 10.5% - 11.0% ] 10.74% | 121 | 52.6% |
[ 14.5% - 15.0% ] 14.97% | 294 | 67.3% |
[ 16.0% - 16.5% ] 16.19% | 105 | 41.7% |
[ 47.5% - 48.0% ] 47.90% | 119 | 82.3% |