Guamanian/Chamorro Family Households with Children
COMPARE
Guamanian/Chamorro
Select to Compare
Family Households with Children
Guamanian/Chamorro Family Households with Children
29.7%
FAMILY HOUSEHOLDS WITH CHILDREN
100.0/ 100
METRIC RATING
24th/ 347
METRIC RANK
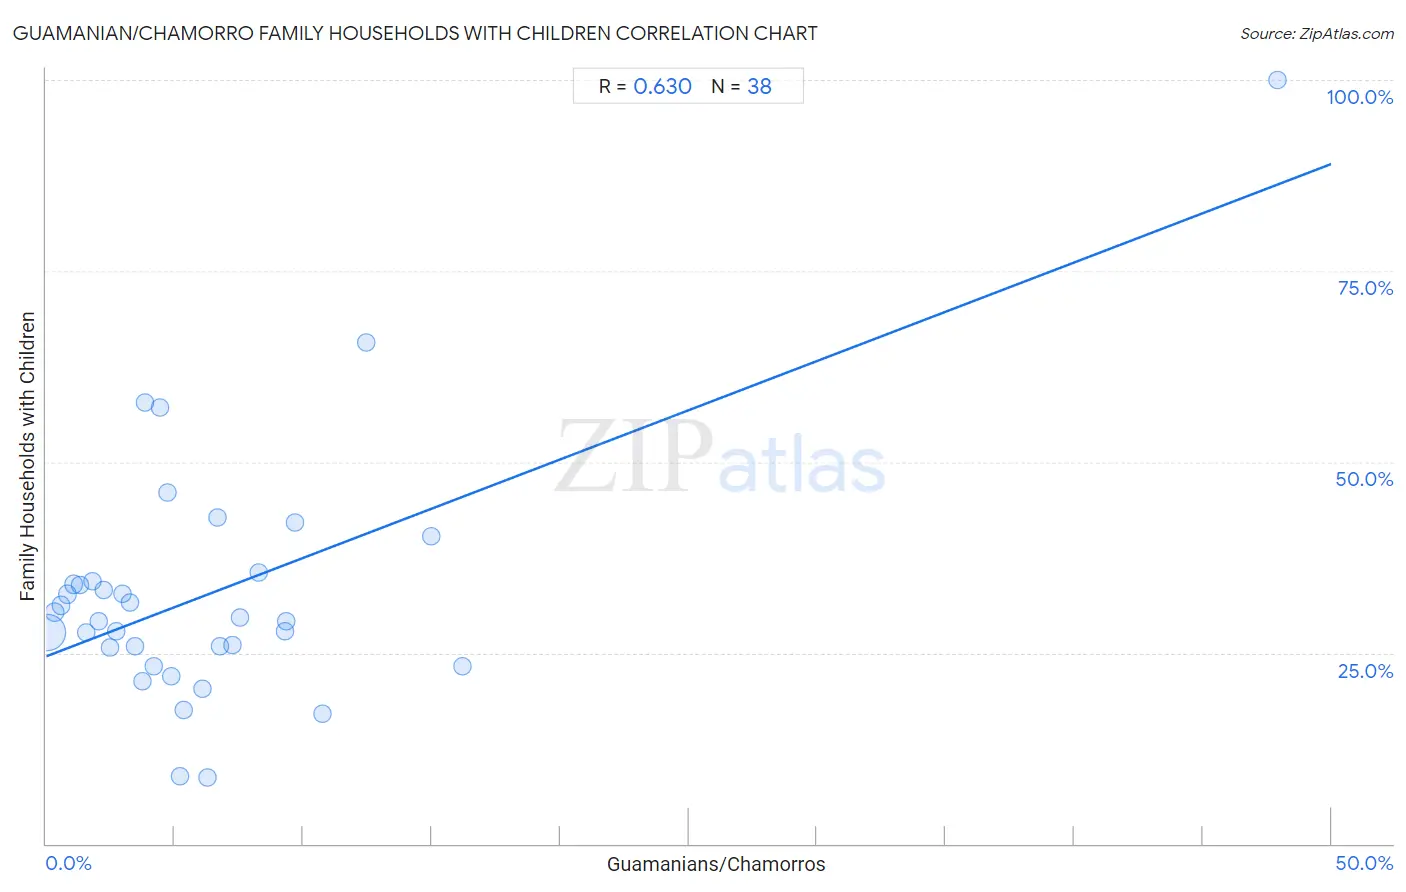
Guamanian/Chamorro Family Households with Children Correlation Chart
The statistical analysis conducted on geographies consisting of 221,827,817 people shows a significant positive correlation between the proportion of Guamanians/Chamorros and percentage of family households with children in the United States with a correlation coefficient (R) of 0.630 and weighted average of 29.7%. On average, for every 1% (one percent) increase in Guamanians/Chamorros within a typical geography, there is an increase of 1.3% in percentage of family households with children.
It is essential to understand that the correlation between the percentage of Guamanians/Chamorros and percentage of family households with children does not imply a direct cause-and-effect relationship. It remains uncertain whether the presence of Guamanians/Chamorros influences an upward or downward trend in the level of percentage of family households with children within an area, or if Guamanians/Chamorros simply ended up residing in those areas with higher or lower levels of percentage of family households with children due to other factors.
Demographics Similar to Guamanians/Chamorros by Family Households with Children
In terms of family households with children, the demographic groups most similar to Guamanians/Chamorros are Mexican American Indian (29.7%, a difference of 0.10%), Immigrants from Latin America (29.7%, a difference of 0.10%), Malaysian (29.8%, a difference of 0.37%), Immigrants from Laos (29.8%, a difference of 0.41%), and Immigrants from El Salvador (29.8%, a difference of 0.45%).
| Demographics | Rating | Rank | Family Households with Children |
| Hispanics or Latinos | 100.0 /100 | #17 | Exceptional 29.9% |
| Salvadorans | 100.0 /100 | #18 | Exceptional 29.9% |
| Alaska Natives | 100.0 /100 | #19 | Exceptional 29.9% |
| Immigrants from El Salvador | 100.0 /100 | #20 | Exceptional 29.8% |
| Immigrants from Laos | 100.0 /100 | #21 | Exceptional 29.8% |
| Malaysians | 100.0 /100 | #22 | Exceptional 29.8% |
| Mexican American Indians | 100.0 /100 | #23 | Exceptional 29.7% |
| Guamanians/Chamorros | 100.0 /100 | #24 | Exceptional 29.7% |
| Immigrants from Latin America | 100.0 /100 | #25 | Exceptional 29.7% |
| Sri Lankans | 100.0 /100 | #26 | Exceptional 29.5% |
| Immigrants from Vietnam | 100.0 /100 | #27 | Exceptional 29.5% |
| Samoans | 100.0 /100 | #28 | Exceptional 29.5% |
| Bolivians | 100.0 /100 | #29 | Exceptional 29.5% |
| Yuman | 100.0 /100 | #30 | Exceptional 29.5% |
| Japanese | 100.0 /100 | #31 | Exceptional 29.4% |
Guamanian/Chamorro Family Households with Children Correlation Summary
| Measurement | Guamanian/Chamorro Data | Family Households with Children Data |
| Minimum | 0.066% | 8.6% |
| Maximum | 47.9% | 100.0% |
| Range | 47.8% | 91.4% |
| Mean | 6.4% | 32.8% |
| Median | 4.6% | 29.4% |
| Interquartile 25% (IQ1) | 2.2% | 25.8% |
| Interquartile 75% (IQ3) | 7.5% | 34.4% |
| Interquartile Range (IQR) | 5.3% | 8.7% |
| Standard Deviation (Sample) | 8.0% | 16.3% |
| Standard Deviation (Population) | 7.9% | 16.1% |
Correlation Details
| Guamanian/Chamorro Percentile | Sample Size | Family Households with Children |
[ 0.0% - 0.5% ] 0.066% | 190,834,572 | 27.7% |
[ 0.0% - 0.5% ] 0.33% | 20,052,125 | 30.3% |
[ 0.5% - 1.0% ] 0.58% | 5,589,142 | 31.2% |
[ 0.5% - 1.0% ] 0.82% | 2,548,877 | 32.7% |
[ 1.0% - 1.5% ] 1.08% | 1,256,534 | 34.0% |
[ 1.0% - 1.5% ] 1.29% | 477,459 | 33.8% |
[ 1.5% - 2.0% ] 1.54% | 409,001 | 27.6% |
[ 1.5% - 2.0% ] 1.78% | 203,350 | 34.4% |
[ 2.0% - 2.5% ] 2.04% | 135,023 | 29.1% |
[ 2.0% - 2.5% ] 2.22% | 66,564 | 33.2% |
[ 2.0% - 2.5% ] 2.49% | 49,703 | 25.8% |
[ 2.5% - 3.0% ] 2.74% | 24,329 | 27.8% |
[ 2.5% - 3.0% ] 2.99% | 30,241 | 32.7% |
[ 3.0% - 3.5% ] 3.26% | 27,988 | 31.6% |
[ 3.0% - 3.5% ] 3.45% | 45,984 | 25.8% |
[ 3.5% - 4.0% ] 3.75% | 9,680 | 21.2% |
[ 3.5% - 4.0% ] 3.87% | 4,243 | 57.8% |
[ 4.0% - 4.5% ] 4.19% | 7,782 | 23.2% |
[ 4.0% - 4.5% ] 4.41% | 5,379 | 57.1% |
[ 4.5% - 5.0% ] 4.73% | 24,967 | 46.0% |
[ 4.5% - 5.0% ] 4.88% | 3,748 | 21.9% |
[ 5.0% - 5.5% ] 5.22% | 1,974 | 8.8% |
[ 5.0% - 5.5% ] 5.36% | 261 | 17.5% |
[ 6.0% - 6.5% ] 6.07% | 4,758 | 20.2% |
[ 6.0% - 6.5% ] 6.27% | 1,642 | 8.6% |
[ 6.5% - 7.0% ] 6.65% | 857 | 42.7% |
[ 6.5% - 7.0% ] 6.77% | 1,388 | 25.9% |
[ 7.0% - 7.5% ] 7.27% | 1,211 | 26.0% |
[ 7.5% - 8.0% ] 7.55% | 1,669 | 29.6% |
[ 8.0% - 8.5% ] 8.29% | 5,262 | 35.5% |
[ 9.0% - 9.5% ] 9.30% | 172 | 27.9% |
[ 9.0% - 9.5% ] 9.34% | 578 | 29.2% |
[ 9.5% - 10.0% ] 9.70% | 402 | 42.1% |
[ 10.5% - 11.0% ] 10.74% | 121 | 17.1% |
[ 12.0% - 12.5% ] 12.46% | 313 | 65.7% |
[ 14.5% - 15.0% ] 14.97% | 294 | 40.3% |
[ 16.0% - 16.5% ] 16.19% | 105 | 23.3% |
[ 47.5% - 48.0% ] 47.90% | 119 | 100.0% |